 Minglong Gao1†
 Guanghua Zhao2,3†
 Shuning Zhang1Zirui Wang1
 Xuanye Wen4Lei Liu1Chen Zhang1Niu Tie5Rula Sa1*
- 1College of Forestry, Inner Mongolia Agricultural University, Hohhot, China
- 2College of Life Sciences, Shanxi Normal University, Taiyuan, China
- 3Administrative office, Shanwei Middle School, Shanwei, China
- 4College of Forestry, Fujian Agriculture and Forestry University, Fuzhou, China
- 5Forestry and Grassland Bureau of Inner Mongolia Autonomous Region, Hohhot, China
Larix gmelinii (Rupr.) Kuzen is a major tree species with high economic and ecological value in the Greater Khingan Mountains coniferous forest of Northeast China. Reconstructing the priority Conservation Area of Larix gmelinii under Climate could provide a scientific basis for its germplasm conservation and management. The present study used ensemble and Marxan model simulations to predict species distribution areas and delineate priority conservation areas for Larix gmelinii in relation to productivity characteristics, understory plant diversity characteristics, and climate change impacts. The study revealed that the Greater Khingan Mountains and the Xiaoxing'an Mountains, with an area of approximately 300 974.2 km2, were the most suitable for L. gmelinii. The stand productivity of L. gmelinii in the most suitable area was significantly higher than that in the less suitable and marginally suitable areas, but understory plant diversity was not dominant. The increase in temperature under future climate change scenarios will reduce the potential distribution and area under L. gmelinii; the species will migrate to higher latitudes of the Greater Khingan Mountains, while the degree of niche migration will gradually increase. Under the 2090s-SSP585 climate scenario, the most suitable area for L. gmelinii will completely disappear, and the climate model niche will be completely separated. Therefore, the protected area of L. gmelinii was demarcated with a target of the productivity characteristics, understory plant diversity characteristics and climate change sensitive area, and the current key protected area was 8.38 × 10⁴ km2. Overall, the study’s findings will lay a foundation for the protection and rational development and utilization of cold temperate coniferous forests dominated by L. gmelinii in the northern forested region of the Greater Khingan Mountains.
1 Introduction
Global warming caused by the annual increase in greenhouse gas emissions has become a global problem (Chamorro et al., 2020). The major abiotic factor affecting species distribution is climate, and biome changes may occur on nearly 35% of the Earth’s land surface if the global temperature increases by 4°C (Bezeng et al., 2017; Trindade et al., 2020; Villén-Peréz et al., 2020; IPCC, 2021). Larix gmelinii (Rupr.) Kuzen is a robust light-loving species with high water requirements and is widely distributed in the Greater Khingan Mountains (>70% area). It is considered a zonal vegetation of this area (Fu et al., 1999; Cui et al., 2000). Forests with L. gmelinii as the major tree species play a crucial role in air purification and water conservation in the Greater Khingan Mountains. Its wood also has high economic value and can be used for housing construction, civil engineering, electric poles, boats, joinery, and wood fiber industrial raw materials (Fu et al., 1999). Additionally, the content of arabinogalactan (AG) in the heartwood of L. gmelinii is the most abundant component, reaching approximately 30%. The species has been used in food and healthcare products (Grabner et al., 2005; Ito et al., 2020). An analysis of the tree rings showed that L. gmelinii is extremely sensitive to climate change, showing obvious changes in annual ring width (Sano et al., 2009). L. gmelinii forests with L. gmelinii as the main species often form a large area of simple forest. This species comprises China’s largest cold temperate forest, an ecosystem susceptible to global warming (Barchenkov, 2011).
With the development of geographic information technology, ecological models, and climate system models, species distribution models (SDMs) have gradually matured (Elith and Leathwick, 2009; Wiens et al., 2009). An SDM is typically based on the environment and the species’ living habits. By combining the data on species distribution with the environmental information of the corresponding location, an SDM predicts the spatial distribution pattern under the present and future climatic conditions and simulates the impact of the climate on species. As important tools for change response, SDMs have been widely used in research on species invasion, protection of endangered animals and plants, biological distribution in paleoclimate periods, and variations in species distribution under changing climatic conditions (Tanaka et al., 2020; Sun et al., 2021b; Wen et al., 2022). Similar to other ecological models, niche models exhibit prediction uncertainties, and these models are associated with model algorithms and parameters, species’ actual locations, and environmental variables; thus, selecting the most suitable model to estimate the suitable distribution range of different species is challenging (Pearson et al., 2006). Currently, researchers use random forest, the maximum entropy model, the generalized linear model, and the generalized additive model (Duque-Lazo et al., 2016; Arabameri et al., 2020). These SDMs employ different model algorithms and database schemes to determine the ecological dimensions and potential distributions based on different theoretical foundations and assumptions. Each model possesses unique advantages and disadvantages; however, none perfectly simulates species’ potential geographic distribution (Araújo and New, 2007).
The platform Biomod2, based on R software, provides ten commonly used SDM algorithms, and users can freely combine and customize the ensemble model for the studied species (Thuiller et al., 2009; Duque-Lazo et al., 2018). Although the inherent defects of each model cannot be avoided, assigning each model’s weight based on the TSS (true skill statistic) or ROC (receiver operating characteristic curve) will help achieve the best simulation effect in the ensemble model (Shabani et al., 2016; Hao et al., 2019).
Thus, the present study employed Biomod2 to analyze the appropriate/suitable distribution areas of L. gmelinii under different climatic conditions and the correlation between the stand structure and growth characteristics of natural L. gmelinii forests and the environmental variables. The study aimed to (1) predict the variations in L. gmelinii suitable areas under different climate scenarios, (2) analyze the crucial environmental features affecting the distribution of L. gmelinii, (3) analyze the changes in the L. gmelinii ecological niche under different future climatic conditions, (4) analyze the influence of habitat suitability on L. gmelinii stand productivity and understory biodiversity, and (5) zone the scope of L. gmelinii key protected areas. The study’s findings will lay a foundation for the protection and rational development and utilization of cold temperate coniferous forests dominated by L. gmelinii in the northern forests of the Greater Khingan Mountains.
2 Materials and methods
2.1 Collection of sample and species distribution records
From 2017 to 2021, a total of 75 L. gmelinii distribution points were obtained through field investigations in the Inner Mongolia Autonomous Region and Heilongjiang Province. One distribution site (5 km × 5 km) was maintained per grid to avoid model overfitting caused by an excessive overconcentration of distribution sites. Finally, 46 valid samples were acquired, as shown in Figures 1B, C.
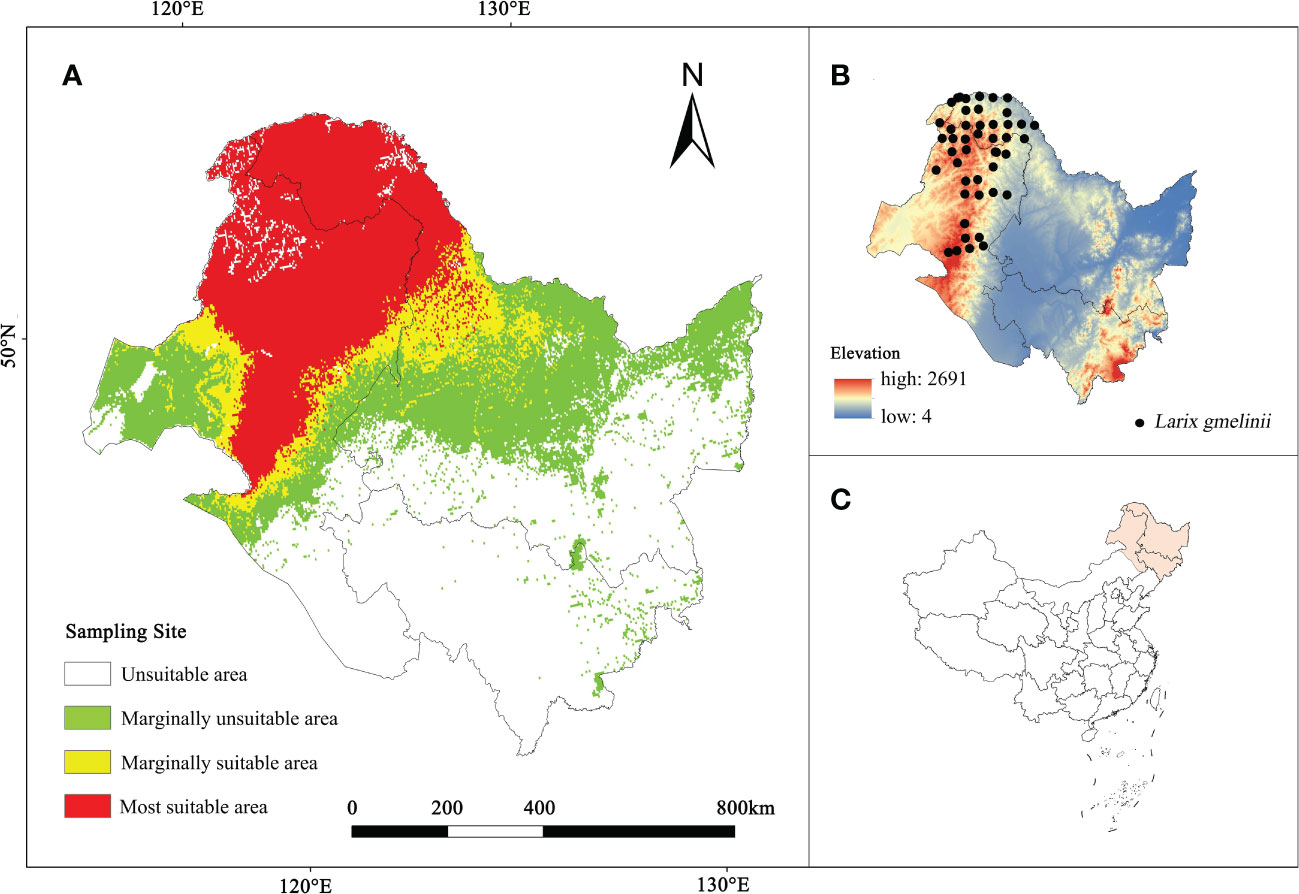
Figure 1 (A) The current habitat suitability area of L. gmelinii. (B) L. gmelinii sampling sites in China. (C) Location of the study area in China.
2.2 Selection and processing of environmental features for modeling
The study used 76 environmental features, including 54 climate factors, 14 soil factors, 4 terrain factors, 1 land cover factor, 1 human footprint factor, 1 normalized difference vegetation index (NDVI) factor, and 1 total primary productivity factor. We collected the current and future climate data from the WorldClim database (http://worldclim.org/data/index.html) (Fick and Hijmans, 2017). Here, future climate data under three shared socioeconomic pathway (SSP) scenarios were collected from the Beijing Climate Center Climate System Model (BCC-CSM2-MR), representing low (SSP126), medium (SSP245), and high (SSP585) concentrations of greenhouse gas emissions (Sun et al., 2021a). In addition, we collected soil and topographic data from the Harmonized World Soil Database (HWSD) of the Food and Agriculture Organization (http://www.fao.org/faostat/en/#data) (Milovac et al., 2018), human footprint data from the Human Footprint dataset (2009) in NASA’s Earth Observing System Data and Information System (EOSDIS) (Venter et al., 2016), land cover data from Tsinghua University’s Land Cover Remote Sensing Monitoring Raster Database (2017) (http://data.ess.tsinghua.edu.cn/fromglc10_2017v01.html), and NDVI data and total primary productivity data from the MODIS (https://ladsweb.modaps.eosdis.nasa.gov/search/order/1/MOD17A3) dataset. We obtained data on all variables at a 2.5 arc-minute spatial resolution (approximately 25 km).
To avoid the influence of multicollinearity of variables on the prediction accuracy (Yang et al., 2013), multicollinearity (Spearman correlation) and variance inflation factor (VIF) tests were performed for all environmental features in R (version 4.1.3). After eliminating the environmental factors with Spearman values< 0.7 and VIF< 5 (Elith et al., 2006; Zhao et al., 2021), nine climate variables (annual mean temperature, annual precipitation, isothermality, maximum temperature in the hottest month, mean temperature of the warmest quarter, minimum temperature in the coldest month, mean temperature of the coldest quarter, precipitation in September, and solar radiation in September), three soil variables (topsoil saturation, bulk density, and gravel content), two environmental variables (NDVI, primary productivity, and land cover), one human variable (footprint), and two topographic variables (elevation, landform) were preserved in the final model.
2.3 Construction of the ensemble model
Ensemble modeling of species distribution was performed based on species presence and pseudo-absence data using Biomod2. During the process, 470 pseudo-presence data points were randomly generated for model simulation using the ‘random’ function. The model parameters were optimized, and 75% of the sample data were selected for the training model using the ‘biomod-tuning’ command; the remaining 25% of the data were used to validate the predictive performance of the model. Finally, the split-sample process was repeated ten times, resulting in 100 model simulations. We then used AUC (area under the curve), a threshold-independent measure, and TSS (true skill statistic), a threshold-dependent measure, to assess the prediction accuracy of the model. A single model with TSS ≥ 0.7 was retained, and the chosen models were combined to construct a model using the weighted average method (Allouche et al., 2006). Then, a threshold (cutoff) of 0/1 was used to identify suitable areas. The regions above the threshold were divided into two equal parts, one with medium suitability and the other with high suitability; the areas below the threshold were considered unsuitable. Finally, a map showing the areas with different suitabilities was generated using ArcGIS v10.4.1.
2.4 Niche changes
The background points under the present climatic conditions were selected based on the L. gmelinii distribution point and the 1-degree buffer distance. Through the distribution points and climate data under different climate backgrounds, the package ‘ecospat’ was used to determine the L. gmelinii niche overlap rate in the current scenario and under different future climate backgrounds, visualize the changes in the niche, and calculate the niche parameter D (observed value), which ranges from 0 to 1, indicating that the niche ranges from no stacking to full stacking, to assess the influence of climate change on the L. gmelinii niche (Di Cola et al., 2017).
2.5 Analysis of stand characteristics
In this study, 75 L. gmelinii plots (30 m × 30 m) were set up in the Greater Khingan Mountains from 2017 to 2021. Within the plot, the diameter at breast height (DBH) of trees at 5 cm height was measured, and the tree height, DBH, and plant density were investigated. The binary volume table was queried to calculate the volume per unit area, and the relative growth method was used to estimate the biomass of trees. The formula is expressed as follows (Shingleton and Frankino, 2018):
where Y is the tree biomass, D is DBH, H is the tree height, and a and b indicate the constants obtained by regression.
Two large (10 m × 10 m) shrub squares were set up at opposite corners of the plot, and three small (1 m × 1 m) herb squares were set up at the three corners of the shrub square. The R open-source package ‘spaa’ was used to determine the Shannon, Pielou, Simpson, Dma, and other indexes of the biodiversity of shrub and herb species.
Among the 75 L. gmelinii plots, 57 were located in the most suitable area, 14 in the marginally suitable area, and 4 in the marginally unsuitable areas. To study the possible impact of habitat suitability on stand productivity and understory plant diversity, “two-way ANOVA” in GraphPad Prism software was used to evaluate the impact of different habitat suitability values on L. gmelinii forest differences in subproductivity and understory plant diversity.
2.6 Analysis of conservation hotspots of L. gmelinii
The Marxan 4.0.6 model is a system protection planning model based on the simulated annealing method and is used to select the minimum cost area under certain economic constraints in a protected system (Moilanen et al., 2009; Hermoso et al., 2011). It was first used in marine protection system planning and has been widely used in terrestrial protection system planning (Munro, 2006). In the analysis, a 1 km2 grid was used as the research unit, and the tool “zonal statistics as table” (Spatial Analyst) in ArcGIS 10.4.1 was used to quantify the habitat distribution area of each target species in each planning unit and construct a species distribution matrix. The conservation area of L. gmelinii should reach 80% of the future loss of area in the potential distribution area due to climate change, and the model iterative operation was performed 100 times to obtain the optimal solution of the planning unit (Tang et al., 2021).
After the iterative calculation of the location selection, the spatial compactness of the adjusted result units was controlled by the boundary length modifier (BLM) of the model. If it is too dense, some planning units with low protection effects may be selected; as a result, the protected area distribution is too discrete (Javed et al., 2019; Tang et al., 2021). Then, the cost of the results and the relationship between the total boundary length and the total area can be analyzed via BLM modification. The larger the BLM value is, the more crucial the boundary cost and the smaller the fragmentation degree. Generally, the BLM value is adjusted between 1 and 10,000, and a more reasonable spatial distribution pattern of protection priority areas is obtained through repeated calculation. The final model used a model boundary correction value of 100.
3 Results
3.1 Model accuracy
All ten models ran successfully and yielded 100 (2 × 5 × 10) results. Furthermore, we optimized the model parameters using the ‘biomod_tuning’ function and verified them at each iteration according to the selected method (kappa, TSS, or ROC). The results revealed RF (Random Forest), with a kappa coefficient of 0.90, TSS of 0.98, and ROC of 0.99, as the most appropriate model for predicting the latent distribution of L. gmelinii (Supplementary Figure 1); this approach was followed by the GBM (Generalized Boosted Models), GLM (Generalized Linear Models), MARS (Multivariate Adaptive Regression Splines), and FDA (Flexible Discriminant Analysis) methods. The ANN (Artificial Neural Networks) method performed the worst among all models and failed the accuracy test. Finally, 35 best model results were chosen to construct the ensemble model (kappa coefficient of 0.92, TSS of 0.98, ROC of 1.00).
3.2 Current period potential distribution area
The analysis revealed (Figure 1A) 397,192.1 km2 as the current L. gmelinii suitable area (the sum of the marginally suitable area and the most suitable area); this region included 300,974.2 km2 of the most suitable area distributed mainly in the Greater Khingan Mountains in the northeastern part of the Inner Mongolia Autonomous Region and northern Heilongjiang Province. The marginally suitable area was 96,217.9 km2, and was distributed mainly in the grassland-forest transition zone on the east side of the most suitable area and from the Xiaoxing’an Mountains to the Zhangguangcai Mountains on the west side.
3.3 Predicted future potential distribution areas
The suitable and most suitable areas of L. gmelinii will be reduced to varying degrees in the future under all climate scenarios compared with the previous period, except in the 2050s-SSP126 climate scenario, in which a small area of newly suitable areas will appear. The other climate scenarios were almost entirely contracted (Table 1 and Figures 2, 3). Under SSP126, the suitable area of L. gmelinii had the slightest change, and the suitable area in the 2050s is reduced by 34.8% compared with the current area, which is approximately 138 235 km2. The suitable area in the 2090s is reduced by 9.3% compared with that in the 2050s, which is 24,124 km2. Under the SSP245 climate scenario, the suitable area in the 2050s is reduced by 46.1% compared with the current total suitable area, with an area of approximately 182,985.9 km2. By the 2090s, the suitable area was further reduced by 43.7%, with an area of approximately 93,576 km2. Under the SSP585 climate scenario, the area suitable for L. gmelinii shrank the most, and the suitable area in the 2050s was reduced by 65.4% compared with the present suitable area, approximately 259,905 km2. The suitable area in the 2090s was reduced by 92.0%, with a value of approximately 126,304 km2, and the most suitable area will disappear entirely at this time.
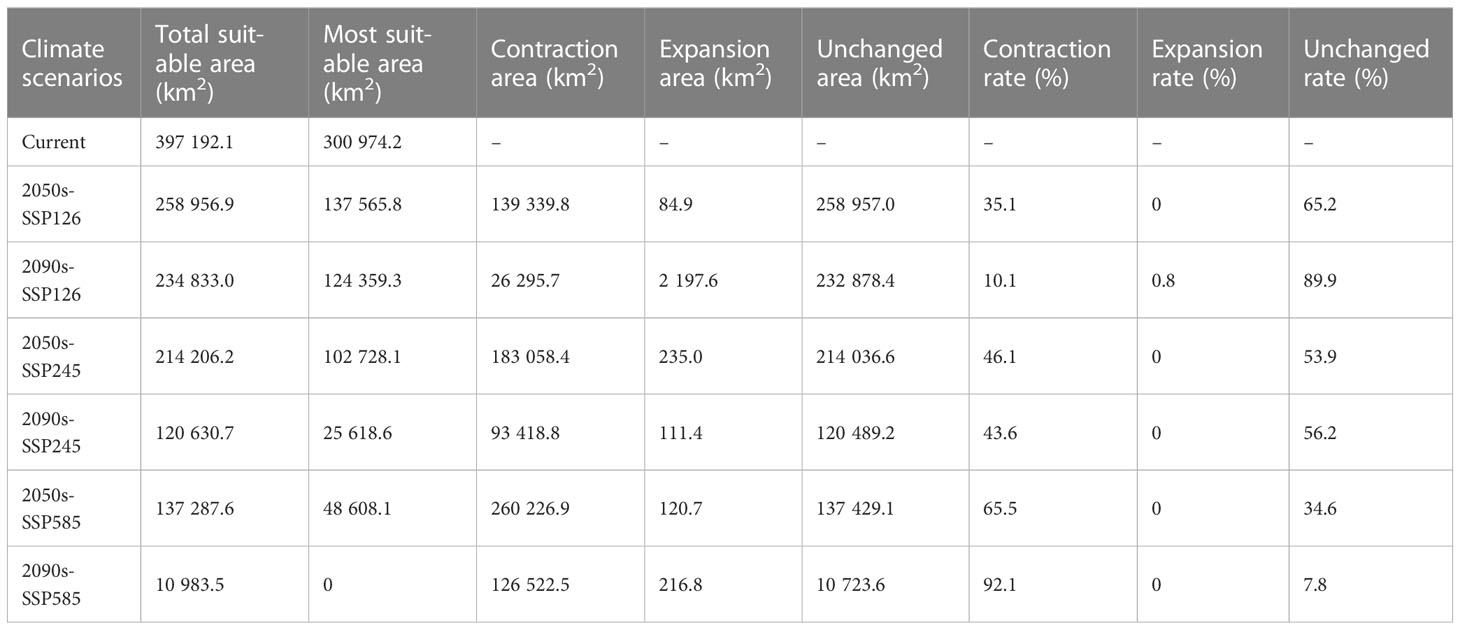
Table 1 The spatial variations in the suitable areas for L. gmelinii under various climate scenarios.
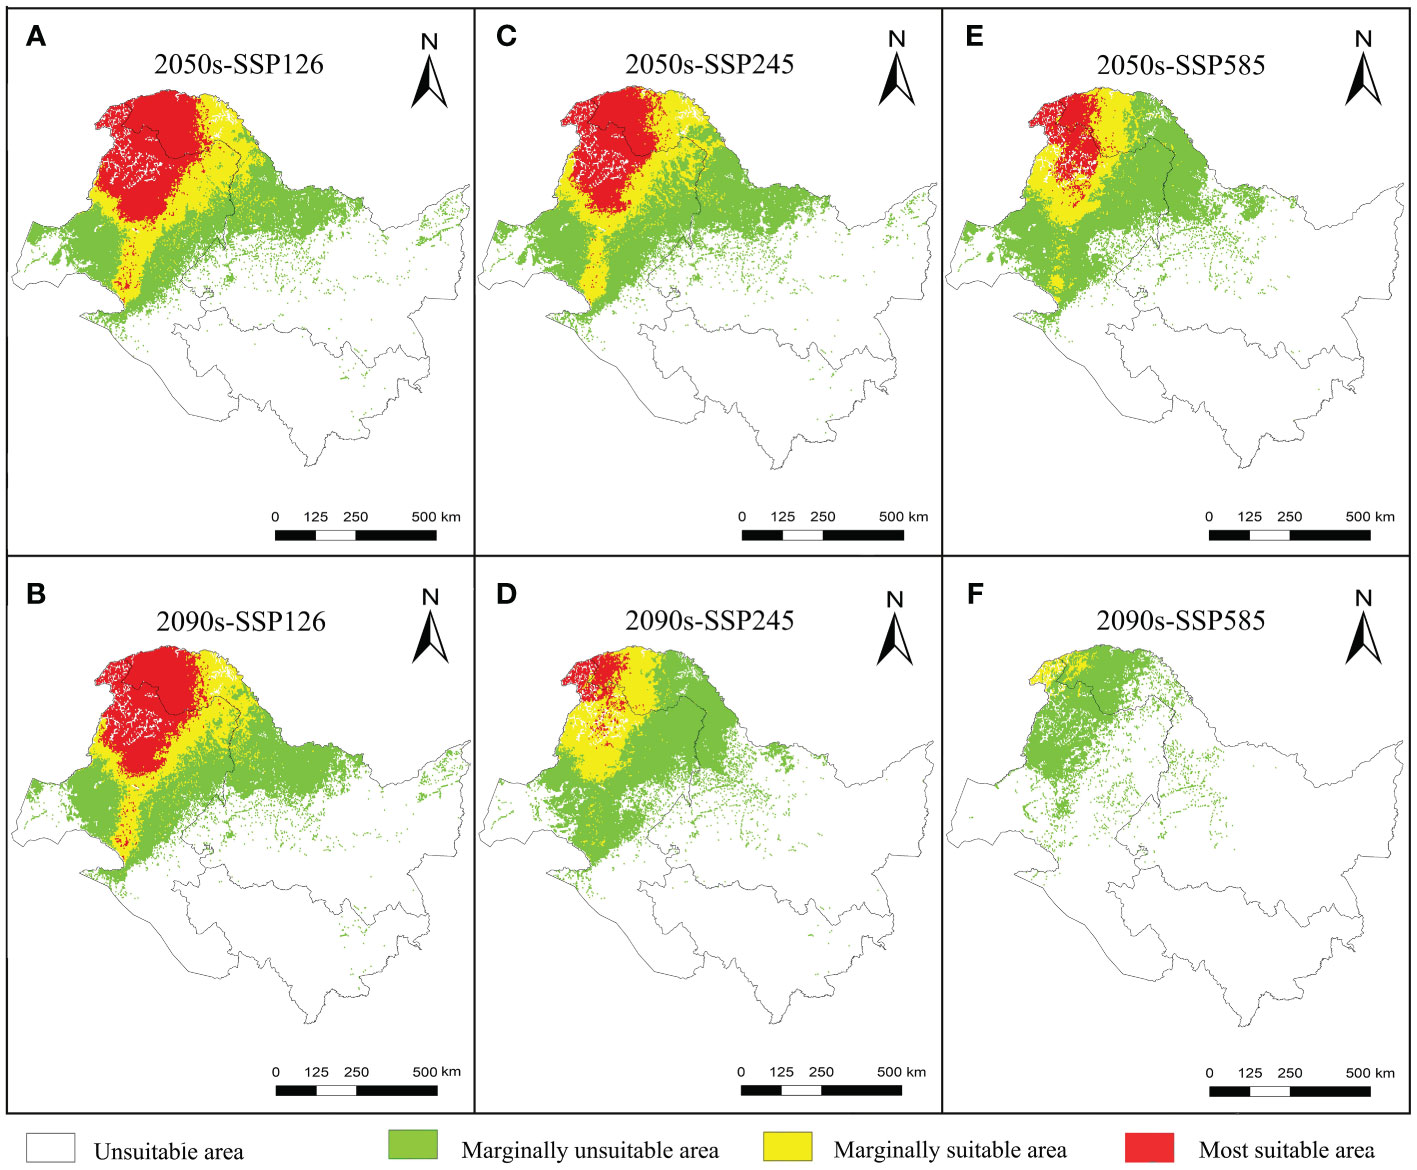
Figure 2 Future potential distribution of L. gmelinii in China.
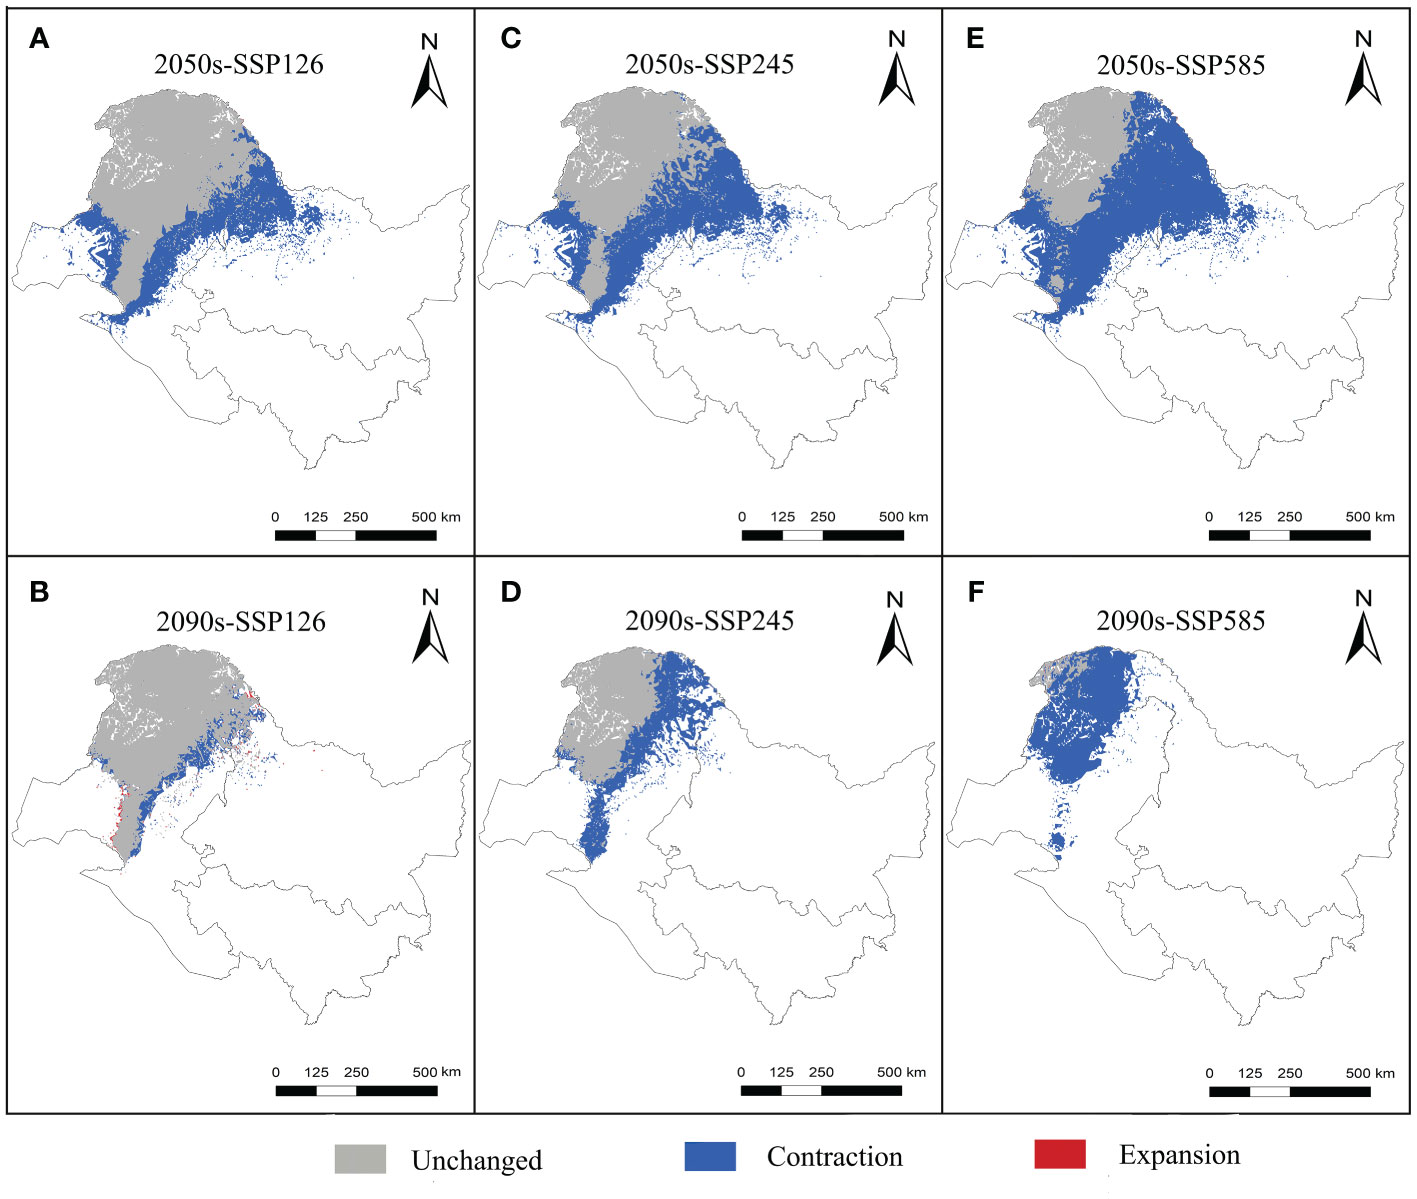
Figure 3 Variations in the spatial distribution pattern of L. gmelinii under various climate scenarios.
The centroids of the suitable area of L. gmelinii migrated northwestward in all climate scenarios (Figure 4). The centroid of the suitable area in the current period was located in Tozamin Township, Oroqen Autonomous Banner (123.13 E, 50.20 N). Under the SSP126 climate scenario, the centroid moved to Ganhe Township of the Oroqen Autonomous Banner (122.80 E, 50.91 N) in the 2050s, and the migration distance is 83.60 km; in the 2090s, the centroid moved to the northwest of Ganhe Township of Oroqen Autonomous Banner (122.74 E, 51.06 N), and the migration distance is 15.92 km. In the SSP245 climate scenario, the centroid moved to Hesi Street, Genhe City (122.60 E, 51.12 N) in the 2050s, with a migration distance of 109.31 km; in the 2090s, the centroid moved to Alongshan Town, Genhe City (121.96 E, 51.61 N), with a migration distance of 70.33 km. In the SSP585 climate scenario, the centroid moved to Jinhe Town, Genhe City (122.07 E, 51.47 N), with a migration distance of 160.43 km; the centroid moved to Moldauga Town, Erguna City (121.57 E, 52.92 N), with a migration distance of 164.55 km in the 2090s.
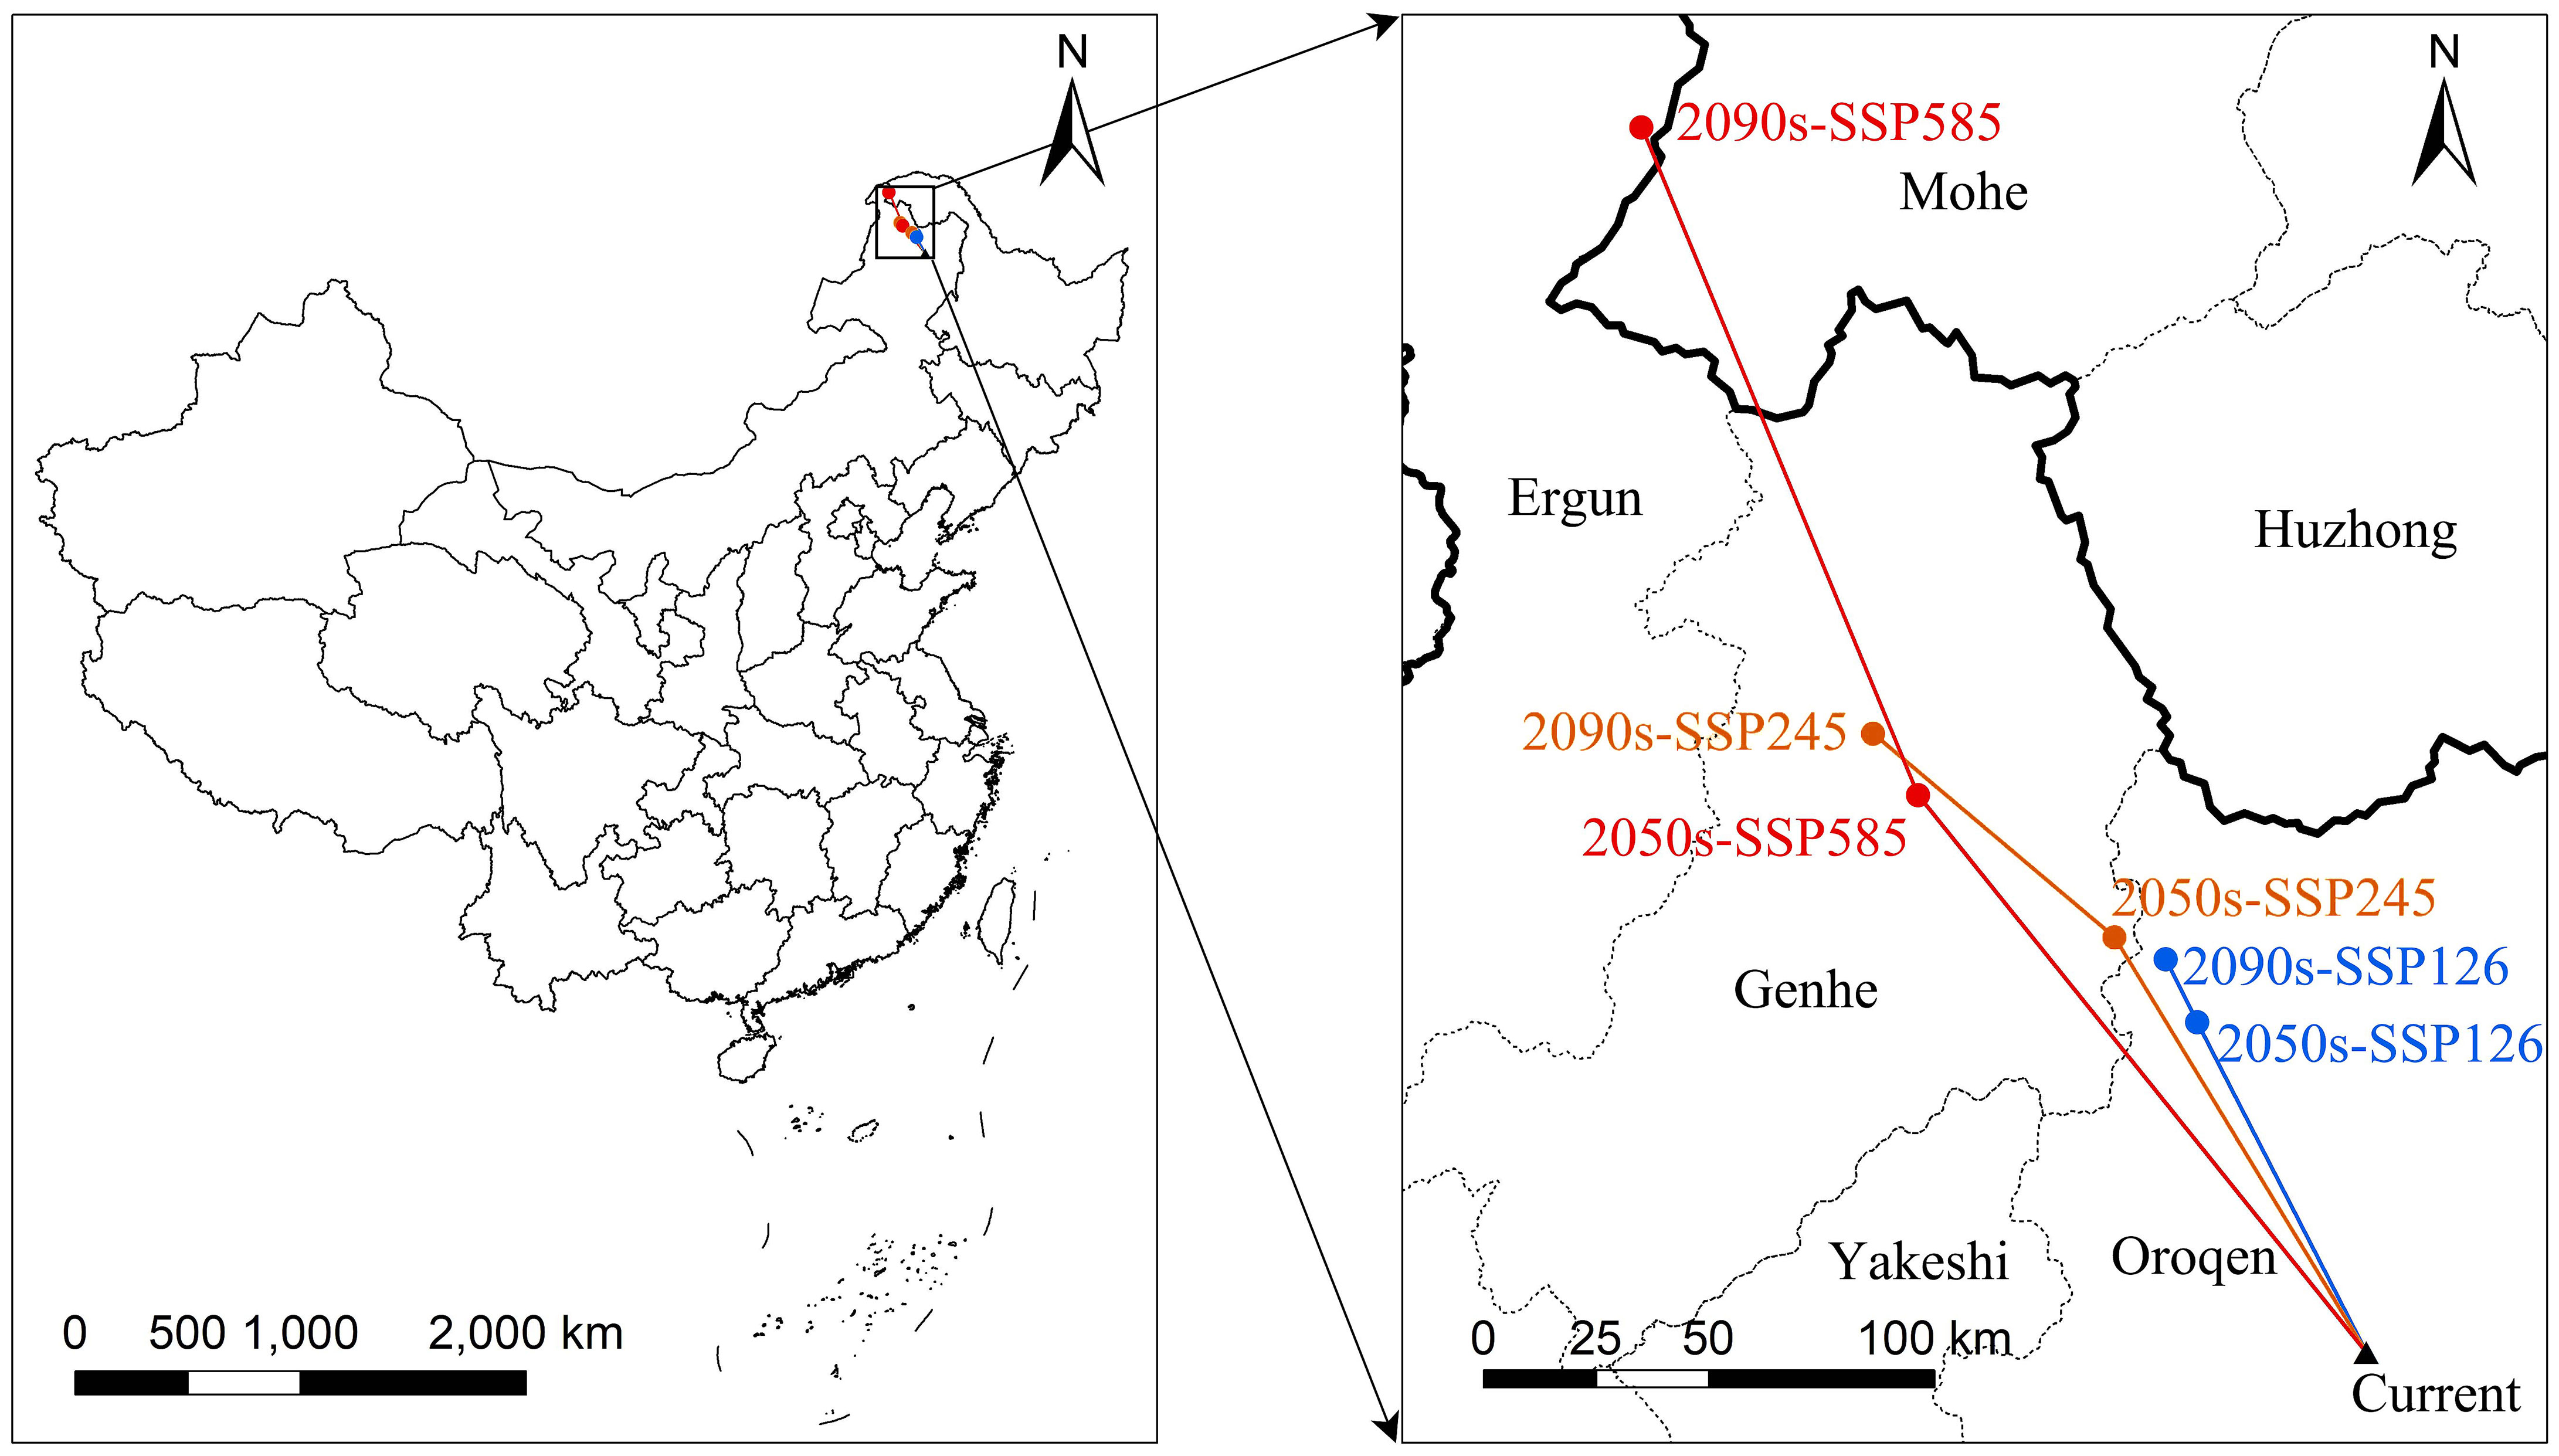
Figure 4 Centroid distributional shifts under different climate scenarios.
3.4 Future changes in ecological niche changes in the future period
The overlap of the L. gmelinii ecological niche is shown in Figure 5. The changes in the climatic niche under different present and future climatic conditions were the same as those of the background climate. Compared with the SSP126 and SSP245 climate backgrounds, the migration distance of the climatic niche in the SSP585 climate background was longer. The L. gmelinii niche was completely separated from the previous period under the 2090s-SSP585 climate background. The magnitude of future global climate change considerably influences the niche shift of L. gmelinii, and the decreasing niche overlap indicates that L. gmelinii will experience a more significant niche shift during future climate change.
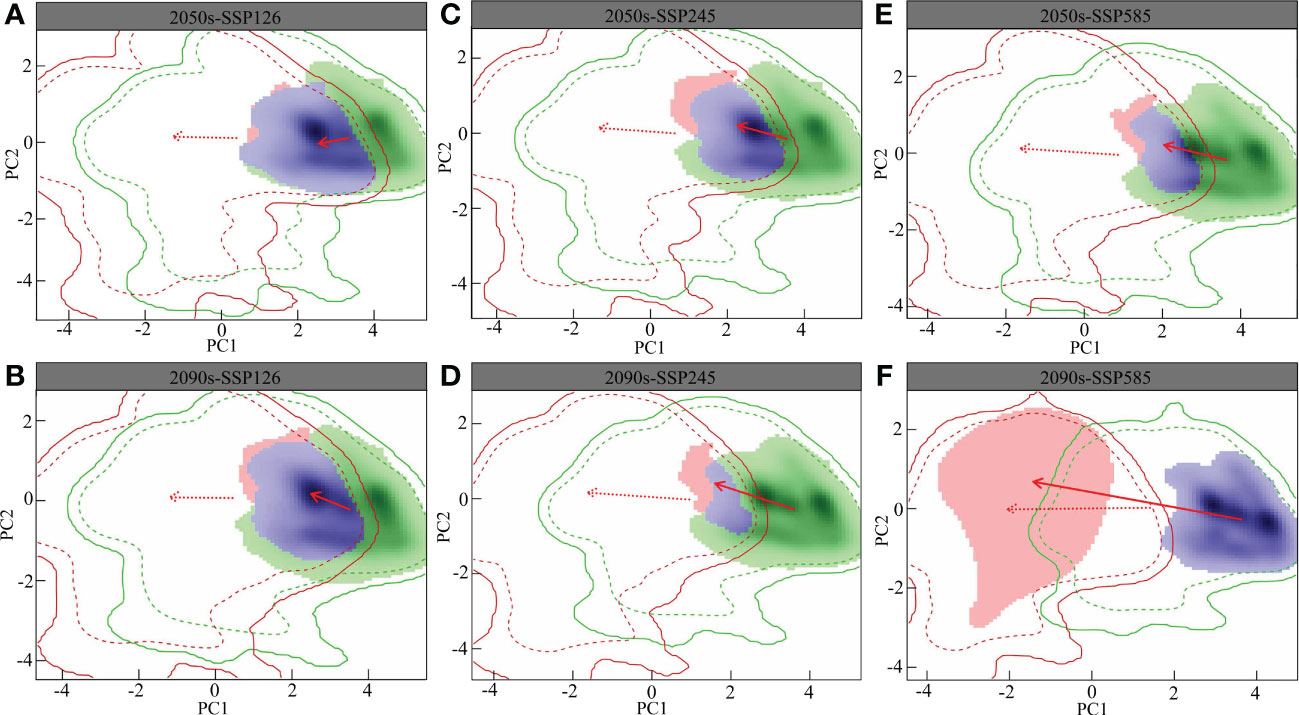
Figure 5 Future L. gmelinii niche under the SSP126 (A, B), SSP245 (C, D) and SSP585 (E, F) scenarios in the 2050s (A, C, E) and 2070s (B, D, F).
In the principal component analysis (PCA) of this research, the two principal components together explained 80.91%-85.15% of the variance in the environmental factors in the study area (PC1: 62.6%-70.5%; PC2: 14.65%-18.03%), i.e., the annual average temperature and the mean temperature of the coldest quarter. In addition, the average annual temperature, the mean temperature of the warmest quarter and the mean temperature of the coldest quarter were the primary factors driving the variations in the L. gmelinii niche, and the future climatic niche center will move closer to the mean temperature of the coldest quarter.
3.5 Analysis of stand characteristics under different habitat suitability values
There were significant differences in stand productivity characteristics and understory plant diversity in the most suitable, marginally suitable, and marginally unsuitable areas (Figure 6). In terms of stand productivity characteristics, the stand volume, biomass, and plant density of L. gmelinii in the marginally suitable and marginally unsuitable areas were lower than those in the most suitable area. In terms of understory plant diversity, there were no significant differences in the Pielou, Shannon−Wiener, and Simpson indexes among the three types of suitable areas, but the L. gmelinii stand in the marginally suitable area had the highest understory shrub species richness index and the greatest height. The most suitable area had the second highest values, and the marginally unsuitable area had the smallest values. The L. gmelinii stand in the most suitable area had the highest species richness index of understory herbs, followed by that in the marginally suitable area, and the lowest value was found in the marginally unsuitable area.
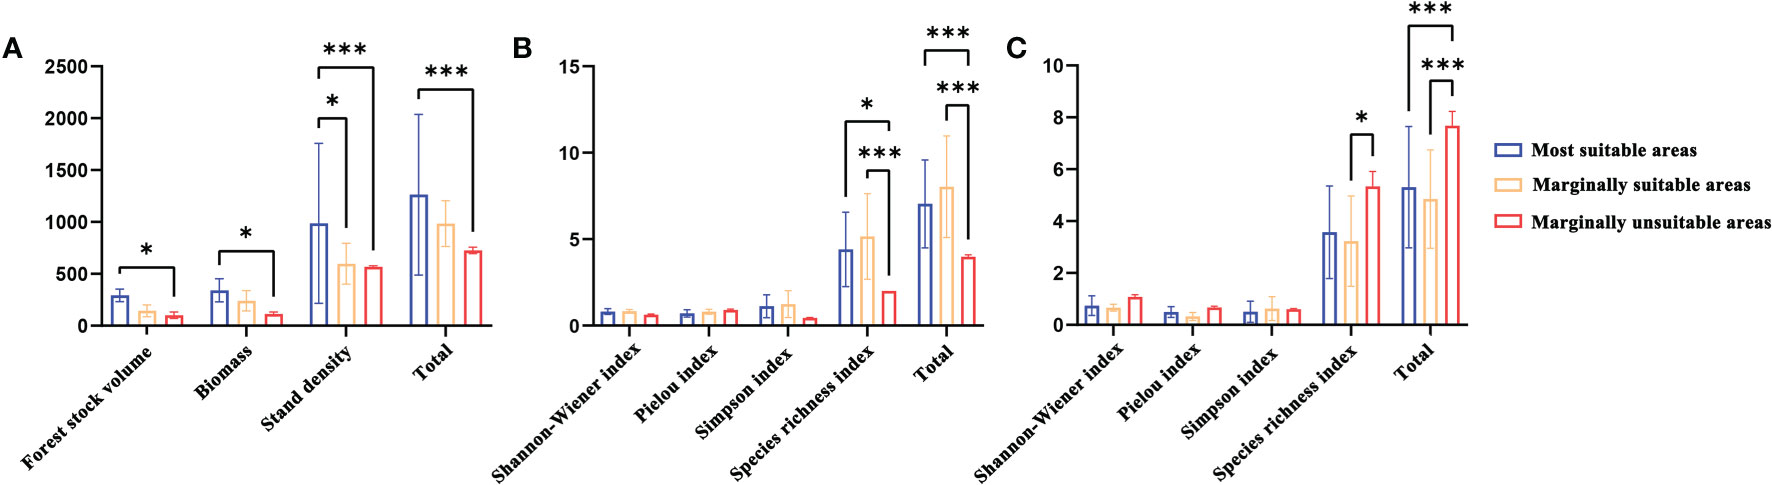
Figure 6 The stand characteristics (A) Stand productivity. (B) Species diversity of shrubs. (C) Species diversity of herbs) of L. gmelinii under different suitable habitats. Note: * and *** indicate significant differences at p ≤ 0.05 and p ≤ 0.01, respectively.
3.6 Division of key protected areas
The purpose of the protected area in the current research was to cover 80% of the area most affected by climate change in the L. gmelinii suitable areas under three future climate scenarios, taking into account the productivity characteristics and understory plant diversity characteristics of L. gmelinii in the different classes of suitable areas. The area of key protected areas in the current period was 8.38 × 10⁴ km2. The eastern and western sides of the Daxing’anling state-owned forests in the northeastern part of the Inner Mongolia Autonomous Region and the northwestern part of Heilongjiang Province had the main L. gmelinii key protected areas. The key protected areas almost completely covered the marginally suitable areas for L. gmelinii (Figure 7). In the future, the area of L. gmelinii priority conservation areas will be expanded together with the increase in climate change. In the 2090s-SSP585 climate scenario, the L. gmelinii focal area reached 28.12 × 10⁴ km2, and most of the L. gmelinii suitable areas in the current period were included in the focal area (Figure 8).
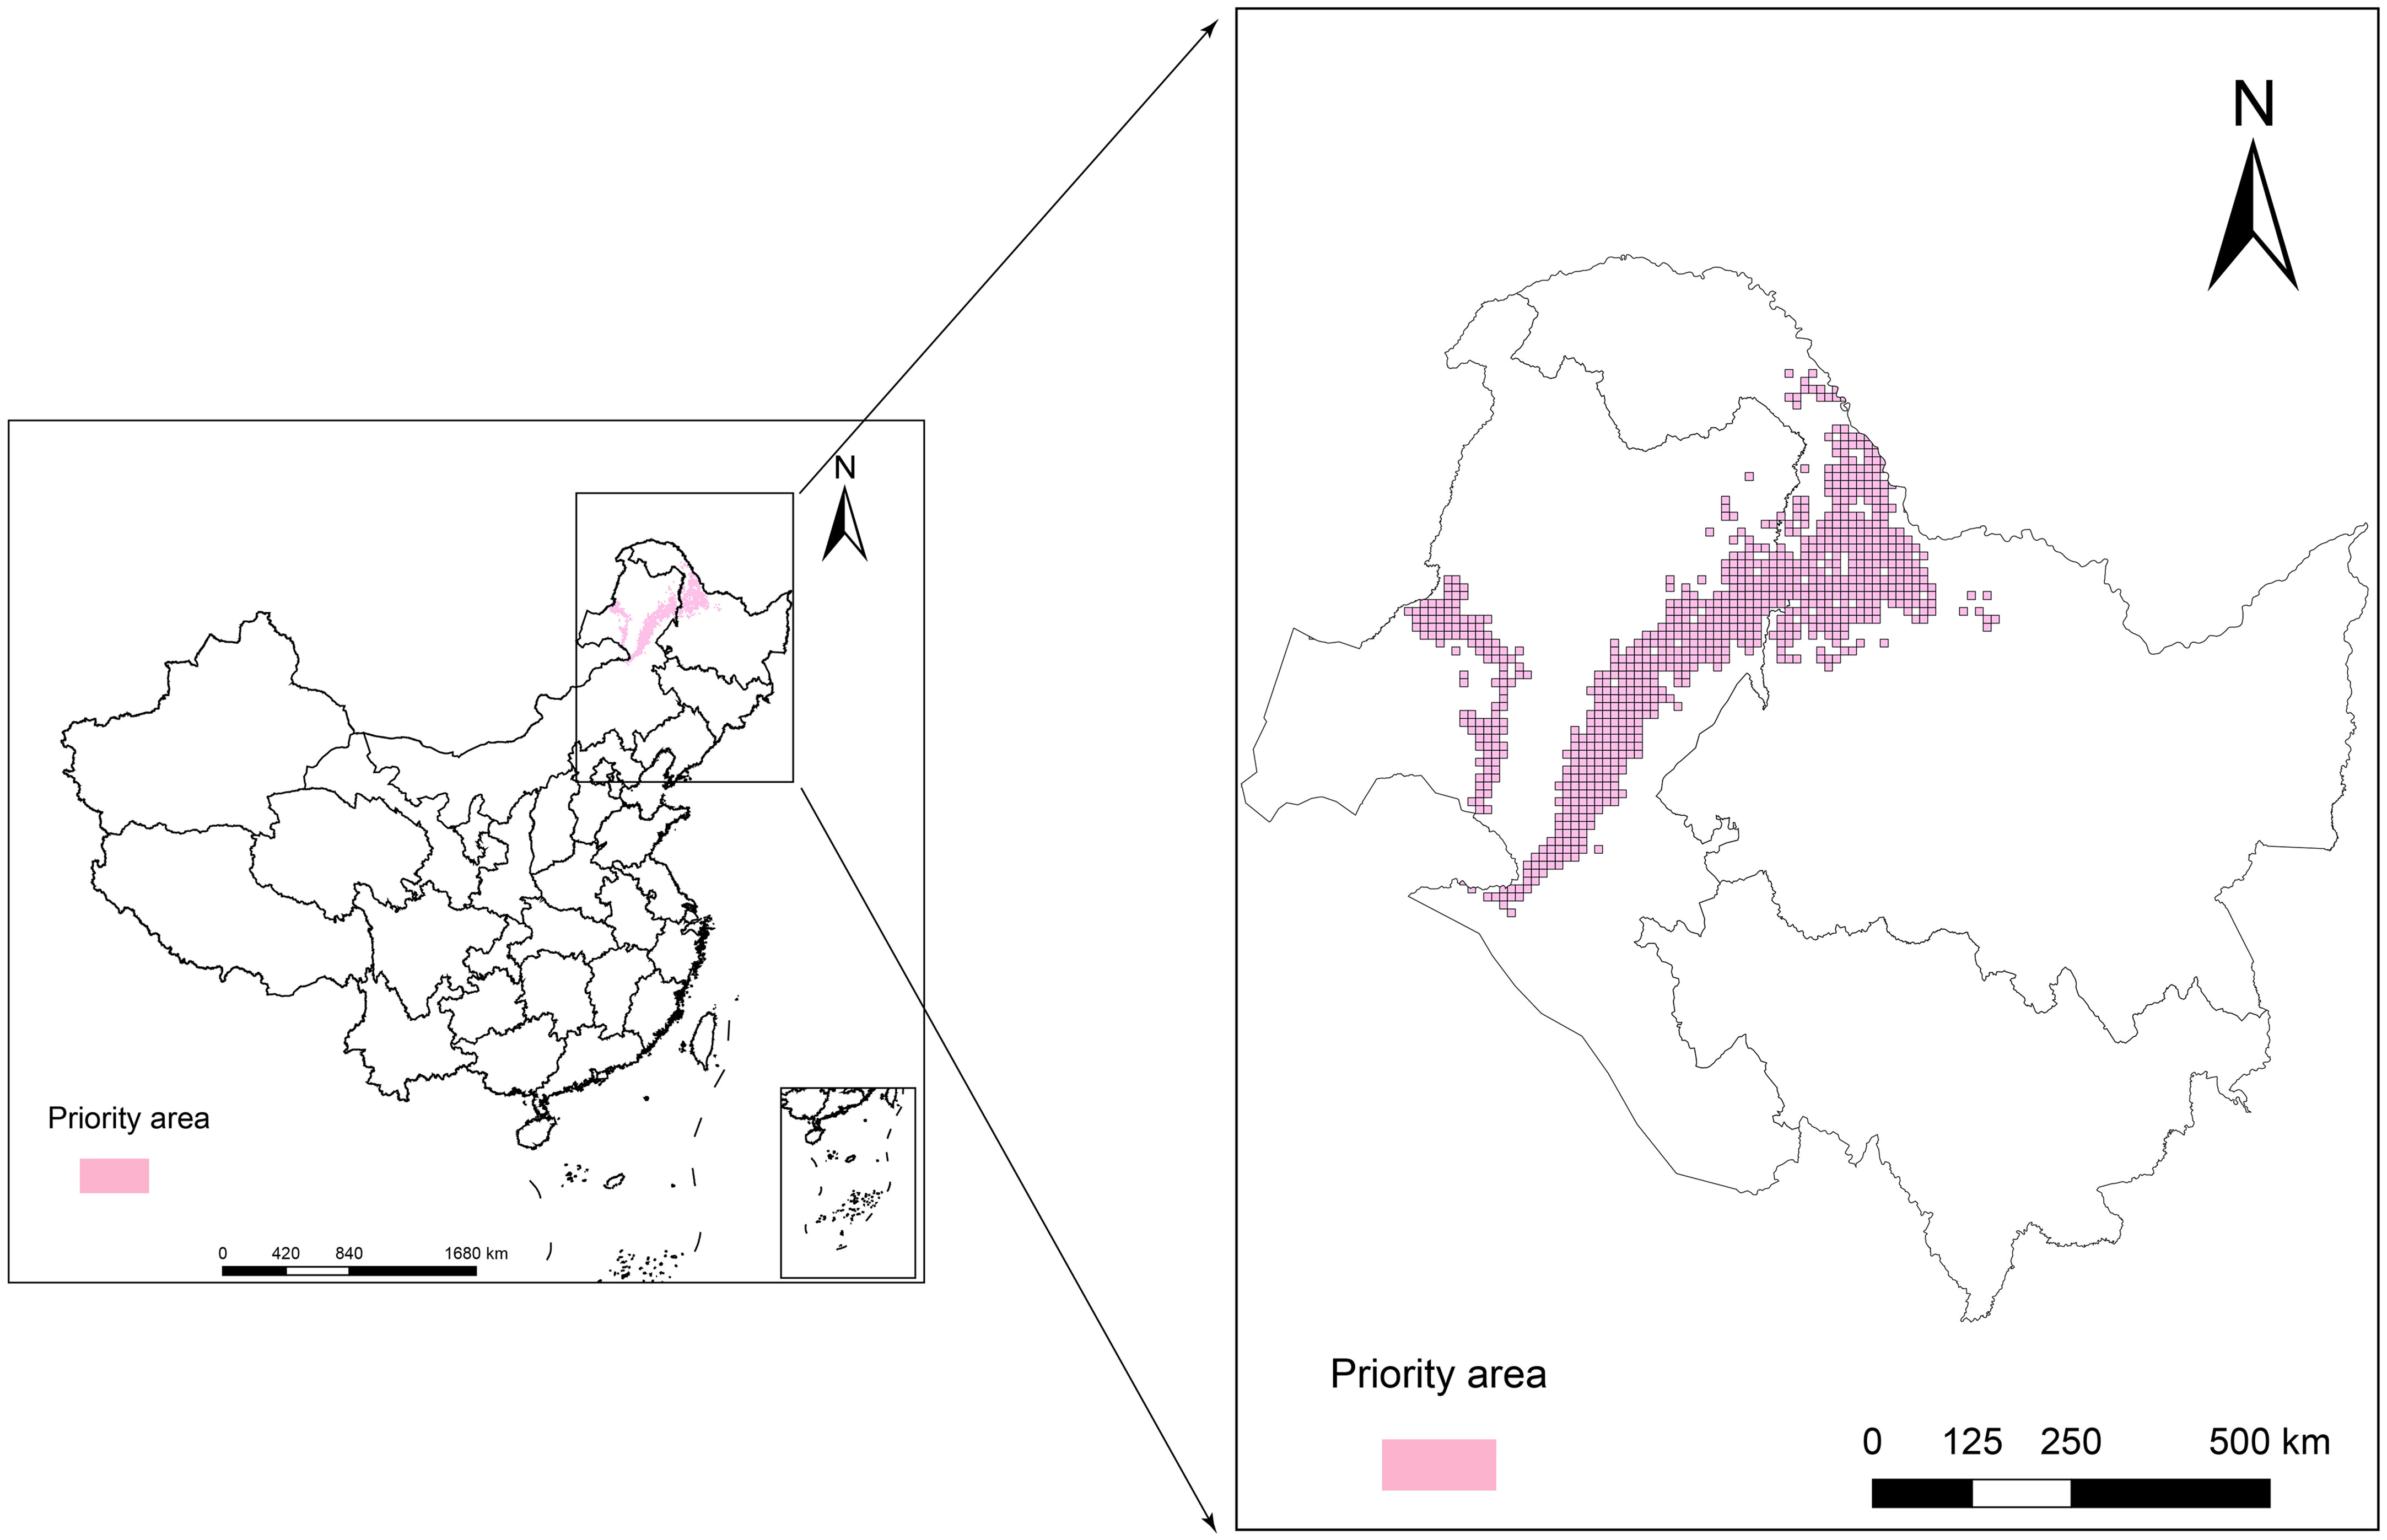
Figure 7 The current priority conservation areas of L. gmelinii in China.
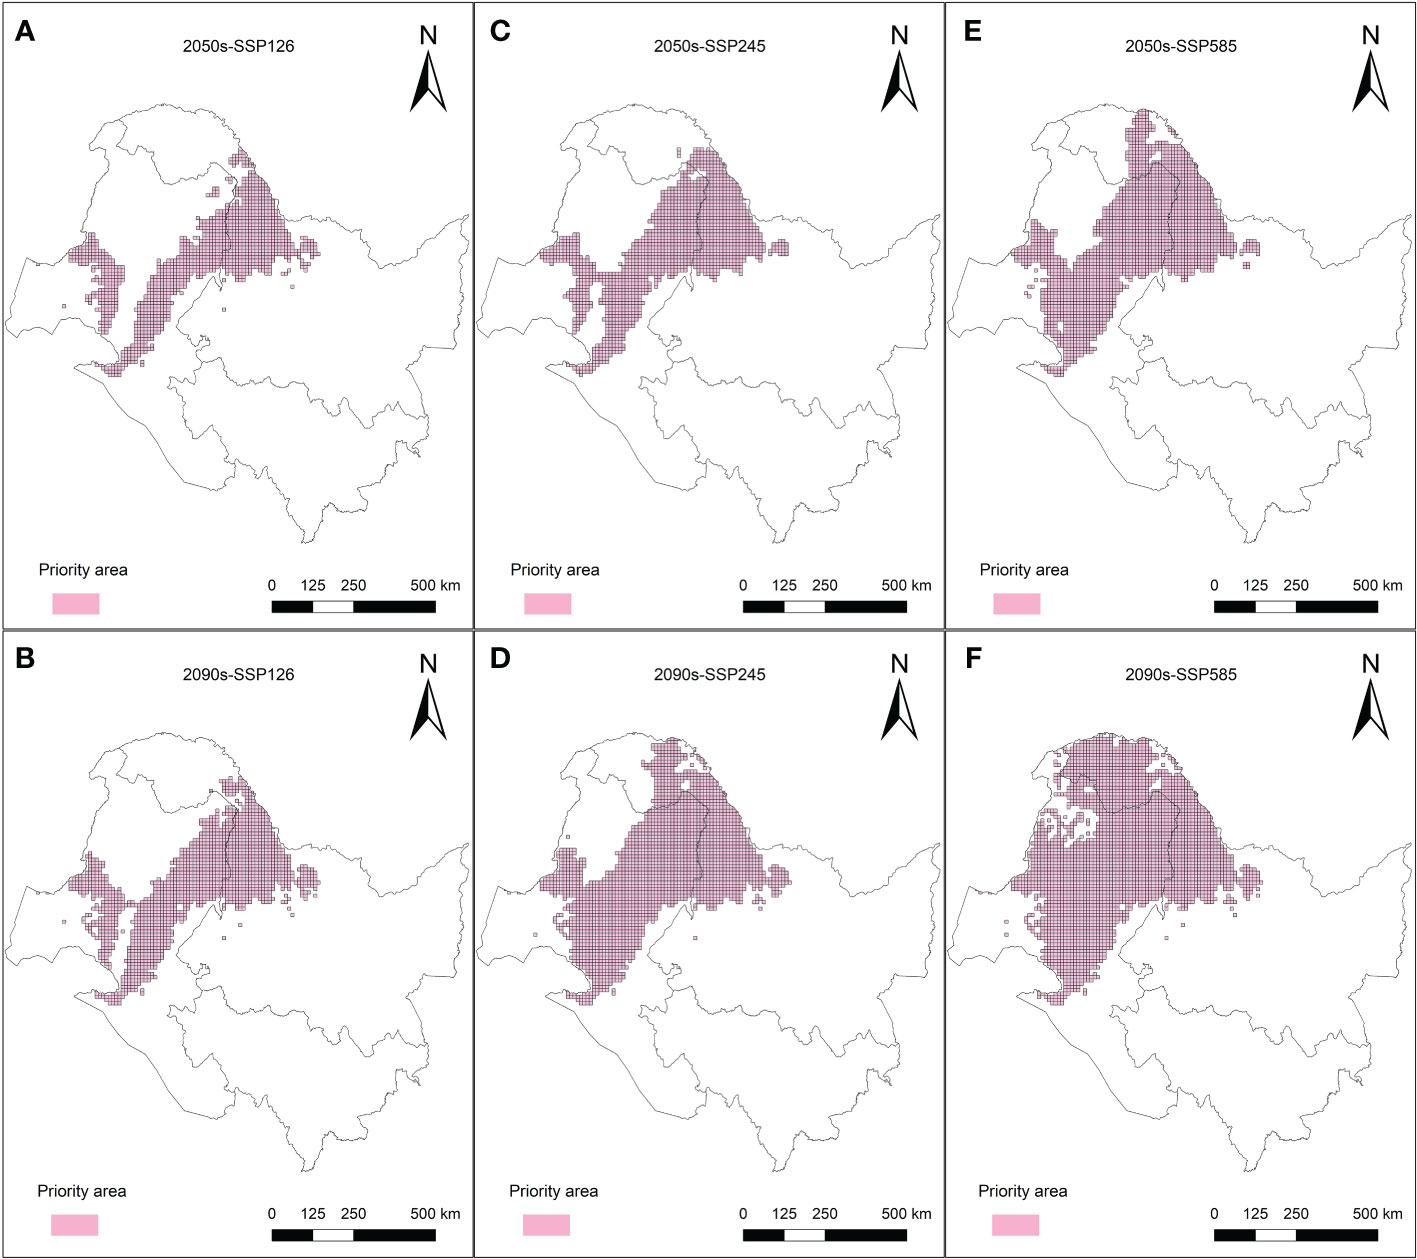
Figure 8 Priority conservation areas of L. gmelinii under the SSP126 (A, B), SSP245 (C, D) and SSP585 (E, F) scenarios in the 2050s (A, C, E) and 2070s (B, D, F).
4 Discussion
With the increase in climate change challenges, the risk of L. gmelinii extinction in China will also increase. Currently, the potential distribution area of L. gmelinii is distributed in the Greater Khingan Mountains and the Xiaoxing’an Mountains. The prediction is consistent with the actual distribution of L. gmelinii in the temperate coniferous forests of the Greater Khingan Mountains (Fu et al., 1999). Under the climate change scenarios, the overall trend of L. gmelinii habitat suitability was consistent. All types of suitability migrate to higher latitudes with the intensification of climate change in the future. The rate of increase in the L. gmelinii suitable area was lower than the loss rate; the maximum increase rate was less than 1% of the currently suitable area. The increased area appeared only in a tiny area on the edge of the present suitable area. The areas lost were located mainly in the southeastern and southwestern parts of the present suitable areas. These areas were also the areas with the largest climatic anomalies in the results of the MESS and MoD analyses. Simultaneously, with the increase in the emission of greenhouse gases, the effect of climate change on L. gmelinii increased as the area of suitability change increased. Studies have shown that the continuous warming of the climate will cause temperate forest vegetation to migrate to higher latitudes. The present study’s findings agree with previous reports (Villén-Peréz et al., 2020).
The niche dynamics of L. gmelinii showed that the degree of niche overlap for all pairwise comparisons of current and future scenarios decreased with increasing climate change severity. The current study suggested that the annual average temperature and the mean temperatures of the coldest and warmest quarters were the main factors that caused the niche differentiation of L. gmelinii. Similarly, the radial growth of L. gmelinii was restricted primarily by temperature and was more closely related to precipitation. This result is consistent with weak growth characteristics (Zhang et al., 2018). The ecological niche of L. gmelinii in the SSP585-2090s climate model with the most severe climate change will be completely separated, and its original ecological niche may be occupied by other tree species moving northward. At this time, the ecosystem structure of the cold temperate coniferous forest with L. gmelinii as the dominant tree species will experience subversive changes, and its original biodiversity will be seriously threatened. This shift explains why the potential distribution area of L. gmelinii disappeared in a large area under the SSP585-2090s climate model and why the potential distribution of L. gmelinii continued to move northward in the future.
The productivity characteristics of L. gmelinii from the most suitable area were significantly better than those from the marginally unsuitable and marginally suitable areas. The most suitable area for L. gmelinii has a higher latitude, higher altitude and lower temperature than the marginally unsuitable and marginally suitable areas. In the Northern Hemisphere’s middle and high latitudes, the trees at the high latitude and low-temperature boundary of the tree species’ suitable area had a fast growth rate and strong adaptability, while the trees at the low latitude and high-temperature boundary of the tree species’ suitable area had a slow growth rate. (Davis and Shaw, 2001; Reich et al., 2015; Sendall et al., 2015). The growth characteristics of L. gmelinii from different types of suitable areas were consistent with this hypothesis. For group analysis, this study divided the L. gmelinii understory plant diversity into shrub species diversity and herbaceous species diversity. We found certain differences in the response of the diversity of shrub and herbaceous shrub species to changes in the habitat suitability of L. gmelinii. The diversity of understory shrub species in the sample plots in the marginally suitable area was significantly higher than that in the marginally unsuitable and most suitable areas, but the diversity of understory herb species in the marginally unsuitable area was slightly higher than that in the marginally suitable area. From regional to global scales, there have been related studies on plant species diversity showing significant differences due to changes in latitude and elevation, but there have still been certain differences in the conclusions drawn in these previous studies. Some studies have shown that species diversity decreases with increasing latitude and altitude (Koch, 2000), and other studies have shown that species diversity increases with increasing latitude and longitude, decreases with increasing altitude, or is higher at mid-latitudes and altitudes (Whittaker, 1960; Yang et al., 2004). The conclusions based on the analysis of L. gmelinii understory species diversity in this work differ from those of previous reports. The reason for this difference may be the difference in the microclimate of L. gmelinii forests with different habitat suitability values. Although the plant species composition of the understory has been studied, the mechanism of the influence of different stand structures of L. gmelinii natural forests on understory plant species diversity remains to be further studied (Zhang et al., 2017; Kumar et al., 2018).
Temperate coniferous forest is the most extensive forest ecosystem on Earth, accounting for approximately 14.5% of the land area and 30% of the forest area (Landsberg and Gower, 1997). China is located at the southernmost edge of the distribution of temperate coniferous forests in the world. The cold temperate coniferous forests are distributed only in the northern regions of the Greater Khingan Mountains in the northeast and the Altai Mountains in Xinjiang (Zhou, 1991). As the main tree species of the Greater Khingan Mountains’ temperate coniferous forest, the protection of L. gmelinii natural forests has been continuously strengthened, the protection system has been continuously improved, the construction of national forest parks and national wetland parks is gradually advancing, and protection efforts will increase progressively in the future (Zhang et al., 2000). However, there are still problems, such as protected areas that are too small and too scattered and fragmented in the Greater Khingan Mountains. Meanwhile, the area of spatial variation in the distribution of L. gmelinii is a climate change-sensitive area, which should be given attention in the conservation of L. gmelinii. Therefore, this study used Marxan software to assess and implement overall protection planning for L. gmelinii natural forests. Considering the objective situation that the residents in the Greater Khingan Mountains mainly rely on growing food crops and mining economic plants for their livelihoods, when setting the plant protection target in this study, 80% of the future loss of area in the potential distribution area was taken as the zoning target. While destroying the natural forest habitat of L. gmelinii, establishing protected areas should avoid serious impacts on the quality of life (QoL) and the economic development of local residents. Therefore, when setting the BLM parameters in this study, referring to the research conducted by Javed et al. (2019) and Tang et al. (2021), different BLM values and scales of planning units in the planning area will affect the final research conclusions. The BLM and planning unit areas were optimized according to the number and area of debris, and excessive encroachment on grassland and cropland in the L. gmelinii distribution area was avoided in the final zoning map.
5 Conclusions
Due to global warming, the potential distribution range of L. gmelinii will continue to decrease and move to higher latitudes, its climatic ecological niche will gradually move with it, and many areas outside the northern Greater Khingan Mountains area will become less suitable for L. gmelinii. A comparison of the characteristics of L. gmelinii stands revealed considerable differences in the productivity characteristics and understory plant diversity of L. gmelinii natural forests under different habitat suitability levels. Therefore, strengthening the conservation of cold-temperate coniferous forests in the Greater Khingan Mountains area with L. gmelinii as the main tree species and designating key protection areas based on the distribution range of highly suitable L. gmelinii habitats to reduce the damage to L. gmelinii forest resources by human activities are inevitable.
Data availability statement
The raw data supporting the conclusions of this article will be made available by the authors, without undue reservation.
Author contributions
Conceptualization, MG, GZ and RS. Methodology, GZ, XW and SZ. Data Analysis, MG, ZW and GZ. Writing – Original Draft, GZ, MG, LL and NT. Writing – Review & Editing, MG, GZ, SZ and RS. Supervision, RS and MG. Funding Acquisition, RS. All authors contributed to the article and approved the submitted version.
Funding
The study was supported by the Science and Technology Plan Project in the Inner Mongolia Autonomous Region (Grant number: 2020GG0067).
Acknowledgments
We are grateful to the reviewers for their valuable comments that helped improve the manuscript’s quality.
Conflict of interest
The authors declare that the research was conducted in the absence of any commercial or financial relationships that could be construed as a potential conflict of interest.
Publisher’s note
All claims expressed in this article are solely those of the authors and do not necessarily represent those of their affiliated organizations, or those of the publisher, the editors and the reviewers. Any product that may be evaluated in this article, or claim that may be made by its manufacturer, is not guaranteed or endorsed by the publisher.
Supplementary material
The Supplementary Material for this article can be found online at: https://www.frontiersin.org/articles/10.3389/fpls.2023.1177307/full#supplementary-material
References
Allouche, O., Tsoar, A., Kadmon, R. (2006). Assessing the accuracy of species distribution models: prevalence, kappa and the true skill statistic (TSS). J. Appl. Ecol. 43, 1223–1232. doi: 10.1111/j.1365-2664.2006.01214.x
Arabameri, A., Nalivan, O. A., Saha, S., Roy, J., Pradhan, B., Tiefenbacher, J. P., et al. (2020). Novel ensemble approaches of machine learning techniques in modeling the gully erosion susceptibility. Remote Sens. 12, 1890. doi: 10.3390/rs12111890
Araújo, M. B., New, M. (2007). Ensemble forecasting of species distributions. Trends Ecol. Evol. 22, 42–47. doi: 10.1016/j.tree.2006.09.010
Barchenkov, A. (2011). Morphological variability and quality of seeds of Larix gmelinii (Rupr.) rupr. Contemp. Probl. Ecol. 4, 327–333. doi: 10.1134/S1995425511030131
Bezeng, B. S., Morales-Castilla, I., van der Bank, M., Yessoufou, K., Daru, B. H., Davies, T. J. (2017). Climate change may reduce the spread of non-native species. Ecosphere 8, e01694. doi: 10.1002/ecs2.1694
Chamorro, D., Real, R., Muñoz, A. R. (2020). Fuzzy sets allow gaging the extent and rate of species range shift due to climate change. Sci. Rep. 10, 16272. doi: 10.1038/s41598-020-73509-y
Cui, G., Cai, T., Yang, W. (2000). Soil acidity of Larix gmelini plantation. J. Beijing For. Univ. 22, 33–36. doi: 10.3321/j.issn:1000-1522.2000.03.008
Davis, M. B., Shaw, R. G. (2001). Range shifts and adaptive responses to quaternary climate change. Science 292, 673–679. doi: 10.1126/science.292.5517.673
Di Cola, V., Broennimann, O., Petitpierre, B., Breiner, F. T., D'Amen, M., Randin, C., et al. (2017). Ecospat: an r package to support spatial analyses and modeling of species niches and distributions. Ecography 40, 774–787. doi: 10.1111/ecog.02671
Duque-Lazo, J., Navarro-Cerrillo, R. M., Van Gils, H., Groen, T. A. (2018). Forecasting oak decline caused by Phytophthora cinnamomi in Andalusia: identification of priority areas for intervention. For. Ecol. Manage. 417, 122–136. doi: 10.1016/j.foreco.2018.02.045
Duque-Lazo, J., Van Gils, H., Groen, T. A., Navarro-Cerrillo, R. M. (2016). Transferability of species distribution models: the case of Phytophthora cinnamomi in southwest Spain and southwest Australia. Ecol. Model. 320, 62–70. doi: 10.1016/j.ecolmodel.2015.09.019
Elith, J., Graham, C. H., Anderson, R. P., Dudík, M., Ferrier, S., Guisan, A., et al. (2006). Novel methods improve prediction of species’ distributions from occurrence data. Ecography 29, 129–151. doi: 10.1111/j.2006.0906-7590.04596.x
Elith, J., Leathwick, J. R. (2009). Species distribution models: ecological explanation and prediction across space and time. Annu. Rev. Ecol. Evol. Syst. 40, 677–697. doi: 10.1146/annurev.ecolsys.110308.120159
Fick, S. E., Hijmans, R. J. (2017). WorldClim 2: new 1-km spatial resolution climate surfaces for global land areas. Int. J. Climatol. 37, 4302–4315. doi: 10.1002/joc.5086
Fu, L., Li, N., Mill, R. (1999). “Taxaceae,” in Flora of China. Eds. Wu, Z., Raven, P. (Beijing, China and St-Louis, MO: Science Press and Missouri Botanical Garden Press), 89–96.
Grabner, M., Müller, U., Gierlinger, N., Wimmer, R. (2005). Effects of heartwood extractives on mechanical properties of larch. IAWA J. 26, 211–220. doi: 10.1163/22941932-90000113
Hao, T., Elith, J., Guillera-Arroita, G., Lahoz-Monfort, J. J. (2019). A review of evidence about use and performance of species distribution modelling ensembles like BIOMOD. Divers. Distrib. 25, 839–852. doi: 10.1111/ddi.12892
Hermoso, V., Januchowski-Hartley, S., Linke, S., Possingham, H. P. (2011). Reference vs. present-day condition: early planning decisions influence the achievement of conservation objectives. Aquat. Conserv. Mar. Freshw. Ecosyst. 21, 500–509. doi: 10.1002/aqc.1211
IPCC (2021). “Climate change 2021: the physical science basis,” in IPCC sixth assessment report: working group 1: the physical science basis (Geneva, Switzerland: IPCC).
Ito, K., Fukuoka, K., Nishigaki, N., Hara, K., Yoshimi, Y., Kuki, H., et al. (2020). Structural features conserved in subclass of type II arabinogalactan. Plant Biotechnol. 37, 459–463. doi: 10.5511/plantbiotechnology.20.0721a
Javed, S., ElalQamy, H., Khan, S. B., Ahmed, S., Al Dhaheri, S. S., Al Hammadi, A., et al. (2019). Using greater flamingo tracking and count data in delineating marine protected areas in the coastal zone of Abu Dhabi, united Arab Emirates: conservation planning in an economically important area. Glob. Ecol. Conserv. 17, e00557. doi: 10.1016/j.gecco.2019.e00557
Koch, F. (2000). Biogeography. 2nd Ed Vol. 76 (Sunderland, Massachusetts: Sinauer Associates, Inc. Publishers), 158–158, ISBN: ISBN 0-87893-073-6. Brown, J. H. & Lomolino, M. V. (1998)Zoosystematics Evol. doi: 10.1002/mmnz.20000760118
Kumar, P., Chen, H. Y. H., Thomas, S. C., Shahi, C. (2018). Linking resource availability and heterogeneity to understorey species diversity through succession in boreal forest of Canada. J. Ecol. 106, 1266–1276. doi: 10.1111/1365-2745.12861
Landsberg, J., Gower, S. (1997). Applications of physiological ecology to forest management (San Diego, CA: Academic Press).
Milovac, J., Ingwersen, J., Warrach-Sagi, K. (2018) Global top soil texture data compatible with the WRF model based on the harmonized world soil database (HWSD) at 30 arc-second hor. (Accessed September 15, 2022).
Moilanen, A., Wilson, K. A., Possingham, H. (2009). Spatial conservation prioritization: quantitative methods and computational tools (New York, NY: Oxford University Press).
Munro, K. G. (2006). Evaluating marxan as a terrestrial conservation planning tool (Vancouver (BC: University of British Columbia).
Pearson, R. G., Thuiller, W., Araújo, M. B., Martinez-Meyer, E., Brotons, L., McClean, C., et al. (2006). Model-based uncertainty in species range prediction. J. Biogeogr. 33, 1704–1711. doi: 10.1111/j.1365-2699.2006.01460.x
Reich, P. B., Sendall, K. M., Rice, K., Rich, R. L., Stefanski, A., Hobbie, S. E., et al. (2015). Geographic range predicts photosynthetic and growth response to warming in co-occurring tree species. Nat. Clim. Change 5, 148–152. doi: 10.1038/nclimate2497
Sano, M., Furuta, F., Sweda, T. (2009). Tree-ring-width chronology of Larix gmelinii as an indicator of changes in early summer temperature in east-central kamchatka. J. For. Res. 14, 147–154. doi: 10.1007/s10310-009-0123-y
Sendall, K. M., Reich, P. B., Zhao, C., Jihua, H., Wei, X., Stefanski, A., et al. (2015). Acclimation of photosynthetic temperature optima of temperate and boreal tree species in response to experimental forest warming. Glob. Change Biol. 21, 1342–1357. doi: 10.1111/gcb.12781
Shabani, F., Kumar, L., Ahmadi, M. (2016). A comparison of absolute performance of different correlative and mechanistic species distribution models in an independent area. Ecol. Evol. 6, 5973–5986. doi: 10.1002/ece3.2332
Shingleton, A. W., Frankino, W. A. (2018). The (ongoing) problem of relative growth. Curr. Opin. Insect Sci. 25, 9–19. doi: 10.1016/j.cois.2017.10.001
Sun, J., Jiao, W., Wang, Q., Wang, T., Yang, H., Jin, J., et al. (2021b). Potential habitat and productivity loss of Populus deltoides industrial forest plantations due to global warming. For. Ecol. Manage. 496, 119474. doi: 10.1016/j.foreco.2021.119474
Sun, C., Zuo, J., Shi, X., Liu, X., Liu, H. (2021a). Diverse inter-annual variations of winter Siberian high and link with Eurasian snow in observation and BCC-CSM2-MR coupled model simulation. Front. Earth Sci. 9. doi: 10.3389/feart.2021.761311
Tanaka, K. R., Torre, M. P., Saba, V. S., Stock, C. A., Chen, Y. (2020). An ensemble high-resolution projection of changes in the future habitat of American lobster and sea scallop in the northeast US continental shelf. Divers. Distrib. 26, 987–1001. doi: 10.1111/ddi.13069
Tang, J., Lu, H., Xue, Y., Li, J., Li, G., Mao, Y., et al. (2021). Data-driven planning adjustments of the functional zoning of houhe national nature reserve. Glob. Ecol. Conserv. 29, e01708. doi: 10.1016/j.gecco.2021.e01708
Thuiller, W., Lafourcade, B., Engler, R., Araújo, M. B. (2009). BIOMOD – a platform for ensemble forecasting of species distributions. Ecography 32, 369–373. doi: 10.1111/j.1600-0587.2008.05742.x
Trindade, W. C. F., Santos, M. H., Artoni, R. F. (2020). Climate change shifts the distribution of vegetation types in south Brazilian hotspots. Reg. Environ. Change 20, 90. doi: 10.1007/s10113-020-01686-7
Venter, O., Sanderson, E. W., Magrach, A., Allan, J. R., Beher, J., Jones, K. R., et al. (2016). Global terrestrial human footprint maps for 1993 and 2009. Sci. Data 3, 160067. doi: 10.1038/sdata.2016.67
Villén-Peréz, S., Heikkinen, J., Salemaa, M., Mäkipää, R. (2020). Global warming will affect the maximum potential abundance of boreal plant species. Ecography 43, 801–811. doi: 10.1111/ecog.04720
Wen, X., Zhao, G., Cheng, X., Chang, G., Dong, X., Lin, X. (2022). Prediction of the potential distribution pattern of the great gerbil (Rhombomys opimus) under climate change based on ensemble modelling. Pest Manage. Sci. 78, 3128–3134. doi: 10.1002/ps.6939
Whittaker, R. H. (1960). Vegetation of the siskiyou mountains, Oregon and California. Ecol. Monogr. 30, 279–338. doi: 10.2307/1943563
Wiens, J. A., Stralberg, D., Jongsomjit, D., Howell, C. A., Snyder, M. A. (2009). Niches, models, and climate change: assessing the assumptions and uncertainties. Proc. Natl. Acad. Sci. 106, 19729–19736. doi: 10.1073/pnas.0901639106
Yang, X. Q., Kushwaha, S. P. S., Saran, S., Xu, J., Roy, P. S. (2013). Maxent modeling for predicting the potential distribution of medicinal plant, Justicia adhatoda L. in lesser Himalayan foothills. Ecol. Eng. 51, 83–87. doi: 10.1016/j.ecoleng.2012.12.004
Yang, Y. H., Rao, S., Hu, H. F., Chen, A. P., Ji, C. J., Zhu, B., et al. (2004). Plant species richness of alpine grasslands in relation to environmental factors and biomass on the Tibetan plateau. Biodivers. Sci. 12, 200–205. doi: 10.17520/biods.2004024
Zhang, Y., Chen, H. Y. H., Taylor, A. R. (2017). Positive species diversity and above-ground biomass relationships are ubiquitous across forest strata despite interference from overstorey trees. Funct. Ecol. 31, 419–426. doi: 10.1111/1365-2435.12699
Zhang, X., Liu, X., Zhang, Q., Zeng, X., Xu, G., Wu, G., et al. (2018). Species-specific tree growth and intrinsic water-use efficiency of dahurian larch (Larix gmelinii) and Mongolian pine (Pinus sylvestris var. mongolica) growing in a boreal permafrost region of the greater hinggan mountains, northeastern China. Agric. For. Meteorol. 248, 145–155. doi: 10.1016/j.agrformet.2017.09.013
Zhang, P., Shao, G., Zhao, G., Le Master, D. C., Parker, G. R., Dunning, J. B., et al. (2000). China's forest policy for the 21st century. Science 288, 2135–2136. doi: 10.1126/science.288.5474.2135
Zhao, G., Cui, X. Y., Sun, J. J., Li, T. T., Wang, Q., Ye, X. Z., et al. (2021). Analysis of the distribution pattern of Chinese Ziziphus jujuba under climate change based on optimized biomod2 and MaxEnt models. Ecol. Indic. 132 (12), 108256. doi: 10.1016/j.ecolind.2021.108256
Keywords: Larix gmelinii, biomod2, Marxan, climate change, potential distribution, conservation planning, niche changes
Citation: Gao M, Zhao G, Zhang S, Wang Z, Wen X, Liu L, Zhang C, Tie N and Sa R (2023) Priority conservation area of Larix gmelinii under climate change: application of an ensemble modeling. Front. Plant Sci. 14:1177307. doi: 10.3389/fpls.2023.1177307
Received: 01 March 2023; Accepted: 10 April 2023;
Published: 09 May 2023.
Edited by:
Rui Bento Elias, University of the Azores, PortugalReviewed by:
Emad A. Farahat, Helwan University, EgyptJunfeng Tang, China West Normal University, China
Copyright © 2023 Gao, Zhao, Zhang, Wang, Wen, Liu, Zhang, Tie and Sa. This is an open-access article distributed under the terms of the Creative Commons Attribution License (CC BY). The use, distribution or reproduction in other forums is permitted, provided the original author(s) and the copyright owner(s) are credited and that the original publication in this journal is cited, in accordance with accepted academic practice. No use, distribution or reproduction is permitted which does not comply with these terms.
*Correspondence: Rula Sa, sarula213@163.com
†These authors share first authorship