Transcriptomic Analysis Reveals the Mechanism of Picea crassifolia Survival for Alpine Treeline Condition
by
 , and
, and
Zheng Shi
1, 
Xiuxiu Deng
1,
Dengzhong Bai
1,
Jingpin Lei
2,
Maihe Li
3,
Lixiong Zeng
1 and
Wenfa Xiao
1,* 1
Key Laboratory of Forest Ecology and Environment of National Forestry and Grassland Administration, Research Institute of Forest Ecology, Environment and Protection, Chinese Academy of Forestry, Beijing 100091, China
2
Research Institute of Forestry, Chinese Academy of Forestry, Beijing 100091, China
3
Forest dynamics, Swiss Federal Research Institute WSL, Zuercherstrasse 111, 8903 Birmensdorf, Switzerland
*
Author to whom correspondence should be addressed.
Forests 2020, 11(2), 156; https://doi.org/10.3390/f11020156
Submission received: 13 January 2020
/
Accepted: 23 January 2020
/
Published: 30 January 2020
(This article belongs to the Section Forest Ecophysiology and Biology)
Abstract
:The physiological mechanisms driving treeline formation succession captured the attention of ecologists many years ago, yet they are still not fully understood. In this study, physiological parameters (soluble sugars, starch, and nitrogen) were investigated in combination with transcriptomic analysis in the treeline tree species Picea crassifolia. The study was conducted in the middle of Qilian Mountain Reserves, Gansu Province, China, within the elevation range of 2500–3300 m. The results showed that the concentrations of non-structural carbohydrates decreased with increasing elevation in the current-year needles and current-year branches, as well as in the coarse and fine roots. RNA-Seq demonstrated that 483 genes were upregulated and 681 were downregulated in the comparison of 2900 and 2500 m (2900 vs. 2500), 770 were upregulated and 1006 were downregulated in 3300 vs. 2500, and 282 were upregulated and 295 were downregulated in 3300 vs. 2900. Gene Ontology (GO) and Kyoto Encyclopedia of Genes and Genomes (KEGG) analysis revealed that the differentially expressed genes were highly enriched in photosynthesis-related processes, carbon fixation and metabolism, and nitrogen metabolism. Furthermore, almost all photosynthesis-related genes were downregulated, whereas many genes involved in cuticle lipids and flavonoid biosynthesis were upregulated, contributing to the survival of P. crassifolia under the treeline condition. Thus, our study provided not only molecular evidence for carbon limitation hypothesis in treeline formation, but also a better understanding of the molecular mechanisms of treeline tree survival under adverse conditions.
1. Introduction
The treeline, defined here as the highest altitude where groups of upright trees reach at least 3 m of height, is one of the most recognizable bioclimatic boundaries and it has been suggested as a critical indicator of trees’ response to climate warming [1,2]. As one of the important ecological boundaries, the alpine treeline is globally determined by the soil temperature of 6.5 ± 0.8 °C at 10 cm of depth during the vegetation season [3]. Although the decrease in temperature with increasing elevations has been recognized as a major reason for treeline formation, and the mechanism by which low temperature affects the growth of treeline trees is unclear. The concordance of this treeline isotherm suggests a common low-temperature effect on plant metabolism, either related to carbon (C) gain (source activity; photosynthesis) or sink activity (tissues formation; meristems) [4].
The physiological mechanisms driving treeline formation captured the attention of ecologists long ago, and various environmental and biophysiological hypotheses have been formulated [5,6], yet they are not fully understood. The environmental hypothesis stated that the formation of treeline was due to the following factors: climatic stress, mechanical damage, short growing season, and temperature-limited reproduction [7,8,9,10]. This hypothesis can only be used to interpret local treeline phenomena, which are related to various local site conditions [11]. However, the biophysiological hypothesis focuses on growth limitation and C supply limitation [1,2,12]. The growth limitation hypothesis (GLH) considers that colder temperatures at higher elevations limit C sink activity [5], supported by the results of trees in 13 alpine tree line regions [13] and Larix potaninii in the eastern Himalayas treeline [14]. This is contrary to the C limitation hypothesis (CLH), which states that reduced C gain with higher elevation (lower temperature) results in treeline formation [5], which is further supported by the finding that the elevational decrease in non-structural carbohydrate (NSC) concentrations in Nothofagus pumilio trees at treeline elevation [15]. However, in the birch (Betula ermanii) near the treeline on the Changbai Mountain, Northeast China, the decrease in NSCs with elevation in main storage organs supports the CLH, whereas the increasing or static trends in new developing organs support the GLH [16]. Moreover, limitation of nutrients, including P and N, is also found to contribute to the formation of the Arctic treeline, particularly in areas with cold winters [17]. So far, there is no conclusive evidence about the formation of altitudinal treelines [11,12,13,14,15,16,17,18]. Hence, these conflicting findings prompted us to further explore a new way to explain the physiological mechanism that drives high-altitude treeline formation.
Changes in temperature and water with the increasing altitudes have been shown to have significant effects on the physiological adaptations of alpine trees [6,19], which is a consequence of plant responses at the transcriptional level. Although physiological changes in trees of treelines have been reported [1,5,10,20,21], little information is available about the mechanisms regulating treeline formation at the transcriptomic level, compared with those other vegetation zones. In recent years, RNA sequencing (RNA-Seq) has enabled to detect differentially expressed genes (DEGs) because of its dynamic range of expression levels under abiotic stress, such as salinity [22] and drought [23]. In the present study, in order to verify the GLH or CLH at the molecular level, we conducted a transcriptome analysis of Picea crassifolia growing at different elevations, and combined it with the analysis of physiological changes in trees. Consequently, we examined the expression responses of candidate genes related to carbohydrate fixation and metabolism. In order to assess the adaptive potential of trees in the treeline environment, it is necessary to identify genes that are related to environmental responses of trees forming treelines.
2. Materials and Methods
2.1. Site Description
This study was carried out in the middle of the Qilian Mountain Reserves in the treeline ecotone of Pailugou Basin, Gansu Province (100°17’ E, 38°24’ N), with the elevation ranging from 2500 to 3400 m. The vegetation season in the treeline usually lasts from May to mid-October. The annual mean air temperature is around −0.6 °C to −2 °C, and the mean annual precipitation is 430 mm. The soil in the research site is mountain gray cinnamon soil, and the vegetation in the alpine treeline ecotone is dominated by P. crassifolia (ranging from 2500 to 3300 m), and treelike multi-stem shrubs such as Potentilla fruticosa, Caragana jubata, and Salix gilashanica (ranging from 2500 to 3400 m).
2.2. Sample Collection
Different tissues, including current-year needles, current-year branches, coarse roots, and fine roots, were collected during the early growing season (in June) at three elevations across the treeline ecotones on north-facing slopes: closed forest stands at lower elevations (2500 m), middle forest stands between closed forest and treeline (2900 m), and treeline stands in the uppermost limit of P. crassifolia trees (3300 m). Sampling was performed according to the method described by Li et al. [10] and Ma et al. [24] with some modifications. Briefly, nine healthy mature trees, consisting of three individuals each repeat, were selected for repeated sampling at each elevation. The current-year needles and current-year branches were collected from non-shaded leading branches on the upslope canopy side. Simultaneously, coarse roots (0.5–1.0 cm in diameter) and fine roots (<0.5 cm in diameter) were collected. One part of the current-year needle samples was immediately stored in liquid N for RNA extraction, whereas the other part, intended for physiological measurements, was immediately stored in a cool box. After short time treatment in a microwave oven (40 s at 600 W), the sample was dried at 70 °C until it reached a constant weight after two consecutive days.
2.3. Non-Structural Carbohydrate Analysis
Soluble sugars: Approximately 0.5 g of dry powdered sample was added into a triangular bottle along with 46 mL of distilled water. After boiling the sample for 2 h in a pressure cooker and cooling it, we set the capacity of sample solution to 50 mL, and filtered the solution. The filtrate was analyzed with the Waters 2695 High Performance Liquid Chromatograph (Waters-Millipore, Milford, MA, USA) using a Sugar-Pak I column. The liquid phase was distilled water, flow rate was 0.6 mL·min−1, column temperature was 70 °C; a parallax detector was used. All separated components were summed as soluble sugars [25,26].
Starch: Approximately 0.1 g of dry powdered sample was added into a plug tube with 10 mL of distilled water, and 1 mL of 2:1 hydrochloric acid, and incubated at 100 °C for 8 h. After cooling, the pH of the sample was adjusted to neutral with 40% NaOH, and the capacity of sample solution was set to 15 mL. After filtration, the filtrate was used for starch analysis. Starch content was analyzed using the same method as the determination of soluble sugars. The total concentration of NSC was defined as the sum of soluble sugar and starch concentrations [26,27].
Total N: Total N content (% d.m.) was determined in finely ground oven-dried samples with the Automatic Kjeldahl Analyzer (UK 152, Italy), using CuSO4, K2SO4, and H2SO4 for digestion, and NH3 was determined using the indophenol-blue colorimetric method according to Li et al. [10].
2.4. RNA-Seq Library Construction, Sequencing, and Mapping
Nine libraries for RNA-Seq, including three biological replicates for 2500, 2900, and 3300 m, were constructed according to the manuals provided by Illumina and sequenced on the HiSeq2000 platform as described by Zheng et al. [22]. Briefly, the total RNA was isolated from the current-year needles using the PLANT easy extraction protocol (BLKW, Beijing, China), and mRNAs were purified, fragmented, and used for complementary DNA (cDNA) synthesis with random hexamer primers and Superscript II reverse transcriptase (Invitrogen, Carlsbad, CA, USA). After the purification of the PCR products by AMPure XP system, (Beckman Coulter, Brea, CA, USA) and assessing the library quality on the Agilent Bioanalyzer 2100 system (Agilent, Palo Alto, CA, USA), paired-end cDNA libraries were sequenced using the Illumina-Solexa sequencing platform.
The poplar reference genome and annotation files were downloaded directly from the National Center for Biotechnology Information (NCBI) website (ftp://ftp.ncbi.nih.gov/genomes/PLANTS/Populus_trichocarpa/, accessed on 13 January 2020). An index of the reference genome was built using Bowtie v2.0.6, and single-end clean reads were aligned with the reference genome using TopHat v2.0.9 [28]. Read counts were calculated using HTSeq (www.huber.embl.de/users/anders/HTSeq, accessed on 13 January 2020) and normalized to the expected number of fragments per kilobase of transcript sequence per millions base pairs sequenced (FPKM) [29] in order to obtain the relative expression levels.
2.5. Identifying and Clustering of DEGs
The R packages of DESeq [30] were used for pairwise gene expression comparisons between two different elevations. The significance of DEGs was identified with a ‘p-value ≤ 0.05’ and ‘|log2Ratio| ≥ 1.0’ with at least one FPKM ≥ 1 within two elevations. Hierarchical clustering was performed using pheatmap package of R statistical environment in order to cluster the identified DEGs on the base of the FPKM values.
2.6. Quantitative Real-Time PCR (qRT-PCR)
cDNA was synthesized from 1.0 μg of total RNA and digested with DNase I using the PrimeScript RT reagent kit for RT-PCR (Takara, Dalian, China), according to the manufacturer’s instructions. The specific primers for poplar (Table S1) were synthesized by the Sangon Biotechnology Company (Shanghai, China). The qRT-PCR was performed using the SYBR Premix ExTaq II kit (Takara) on Roche LightCycler 480 (Roche, Penzberg, Germany). To quantify the relative expression levels of the target genes, the poplar reference gene Actin (GenBank accession no. AAF03692) was used as the internal control [33]. Fold changes were calculated by the relative expression of treatments compared with that of the control. Three independent biological replicates were performed for each selected gene (at least two technical repeats per biological replicate).
2.7. Statistical Analysis
Quantitative data of NSC concentration, N concentration, and transcription analysis were analyzed by one-way analysis of variance (ANOVA) according to the general linear model. Post-hoc comparison was performed by Tukey’s honestly significant difference (HSD) test. Differences were accepted as statistically significant when p < 0.05. All statistical analyses were performed using SPASS 16.0.
3. Results
3.1. Changes of NSC and Total N content with Altitudes
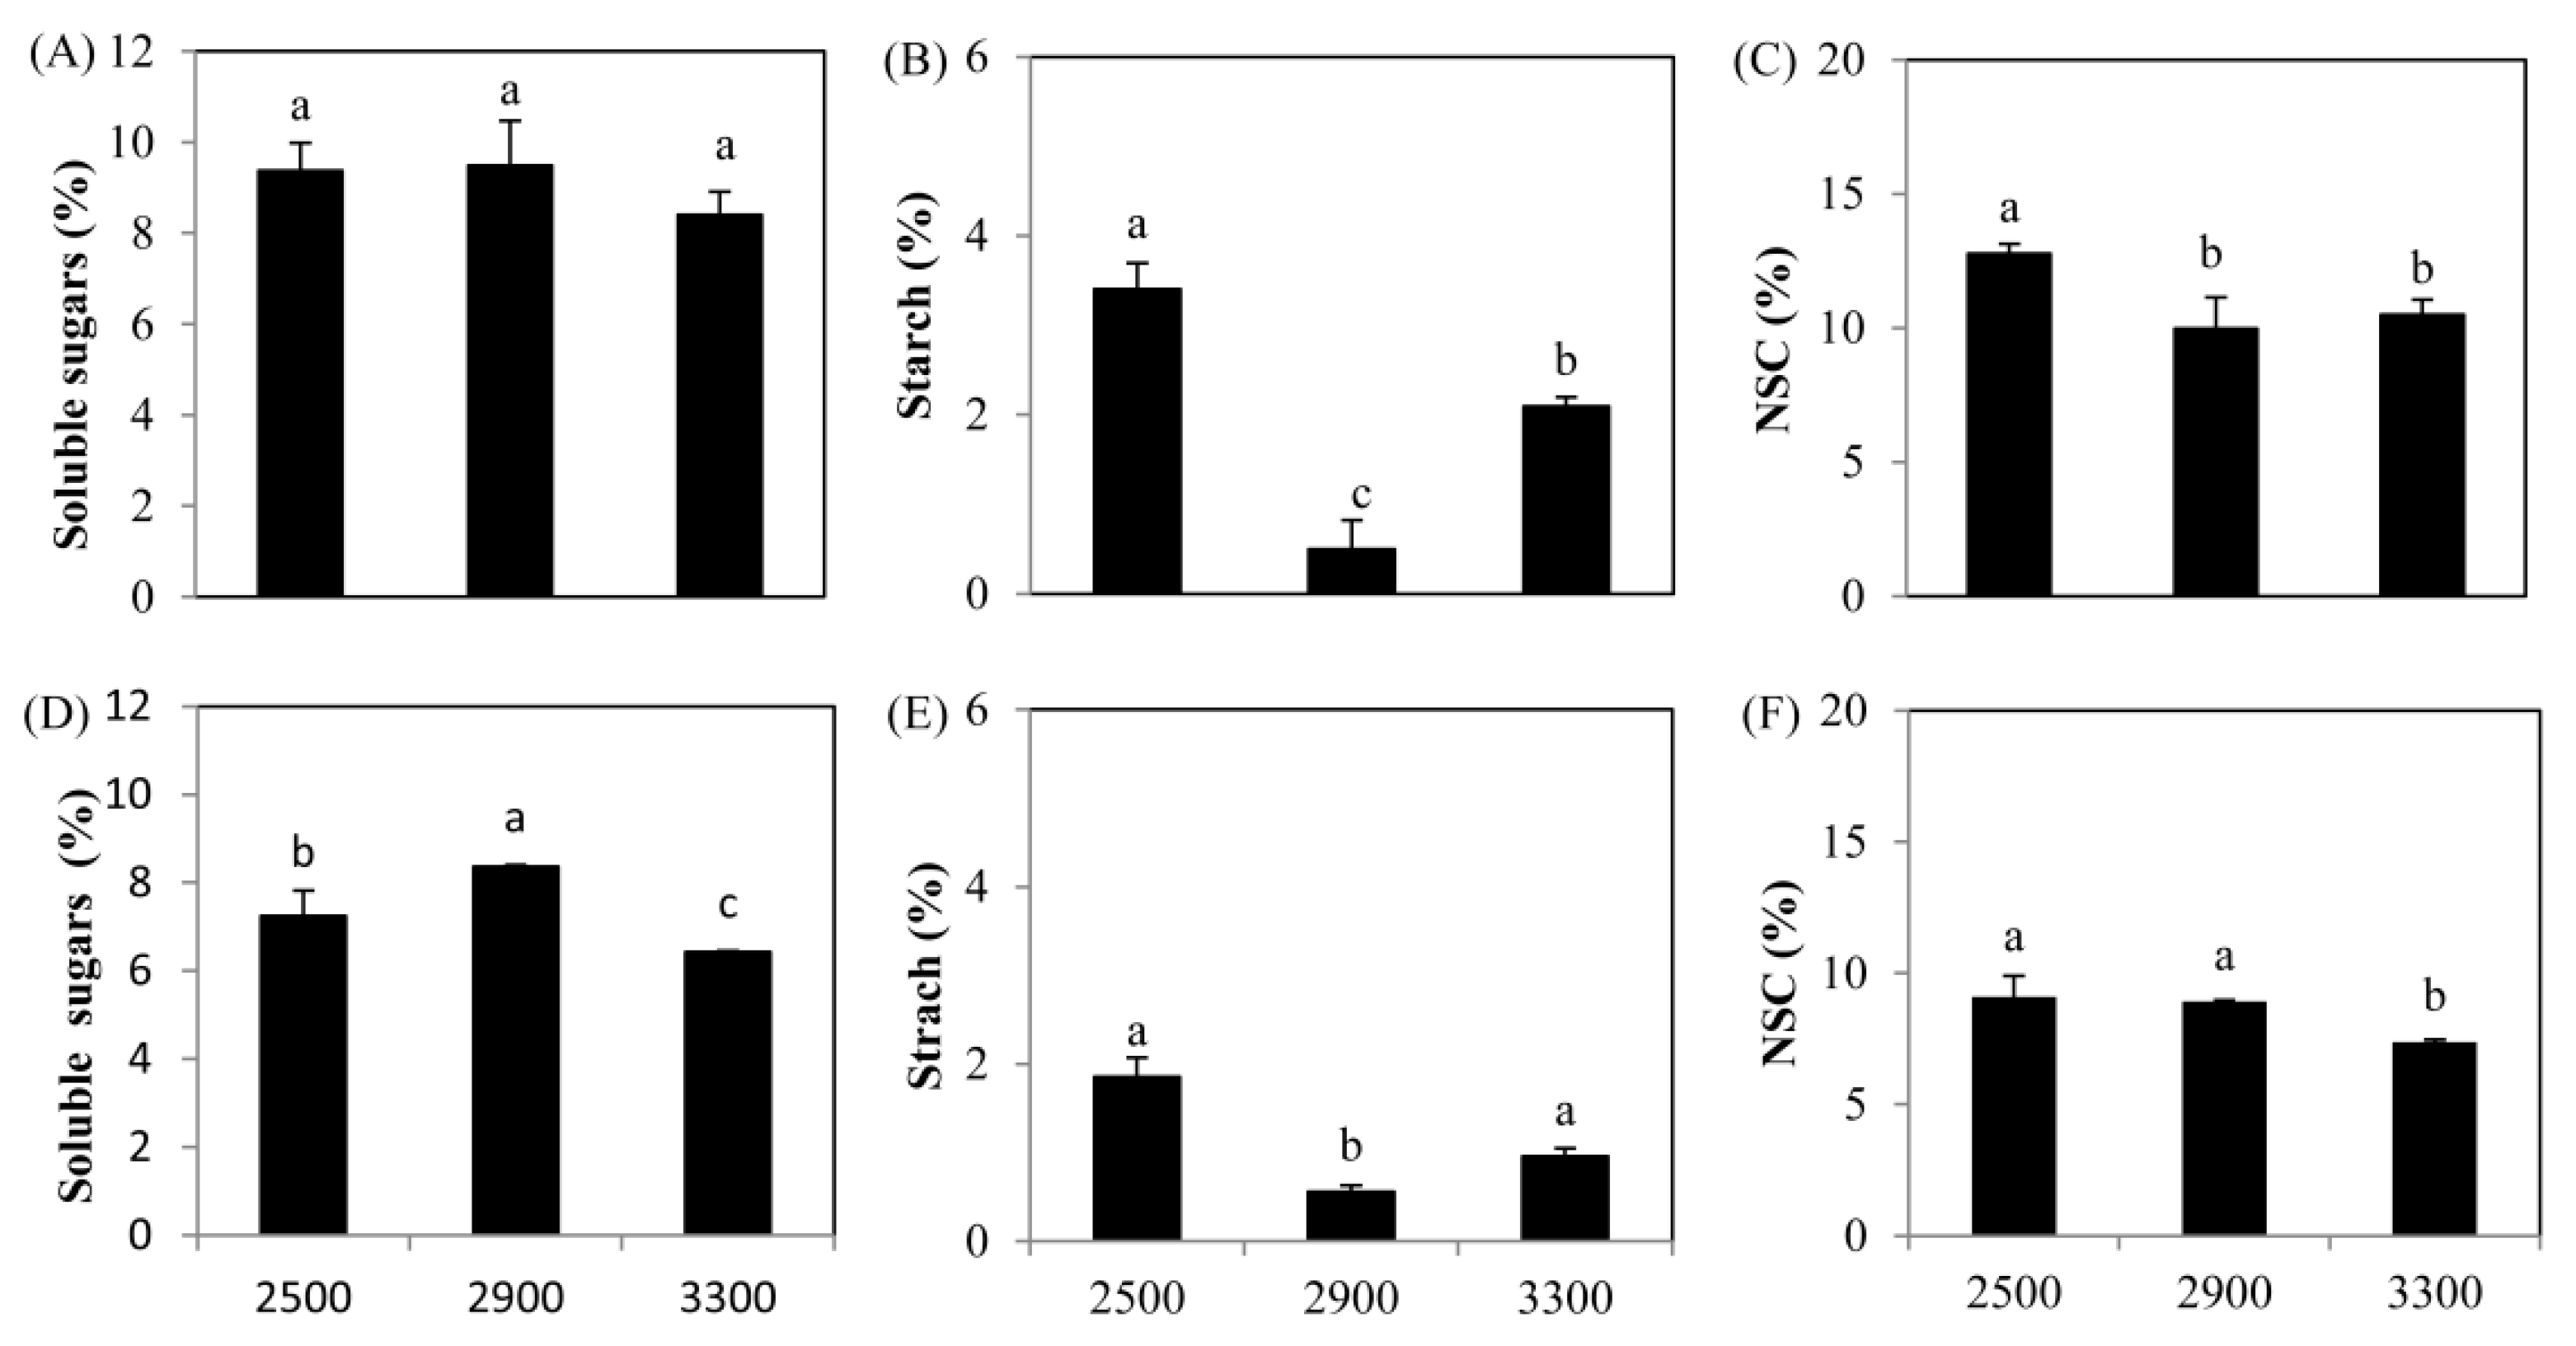
With increasing elevation, soluble sugar content in the current-year needles did not show an obvious change (p > 0.05), although there was a decreasing trend at 3300 m (Figure 1A). However, in the current-year branches, there was an apparent increase (15.5%) in the soluble sugar content at 2900 m, but a significant decrease (11.3%) was recorded at 3300 m (Figure 1D). The starch content showed a sharp decreasing trend (70.0%–85.4%) in both needles and branches at 2900 m (Figure 1B,E), but the starch content at 3300 m was significantly higher than that at 2900 m, indicating that the conversion of starch into soluble sugars could be inhibited at 3300 m. These changes resulted in a significant decrease over 17.9%–21.9% in total NSC in the current-year needles at 2900 and 3300 m, as well as in the current-year branches at 3300 m (18.9%) with the increasing elevation. These results suggested that the conditions at higher elevation limited the supply of C in the current-year needles and branches. Similarly, with increasing elevations, soluble carbohydrates were also negatively affected in both coarse roots and fine roots (Figure 2), which resulted in a decrease in the total NSC content, especially at 3300 m (Figure 2C,F).
The total N content increased evidently by 18.8%–38.5% at 2900 m compared with that at 2500 m in both needles and branches, whereas at 3300 m, the total N content showed a decrease, but it was still higher than that at 2500 m (Figure 3A,B). However, the total N content significantly decreased by 12.2%–15.2% in the coarse roots (Figure 3C), whereas it obviously increased by 11.3%-36.8% in the fine roots (Figure 3D). These results demonstrated that N was not a main limiting factor for the growth of P. crassifolia under the treeline condition.
3.2. Identification of Differentially Expressed Genes in P. crassifolia at Different Elevations by RNA-Seq
A summary of raw data is shown in Table S2, and the quantitative expression of genes (estimated using the RPKM values) is shown in Table S3. A high correlation of R2 > 0.91 between biological replicates was observed for three treatments at different elevations (Figure S1).
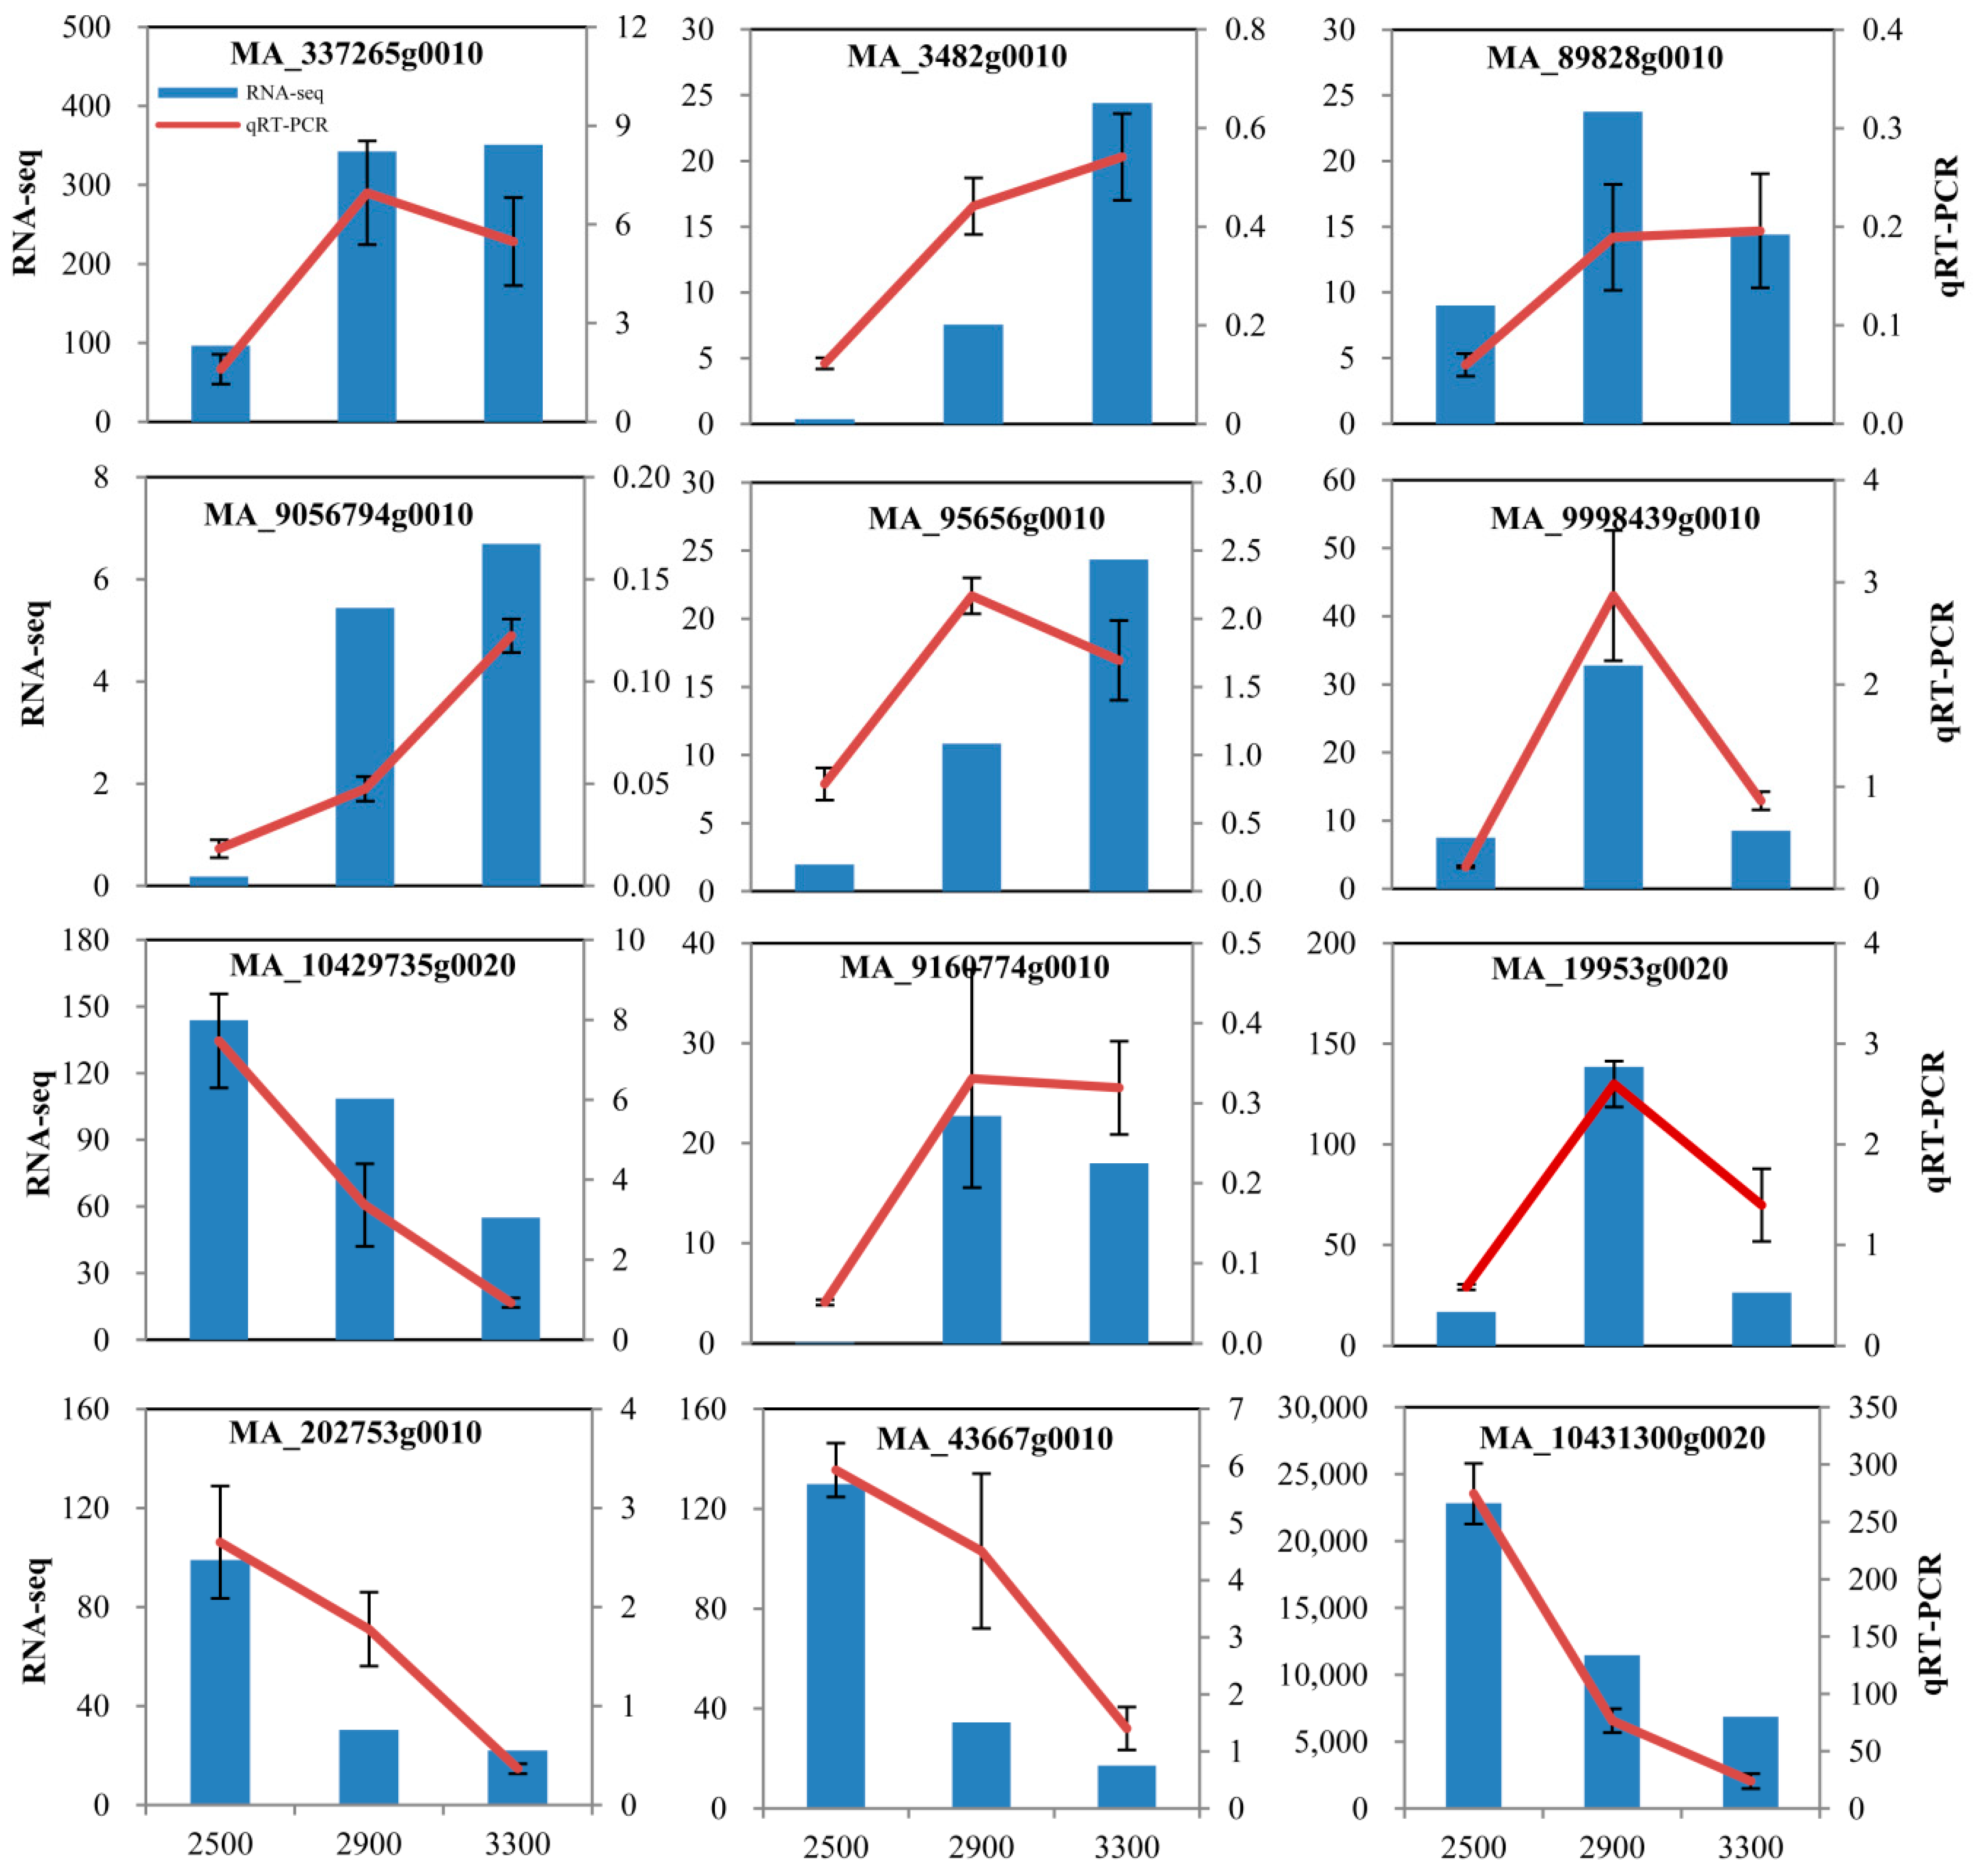
In order to determine the gene expression changes in P. crassifolia resulting from the variations in elevation, differentially expressed genes (DEGs) were identified in response to the increasing elevation (2500, 2900, and 3300 m). The |log2Ratio|≥ 1 was used as the threshold to screen the DEGs and to obtain more information on genes potentially involved in the response to the elevation variations. We found 483 upregulated genes and 681 downregulated genes by comparison of trees from 2900 m with trees from 2500 m (2900 vs. 2500), 770 upregulated genes and 1006 downregulated genes in 3300 vs. 2500, and 282 upregulated genes and 295 downregulated genes in 3300 vs. 2900 (Figure 4A; Table S4). Moreover, only 13 DEGs were common to 3 pairwise comparisons of different elevations, but 1146 DEGs were specific to the elevation of 3300 m (Figure 4B). Furthermore, gene expression patterns of 12 randomly selected DEGs were verified by qRT-PCR, which demonstrated similar expression trends with RNA-Seq results, indicating the reliability of DEG analysis (Figure 5). This indicated the presence of a large proportion of DEGs in P. crassifolia growing in the treeline environment, and these DEGs could aid the species to cope with the harsh environmental conditions.
These DEGs may be involved in different functions. The analysis of GO enrichment and KEGG pathway was applied to gain an insight into their functions. DEGs in 2900 vs. 2500, 3300 vs. 2500, and 3300 vs. 2900 were annotated in GO, and categorized into three major categories (biological process, cellular component, and molecular function) (Figure 6; Table S5). GO annotation suggested that biological processes and molecular functions, including “primary metabolism”, “organic substance metabolism”, “biological regulation”, “organic nitrogen compound biosynthesis”, “cellular nitrogen compound biosynthesis”, “cellular aromatic compound metabolism”, “carbohydrate metabolism”, and “lipid metabolism” were related to C and N metabolism at different elevations. In particular, biological processes of C and N metabolism were significantly enriched in 3300 vs. 2500.
In the KEGG pathway analysis, 83, 96, and 56 pathways were categorized into 14 major KEGG pathways from the pairwise comparisons between 2900 vs. 2500, 3300 vs. 2500, and 3300 vs. 2900, respectively. The pathways of metabolism, mainly including secondary metabolites, carbohydrates, energy, lipid, amino acids, cofactors, and vitamins, were mostly influenced by the variations in elevation, especially for 3300 vs. 2500, rather than being influenced by signal transduction, environmental adaptation, and transport (Figure 7; Table S6). The response of these pathways to increasing elevations could be helpful for the survival of P. crassifolia. Among these responses, the metabolism of carbohydrates and energy was enriched in 23 pathways (Table S6). Compared with those at 2500 m, 39 DEGs were upregulated and 40 were downregulated at 2900 m, whereas 74 were upregulated and 44 were downregulated at 3300 m. This indicated that most of the genes were negatively regulated around the elevation of the treeline compared with the lower elevations. We found that all 40 genes enriched in photosynthesis, antenna proteins of photosynthesis, and C fixation in photosynthetic organisms were downregulated at 3300 m. Similarly, DEGs involved in glyoxylate and dicarboxylate metabolism (14), pentose phosphate pathway (9), and fructose and mannose metabolism (9) were all downregulated at 3300 m. Moreover, 26 of the 30 DEGs in the C metabolism were also downregulated at 3300 m and 19 DEGs enriched in cutin, suberine, and wax biosynthesis were upregulated at 3300 m. These results demonstrated that the increasing elevations inhibited C fixation and altered the direction of C fluxes.
3.3. Analysis of Gene Expression Pattern
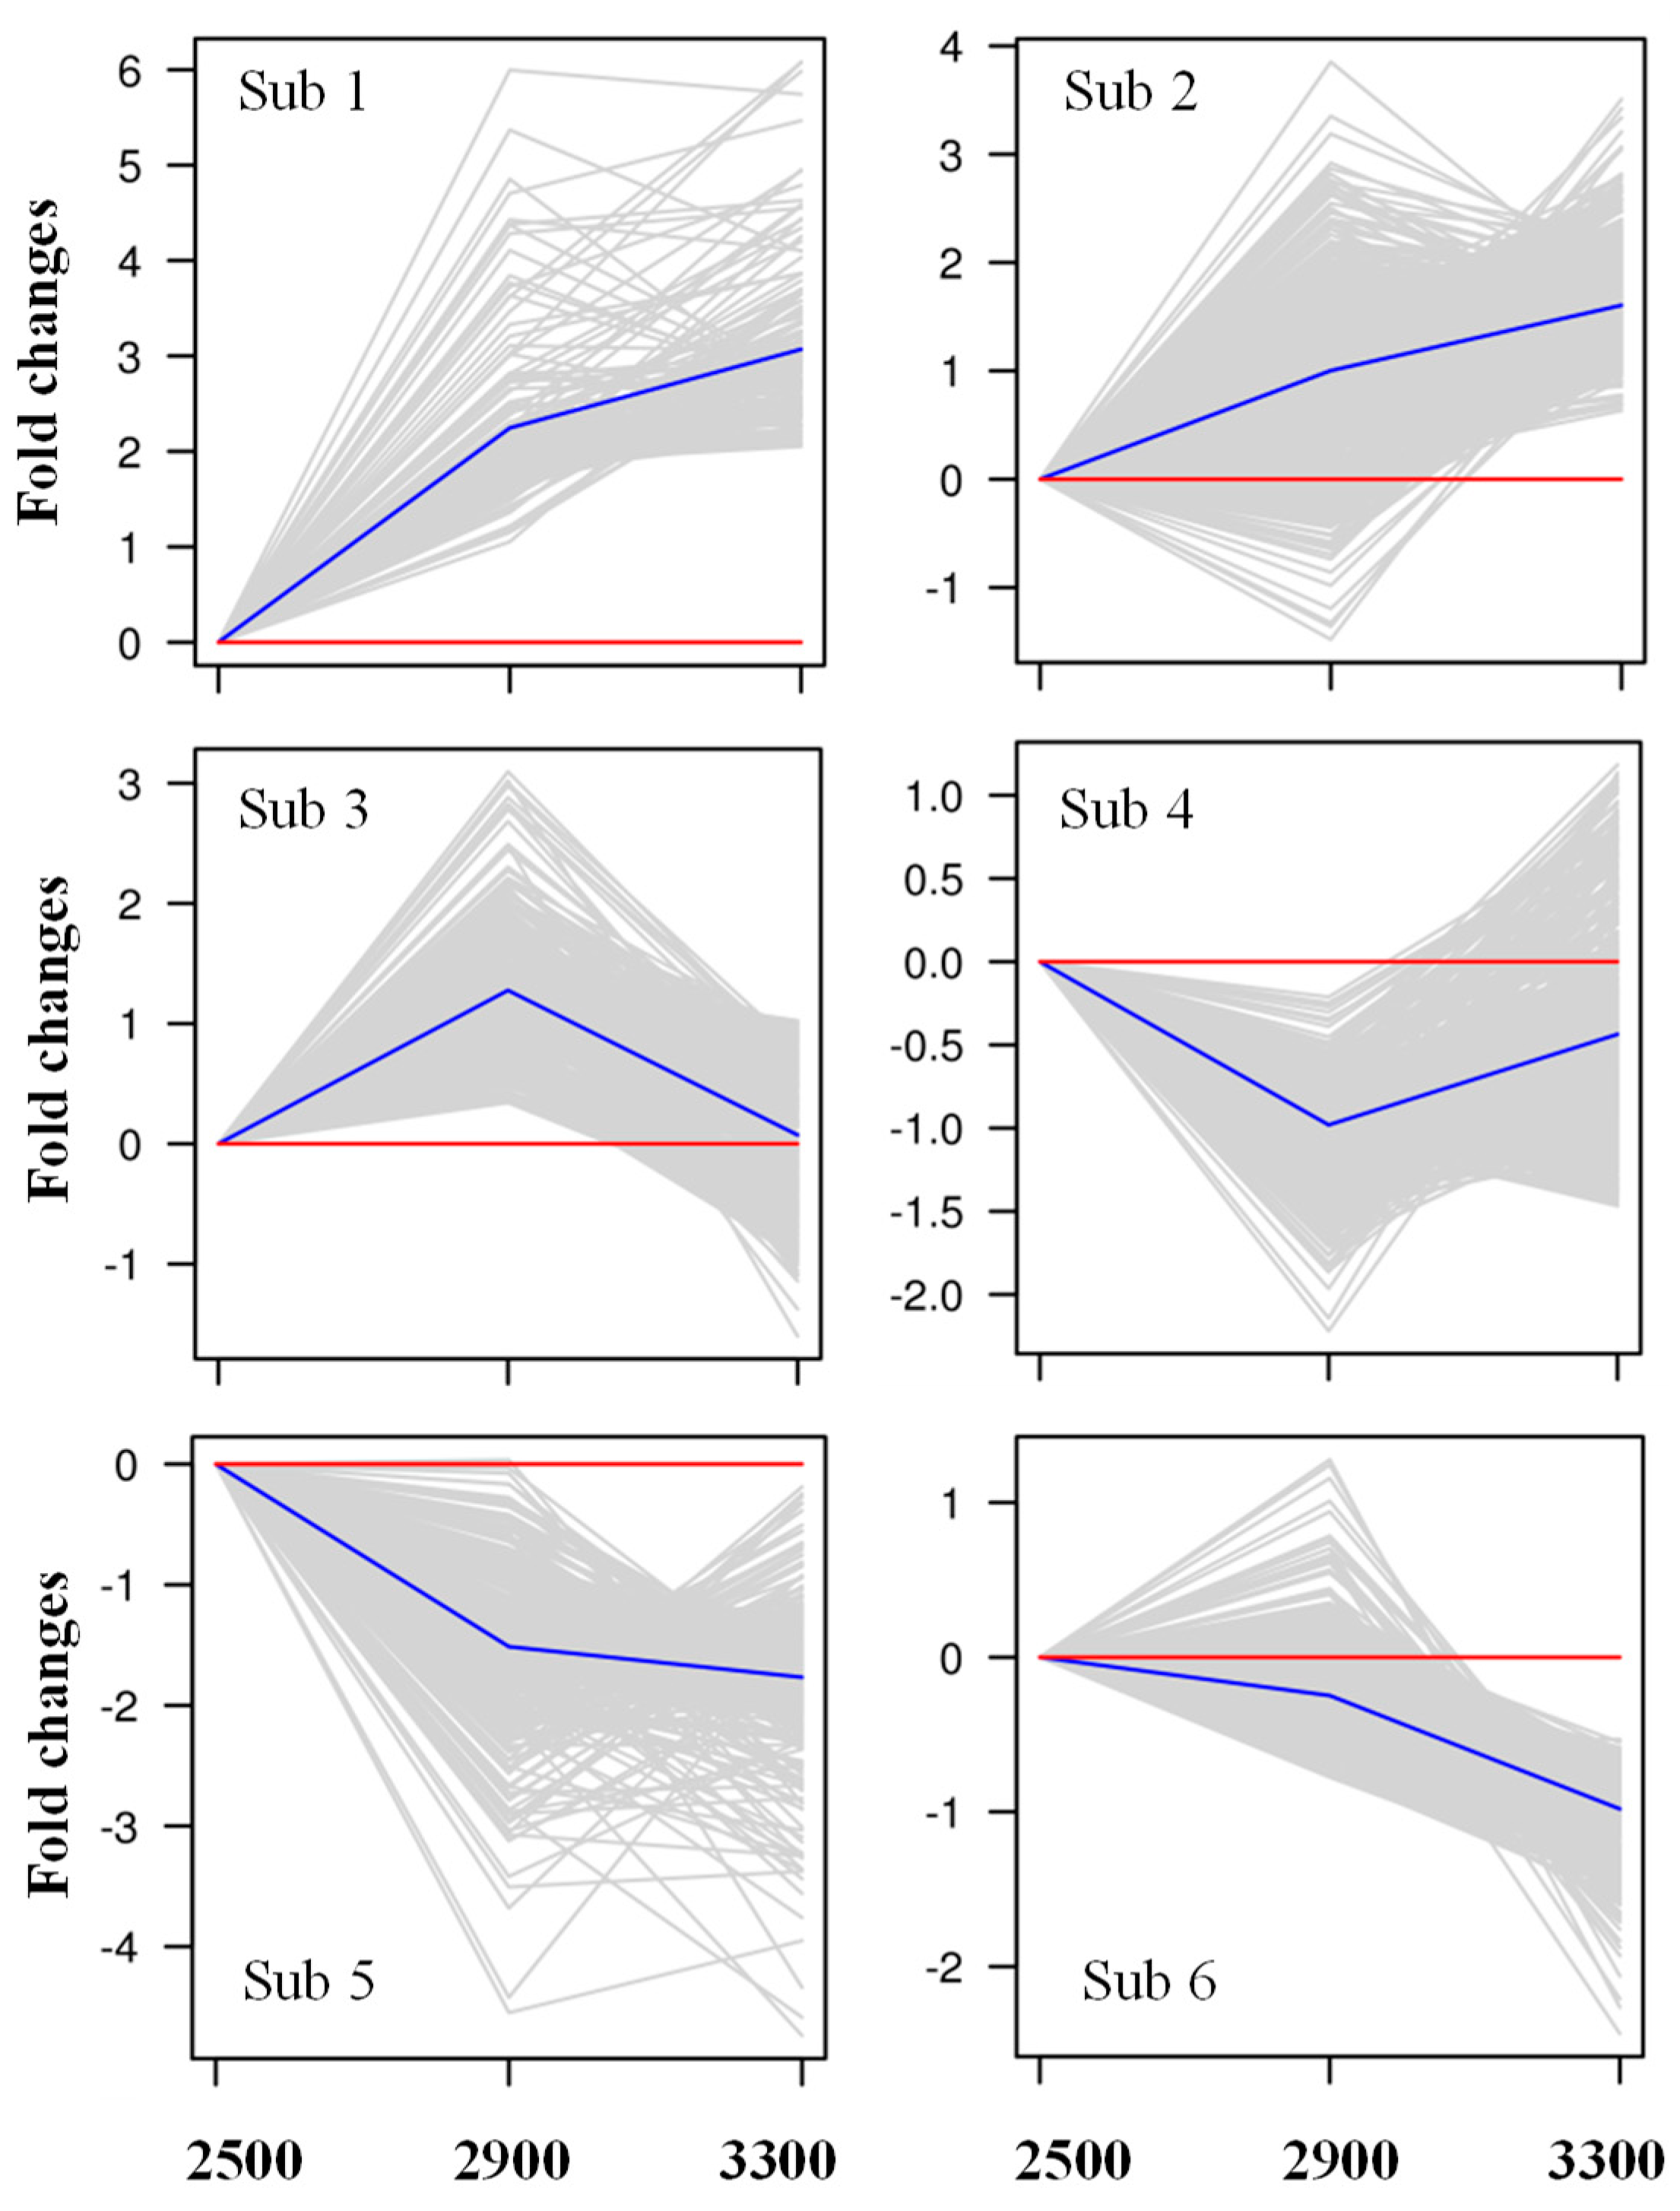
To further explore the gene expression patterns in response to the increasing altitudes, we applied K-means clustering to the identified DEGs. In this analysis, 1466 DEGs with a known-function were grouped into six categories (referred to as Sub1, Sub2, Sub3, Sub4, Sub5, and Sub6), comprising 113, 616, 165, 220, 194, and 158 genes, respectively (Figure 8; Table S7). The DEGs in the Sub1 and Sub2 groups were characterized by constant upregulation with the increasing elevations (Table S7). The GO and KEGG analysis showed that these genes were mainly enriched in secondary metabolite metabolism (such as biosynthesis of secondary metabolites; flavonoid biosynthesis; and stilbenoid, diarylheptanoid, and gingerol biosynthesis), carbohydrate metabolism (cutin, suberine, and wax biosynthesis; glycolysis/gluconeogenesis; and pyruvate metabolism), and lipid metabolism (fatty acid elongation, fatty acid biosynthesis, glycerophospholipid metabolism, and fatty acid degradation) (Tables S8 and S9). The expression of DEGs in Sub3 increased at 2900 m and decreased at 3300 m (Figure 8), and these DEGs were mainly enriched in signal transduction (such as plant hormone signal transduction), environmental adaptation (plant-pathogen interaction), amino acid metabolism (beta-alanine metabolism, tryptophan metabolism, and taurine and hypotaurine metabolism), and secondary metabolite metabolism (terpenoid backbone biosynthesis and carotenoid biosynthesis) (Tables S8 and S9). However, the DEGs in Sub4 were initially downregulated and then upregulated (Table S7), and they were mainly enriched in folding, sorting, and degradation (protein processing in the endoplasmic reticulum), secondary metabolite metabolism (stilbenoid, diarylheptanoid, and gingerol biosynthesis), and energy metabolism (carbon fixation in photosynthetic organisms) (Tables S8 and S9). The last two groups (Sub5 and Sub6) were continuously downregulated with increasing elevations, and they were mainly enriched in secondary metabolite metabolism (biosynthesis of secondary metabolites; phenylpropanoid bio synthesis; flavonoid biosynthesis; and stilbenoid, diarylheptanoid, and gingerol biosynthesis), carbohydrate metabolism (carbon metabolism, glyoxylate and dicarboxylate metabolism, pentose phosphate pathway, and fructose and mannose metabolism), energy metabolism (photosynthetic antenna proteins, photosynthesis, carbon fixation in photosynthetic organisms, and nitrogen metabolism), and amino acid metabolism (biosynthesis of amino acids, and phenylalanine, tryptophan, glycine, serine, and threonine metabolism) (Tables S8 and S9). This clustering demonstrated that the genes involved in photosynthetic C fixation, carbohydrate metabolism, and N metabolism were significantly influenced by elevation. Hence, we further explored the DEGs involved in C and N metabolism.
3.4. DEGs Involved in Carbon Assimilation and Energy Metabolism
In this study, 25 of the 33 DEGs involved in C assimilation and metabolism were downregulated with the increasing elevations (Table 1; Table S10A). Among these 25 DEGs, almost all photosynthesis-related genes were inhibited by higher altitudes (3300 m), whereas CLH2, a gene that encodes chlorophyllase-2 (which degrades chlorophyll), significantly increased with the increasing elevations. Correspondingly, the expression of eight in the nine LHCBs or LHCA (chlorophyll a-b binding proteins) was downregulated, which decreased the ability of capturing and delivering excitation energy to photosystems. Meanwhile, 12 of the 13 photosystem genes (photosystem I complex/PSI and photosystem II complex/PSII), excluding the 4.0‒5.7-fold increase in photosystem I reaction center subunit N (PSAN) (MA_3482g0010), were negatively regulated, although ribulose bisphosphate carboxylase small chain (RBCS) (MA_476g0010), which is responsible for the primary event in carbon dioxide fixation, was upregulated. This indicated that photosynthetic capacity might be significantly inhibited at the altitude of 3300 m. Subsequently, central C metabolism was also diversely affected by the increasing elevations. Half of the genes were downregulated, including one F16P (MA_10432295g0010) encoding fructose-1,6-bisphosphatase, one KPRS1 (MA_10431983g0010) encoding ribose-phosphate pyrophosphokinase 1, and two G3PCs encoding glyceraldehyde-3-phosphate dehydrogenase, whereas others were upregulated, including one SDHA (MA_10427069g0010) encoding succinate dehydrogenase (ubiquinone) flavoprotein subunit, and two GADs (MA_161013g0010, MA_89828g0010) encoding glutamate decarboxylase. These results suggested that the expression of genes involved in photosynthetic C assimilation and energy metabolism was significantly altered by the increasing elevations.
3.5. DEGs Involved in Non-Struct(ural Carbon Metabolism
In order to examine the effects of elevations on NSC metabolism, three KEGG pathways (soluble sugars, fatty acid metabolism, and flavonoid biosynthesis) were examined (Table 2; Table S10B). With the increasing elevation, seven DEGs involved in soluble sugar metabolism were identified, including AGLU (α-glucosidase ), GOLS1 (galactinol synthase 1), three GAOAs (galactose oxidase), and two RFSs (probable galactinol--sucrose galactosyltransferase). AGLU, as a gene responsible for the breakdown of starch and disaccharides into glucose, was upregulated by more than 2.3-fold. Similarly, the expression of two RFSs, which are involved in the synthesis of raffinose, was also significantly increased at a certain elevation. However, GOLS1, involved in the biosynthesis of raffinose family oligosaccharides (RFOs) that function as osmoprotectants, was downregulated; three GAOAs were also downregulated.
Interestingly, with the increasing elevation, we observed 60 DEGs involved in lipid metabolism, and 54 of them were upregulated, which might contribute to the survival in cold conditions at high altitudes. Moreover, flavonoids are important C-based secondary metabolites, which play a crucial role in the survival of trees under high altitude conditions. In this study, 29 genes involved in flavonoid biosynthetic pathway were identified as DEGs. Twelve of these genes were upregulated, including C4H (trans-cinnamate 4-monooxygenase), CAMT (caffeic acid 3-O-methyltransferase), CSE (caffeoylshikimate esterase), three DFRs (dihydroflavonol-4-reductase), F3′5′H (flavonoid 3′,5′-hydroxylase), two F3′Hs (flavonoid 3′-monooxygenase), UFGT (anthocyanidin 3-O-glucosyltransferase) and BAN (anthocyanidin reductase), and they triggered the biosynthesis of anthocyanidin or condensed tannins, contributing to the resistance of trees to UV and other stresses.
3.6. DEGs Involved in Nitrogen Metabolism
With the increasing elevation, eight DEGs were found to be involved in N assimilation (Table 3; Table S10). Three NIAs (nitrate reductases), which are key genes involved in the first step of nitrate assimilation in plants, were downregulated. Meanwhile, one NIR (ferredoxin-nitrite reductase), which catalyzes the six-electron reduction of nitrite into ammonium, was downregulated. Moreover, two NRTs (nitrate transporters) were also downregulated, although one NRT and one AMT (ammonium transporter) were found to be upregulated. These results suggested that high altitude conditions blocked the uptake, assimilation, and transport of N.
Moreover, 18 DEGs were found to be closely associated with amino acid metabolism. Thirteen of them were downregulated with the increasing elevations, including GLMS (glutamine--fructose-6-phosphate aminotransferase) for glutamine, METE (5-methyltetrahydropteroyltriglutamate--homocysteine methyltransferase) and HMT (homocysteine S-methyltransferase 1) for methionine, two ARODs (arogenate dehydratase/prephenate dehydratase), three AROFs (phospho-2-dehydro-3-deoxyheptonate aldolase) and PAL (phenylalanine ammonia-lyase) for phenylalanine, AAT (aspartate aminotransferase) for aspartate, CAS (L-3-cyanoalanine synthase) for cysteine, two GLYM (serine hydroxymethyltransferase) for serine. The other five DEGs were upregulated, including two ARGI (arginase) and SPD (spermidine synthase) for arginine, GAD (glutamate decarboxylase) for γ-aminobutyric acid, and SDC (serine decarboxylase) for serine. This also indicated that high altitude conditions mostly had a negative effect on amino acid metabolism.
4. Discussion
4.1. Response of NSC and N to the Increasing Elevations
The elevational trend in plant tissue NSC (Figure 1) indicated that the tissue NSC concentrations of trees growing at the alpine treeline were lower than that of trees at lower elevations, in terms of the early growing season. This result suggested that the treeline trees may suffer from a ‘C limitation’ in the early growing season. In the evergreen trees, branch storage and remobilization were found to be crucial for new shoot growth in spring [34]. We speculated that the concentrations of NSC in tissues were decreased in the early growing season, indicating that the mobile carbohydrates stored in tissues were utilized for shoot growth. On the other hand, plants grown under environmental stress conditions have lower tissue NSC concentrations than those grown under normal conditions. Many studies have shown that trees’ hardness and ability to withstand cold are positively related to soluble carbohydrate concentrations in the tissues [10,35,36]. Alpine trees grown under a cold environment consume large amounts of stored carbohydrates to maintain normal growth and resist to a low temperature stress. Our result is consistent with that work of Dang et al. [11], which showed that the NSC concentrations in tissues were highest in the late growing season and decreased from early to late growing season on both slopes, indicating that the mobile carbohydrates stored in tissues were utilized from bud break and shoot growth in the early growing season [11].
In this study, the increasing trends of total N in the needles and stems suggested that N availability did not constrain sink activity at higher altitudes, which is why the treeline trees had no sufficient nutrient supply. This result was in agreement with those of previous studies, which showed that the tissue N content in treeline trees is higher than that in lower elevation trees [10,20,37,38,39]. Reich et al. [40] also reported that plants at high elevations exhibit N-physiological adaptation strategies to compensate for lower efficiency of physiological processes in low temperature environments. Therefore, these studies indicated that N seemed not to be a limiting factor for tree growth and development around the alpine treelines. Our results also showed that N concentrations in the needles were higher than those in roots at all elevations, supporting the fact that N allocation to storage tissues and remobilization for reuse in trees are seasonally programmed, and that the annual growth of many tree species heavily relies on the internal cycling of N, by which N is stored over winter and subsequently remobilized in spring for new growth [41,42]. However, whether N indeed limits the growth of treeline trees and determines the treeline formation needs to be further studied.
4.2. Changes of Genes Involved in C Assimilation and Metabolism in P. crassifolia with Increasing Elevations
In this study, many genes were found to be differentially expressed with the changes of elevation, including most of the downregulated genes involved in photosynthesis and carbohydrate metabolism. This result was consistent with the decrease in NSC content with the increasing elevation. All aspects of photosynthesis including the light reactions, the Calvin cycle, and photorespiration can be affected by low temperature stress [43,44], as well as the light-harvesting chlorophyll a/b-binding proteins, which are major constituents of the light harvesting complex in the thylakoid membranes [45]. This study showed that the expression of six chlorophyll a-b binding protein genes were significantly downregulated with the increasing elevations, which helped to explain the decreased C fixation, also suggesting that cold soil and ultraviolet-B radiation (UV-B ) radiation leads to the downregulation of several transcripts encoding key photosynthetic proteins.
RFOs, particularly raffinose, play a role in the acquisition of cold tolerance and other stress responses in many plant species [46,47]. α-Galactosidase (AGAL) is a key enzyme involved in the breakdown of RFOs [47], and plays a role in producing osmoprotectants that stabilize the membranes and protect cells against oxidative stress [48]. Moreover, α-glucosidase (AGLU) digests carbohydrates, including starch and stable sugar [46]. Thus, the increase in AGAL and AGLU expression observed in this study might help P. crassifolia to resist the cold stress at the higher elevations. However, the expression of GOLS1 (encoding galactinol synthase 1), which is the first committed enzyme in the RFO synthesis pathway [46], decreased with the increasing elevations. These results indicated that the RFO pathway might play a crucial role in the response of P. crassifolia to elevation changes.
Plant cuticle lipids form outer protective layers to resist environmental stresses, including water loss, UV radiation, and low temperature [49,50], and many of these related genes are linked by their biological function to a specific response to low temperature and strong UV [51,52]. For example, 3-ketoacyl-CoA synthases (KCSs) belong to the group of “very long chain fatty acids”, which are required for wax synthesis [53,54]. Moreover, fatty acyl-coA reductases (FARs), which are reported to be involved in cuticular wax production, i.e., involved in wax synthesis [49], and long-chain acyl-CoA synthetases (LACSs), have important roles in lipid synthesis and storage, synthesis of cutin and wax, and stress responses [55]. In this study, six KCSs, three FARs, and three LACSs were identified to be significantly induced with the increasing elevation, which might contribute to the survival of P. crassifoliain in the alpine environment. Furthermore, a significant enhancement in 17 of the 21 GDLs—encoding GDSL esterase/lipases, which play important roles in plant physiological processes, such as development, and stress responses [56]—would benefit the survival of P. crassifolia in the alpine environment.
Flavonoids are a large class of plant secondary metabolites that exert diverse biological and pharmacological effects, including the protection of plants against abiotic stresses [57]. With respect to enzymatic coding genes involved in the flavonoid or anthocyanin biosynthetic pathway, in this study, 12 of the 29 DEGs were upregulated at different elevations. For example, F3Hs and F3′5′Hs, encoding flavanone 3-hydroxylases and flavonoid 3′,5′-hydroxylase, respectively, are involved in an early step in flavonoid metabolism leading to the formation of dihydroflavonols from flavanones [57,58]. In grape berries, UV-B increases the expression of these two genes, resulting in increased flavonol and anthocyanin content [59]. Our study showed that half of these genes were upregulated, indicating their roles in the resistance to cold stress and UV stress at higher elevations. Meanwhile, the increase of elevations also significantly promoted the transcript of anthocyanin downstream pathway genes, including 3 DFRs (dihydroflavonol-4-reductase), 1 UFGT (anthocyanidin 3-O-glucosyltransferas), and 1 ANR (anthocyanidin reductase), and these would contribute to the resistance of trees to UV or other stresses [57]. Therefore, the present study results indicated that flavonoids might play an important role in the survival of P. crassifoliain in the alpine environment.
5. Conclusions
This study demonstrated that the concentration of NSC significantly decreased in the current-year needles of P. crassifolia with increasing elevations, especially starch, indicating C limitation in trees around the treeline environment in the early growing season. This was further supported by the results of RNA-Seq, which showed almost all the photosynthesis-related genes were downregulated by the increasing elevations. Meanwhile, we found that large amounts of differentially expressed genes were involved not only in the central C metabolism, but also in the C-based secondary metabolism, including wax and flavonoid biosynthesis, contributing to the survival of P. crassifolia in the alpine environment. Thus, our study provided molecular evidence of C limitation hypothesis in treeline formation, as well as provided a better understanding of molecular mechanism of treeline tree survival in severely adverse conditions.
Supplementary Materials
The following are available online at https://www.mdpi.com/1999-4907/11/2/156/s1.
Author Contributions
Data curation, Z.S. and L.Z.; Funding acquisition, W.X.; Methodology, X.D., J.L. and M.L.; Software, J.L.; Writing—original draft, Z.S.; Writing—review & editing, Z.S., D.B., M.L. and W.X. All authors have read and agreed to the published version of the manuscript.
Funding
This work was support by the National Natural Science Foundation of China (31300496) and the National Key Research and Development Program of the Ministry of Science and Technology of China (no. 2016YFD0600201).
Acknowledgments
We thank Shunli Wang and Xuelong Zhang from Academy of Water Resources Conservation Forests in Qilian Mountains of Gansu Province, for their help in the field campaigns and processing of the samples.
Conflicts of Interest
We declare no conflict of interest between the authors.
Deposited Data
The RNA-Seq datasets by using Illumina-Solexa platform are available from the NCBI Sequence Read Archive database (SRA; http://www.ncbi.nlm.nih.gov/sra) under submission number SUB6512905. The cDNA libraries were constructed from the elevations 2500, 2900, and 3300 m samples, respectively, with three biological replicates performed.
References
- Körner, C. Carbon Limitation in Trees. J. Ecol. 2003, 91, 4–17. [Google Scholar] [CrossRef] [Green Version]
- Harsch, M.A.; Bader, M.Y. Treeline Form—A Potential Key to Understanding Treeline Dynamics. Glob. Ecol. Biogeogr. 2011, 20, 582–596. [Google Scholar] [CrossRef]
- Körner, C.; Paulsen, J. A World-Wide Study of High Altitude Treeline Temperatures. J. Biogeogr. 2004, 31, 713–732. [Google Scholar] [CrossRef]
- Dolezal, J.; Kopecky, M.; Dvorsky, M.; Macek, M.; Rehakova, K.; Capkova, K.; Borovec, J.; Schweingruber, F.; Liancourt, P.; Altman, J. Sink Limitation of Plant Growth Determines Tree Line in the Arid Himalayas. Funct. Ecol. 2019, 33, 553–565. [Google Scholar] [CrossRef]
- Körner, C. A Re-Assessment of High Elevation Treeline Positions and Their Explanation. Oecologia 1998, 115, 445–459. [Google Scholar] [CrossRef] [PubMed] [Green Version]
- Neuner, G. Frost Resistance in Alpine Woody Plants. Front. Plant Sci. 2014, 5, 654–667. [Google Scholar] [CrossRef] [PubMed] [Green Version]
- Gardingen, P.R.; Grace, J.; Jeffree, C.E. Abrasive Damage by Wind to the Needle Surfaces of Picea Sitchensis (Bong.) Carr. And Pinus Sylvestris L. Plant Cell Environ. 1991, 14, 185–193. [Google Scholar] [CrossRef]
- Perkins, T.D.; Adams, G.T. Rapid Freezing Induces Winter Injury Symptomatology in Red Spruce Foliage. Tree Physiol. 1995, 15, 259–266. [Google Scholar] [CrossRef]
- Sigdel, S.R.; Wang, Y.; Camarero, J.J.; Zhu, H.; Liang, E.; Peñuelas, J. Moisture-Mediated Responsiveness of Treeline Shifts to Global Warming in the Himalayas. Glob. Chang. Boil. 2018, 24, 5549–5559. [Google Scholar] [CrossRef] [Green Version]
- Li, M.; Xiao, W.; Shi, P.; Wang, S.; Zhong, Y.-D.; Liu, X.-L.; Wang, X.-D.; Cai, X.-H.; Shi, Z.-M. Nitrogen and Carbon Source-Sink Relationships in Trees at the Himalayan Treelines Compared With Lower Elevations. Plant Cell Environ. 2008, 31, 1377–1387. [Google Scholar] [CrossRef]
- Dang, H.S.; Zhang, K.R.; Zhang, Q.F.; Xu, Y.M.; Leegood, R. Temporal Variations of Mobile Carbohydrates in Abuesfargesii at the Upper Tree Limits. Plant Biol. 2015, 17, 106–113. [Google Scholar] [CrossRef] [PubMed]
- Fajardo, A.; Piper, F.I.; Lohengrin, A.C. Distinguishing Local from Global Climate Influences in the Variation of Carbon Status With Altitude in a Tree Line Species. Glob. Ecol. Biogeogr. 2011, 20, 307–318. [Google Scholar] [CrossRef]
- Hoch, G.; Körner, C. Global Patterns of Mobile Carbon Stores in Trees at the High-Elevation Treeline. Glob. Ecol. Biogeogr. 2012, 21, 861–871. [Google Scholar] [CrossRef]
- Shi, P.; Korner, C.; Hoch, G. A Test of the Growth-Limitation Theory for Alpine Tree Line Formation in Evergreen and Deciduous Taxa of the Eastern Himalayas. Funct. Ecol. 2008, 22, 213–220. [Google Scholar] [CrossRef]
- Fajardo, A.; Piper, F.I. An Assessment of Carbon and Nutrient Limitations in the Formation of the Southern Andes Tree Line. J. Ecol. 2017, 105, 517–527. [Google Scholar] [CrossRef]
- Wang, Q.-W.; Qi, L.; Zhou, W.; Liu, C.-G.; Yu, D.; Dai, L. Carbon Dynamics in the Deciduous Broadleaf Tree Erman’s Birch (Betula Ermanii) at the Subalpine Treeline on Changbai Mountain, Northeast China. Am. J. Bot. 2018, 105, 42–49. [Google Scholar] [CrossRef] [Green Version]
- Ellison, S.B.Z.; Sullivan, P.F.; Cahoon, S.M.P.; Hewitt, R.E. Poor Nutrition As a Potential Cause of Divergent Tree Growth Near the Arctic Treeline in Northern Alaska. Ecology 2019, 100, e02878. [Google Scholar] [CrossRef]
- Wang, Q.-W.; Liu, C.-G.; Zhou, W.; Qi, L.; Zhou, L.; Yu, D.; Dai, L. Mobile Carbon Supply in Trees and Shrubs at the Alpine Treeline Ecotone. Veg. 2018, 219, 467–479. [Google Scholar] [CrossRef]
- Xu, M.; Wang, G.; Li, X.; Cai, X.; Li, X.; Christie, P.; Zhang, J. The Key Factor Limiting Plant Growth in Cold and Humid Alpine Areas Also Plays a Dominant Role in Plant Carbon Isotope Discrimination. Front. Plant Sci. 2015, 6, 425. [Google Scholar] [CrossRef] [Green Version]
- Li, M.-H.; Jiang, Y.; Wang, A.; Li, X.; Zhu, W.; Yan, C.-F.; Du, Z.; Shi, Z.; Lei, J.; Schönbeck, L.; et al. Active Summer Carbon Storage for Winter Persistence in Trees at the Cold Alpine Treeline. Tree Physiol. 2018, 38, 1345–1355. [Google Scholar] [CrossRef]
- Weber, R.; Gessler, A.; Hoch, G. High Carbon Storage in Carbon-Limited Trees. New Phytol. 2019, 222, 171–182. [Google Scholar] [CrossRef] [PubMed] [Green Version]
- Zheng, L.; Meng, Y.; Ma, J.; Zhao, X.; Cheng, T.; Ji, J.; Chang, E.; Meng, C.; Deng, N.; Chen, L.; et al. Transcriptomic Analysis Reveals Importance of ROS and Phytohormones in Response to Short-Term Salinity Stress in Populus Tomentosa. Front. Plant Sci. 2015, 6, 433. [Google Scholar] [CrossRef] [PubMed] [Green Version]
- Dudhate, A.; Shinde, H.; Tsugama, D.; Liu, S.; Takano, T. Transcriptomic Analysis Reveals the Differentially Expressed Genes and Pathways Involved in Drought Tolerance in Pearl Millet [Pennisetum Glaucum (L.) R. Br]. PLoS ONE 2018, 13, e0195908. [Google Scholar] [CrossRef] [PubMed]
- Ma, L.; Sun, X.; Kong, X.; Galván, J.V.; Li, X.; Yang, S.; Yang, Y.; Yang, Y.; Hu, X. Physiological, Biochemical and Proteomics Analysis Reveals the Adaptation Strategies of the Alpine Plant Potentilla Saundersiana at Altitude Gradient of the Northwestern Tibetan Plateau. J. Proteom. 2015, 112, 63–82. [Google Scholar] [CrossRef]
- Yu, J.G.; Wang, E.Z. Modern Practical Instrument Analysis Method, 1st ed.; China Forestry Publishing: Beijing, China, 1994; pp. 83–84. [Google Scholar]
- Shi, Z.; Bai, D.Z.; Zhang, W.C.; Xiao, W.F. Variation of Nonstructural Carbohydrate (NSC) in Picea Crassifolia at the Alpine Treeline of Qilian Mountains before and After Dormancy. Forest Res. 2017, 30, 908–915. [Google Scholar]
- Liu, F.L.; Dai, H.J. Food Physicochemical Analysis Method, 1st ed.; Light Industry Press: Beijing, China, 1987; pp. 65–66. [Google Scholar]
- Trapnell, C.; Pachter, L.; Salzberg, S.L. TopHat: Discovering Splice Junctions With RNA-Seq. Bioinformatics 2009, 25, 1105–1111. [Google Scholar] [CrossRef]
- Trapnell, C.; Williams, B.A.; Pertea, G.; Mortazavi, A.; Kwan, G.; Van Baren, M.J.; Salzberg, S.L.; Wold, B.J.; Pachter, L. Transcript Assembly and Quantification by RNA-Seq Reveals Unannotated Transcripts and Isoform Switching During Cell Differentiation. Nat. Biotechnol. 2010, 28, 511–515. [Google Scholar] [CrossRef] [Green Version]
- Anders, S.; Huber, W. Differential Expression Analysis for Sequence Count Data. Genome Biol. 2010, 11, R106. [Google Scholar] [CrossRef] [Green Version]
- Young, M.D.; Wakefield, M.J.; Smyth, G.K.; Oshlack, A. Gene Ontology Analysis for RNA-Seq: Accounting for Selection Bias. Genome Boil. 2010, 11, R14. [Google Scholar] [CrossRef] [Green Version]
- Kanehisa, M.; Araki, M.; Goto, S.; Hattori, M.; Hirakawa, M.; Itoh, M.; Katayama, T.; Kawashima, S.; Okuda, S.; Tokimatsu, T.; et al. KEGG for Linking Genomes to Life and the Environment. Nucleic Acids Res. 2008, 36, 480–484. [Google Scholar] [CrossRef]
- Yakovlev, I.A.; Fossdal, C.-G.; Johnsen, Ø.; Junttila, O.; Skrøppa, T. Analysis of Gene Expression During Bud Burst Initiation in Norway Spruce via ESTs from Subtracted CDNA Libraries. Tree Genet. Genomes 2006, 2, 39–52. [Google Scholar] [CrossRef]
- Palacio, S.; Camarero, J.J.; Maestro, M.; Alla, A.Q.; Lahoz, E.; Montserrat-Martí, G. Are Storage and Tree Growth Related? Seasonal Nutrient and Carbohydrate Dynamics in Evergreen and Deciduous Mediterranean Oaks. Trees 2018, 32, 777–790. [Google Scholar] [CrossRef]
- Ogren, E. Relationship Between Temperature, Respiratory Loss of Sugar and Premature De Hardening in Dormant Scots Pine Seedlings. Tree Physiol. 1997, 17, 47–51. [Google Scholar] [CrossRef] [PubMed]
- Morin, X.; Améglio, T.; Ahas, R.; Kurz-Besson, C.; Lanta, V.; LeBourgeois, F.; Miglietta, F.; Chuine, I. Variation in Cold Hardiness and Carbohydrate Concentration from Dormancy Induction to Bud Burst Among Provenances of Three European Oak Species. Tree Physiol. 2007, 27, 817–825. [Google Scholar] [CrossRef] [PubMed] [Green Version]
- Hoch, G.; Popp, M.; Körner, C. Altitudinal Increase of Mobile Carbon Pools in Pinus Cembra Suggests Sink Limitation of Growth at the Swiss Treeline. Oikos 2002, 98, 361–374. [Google Scholar] [CrossRef]
- Wang, Z.; Xia, C.; Yu, D.; Wu, Z. Low-Temperature Induced Leaf Elements Accumulation in Aquatic Macrophytes across Tibetan Plateau. Ecol. Eng. 2015, 75, 1–8. [Google Scholar] [CrossRef]
- Hong, J.; Wang, X.; Wu, J. Stoichiometry of Root and Leaf Nitrogen and Phosphorus in a Dry Alpine Steppe on the Northern Tibetan Plateau. PLoS ONE 2014, 9, 109052. [Google Scholar] [CrossRef]
- Reich, P.B.; Oleksyn, J. Global Patterns of Plant Leaf N and P in Relation to Temperature and Latitude. Proc. Natl. Acad. Sci. 2004, 101, 11001–11006. [Google Scholar] [CrossRef] [Green Version]
- Millard, P.; Proe, M.F. Storage and Internal Cycling of Nitrogen in Relation to Seasonal Growth of Sitka Spruce. Tree Physiol. 1992, 10, 33–43. [Google Scholar] [CrossRef] [Green Version]
- Millard, P.; Grelet, G.-A. Nitrogen Storage and Remobilization by Trees: Ecophysiological Relevance in a Changing World. Tree Physiol. 2010, 30, 1083–1095. [Google Scholar] [CrossRef] [Green Version]
- Goulas, E.; Schubert, M.; Kieselbach, T.; Kleczkowski, L.A.; Gardeström, P.; Schröder, W.; Hurry, V. The Chloroplast Lumen and Stromal Proteomes of Arabidopsis Thaliana Show Differential Sensitivity to Short-and Long-Term Exposure to Low Temperature. Plant J. 2006, 47, 720–734. [Google Scholar] [CrossRef] [PubMed]
- Friesen, P.C.; Sage, R.F. Photosynthetic Responses to Chilling in a Chilling-Tolerant and Chilling-Sensitive Miscanthus Hybrid. Plant Cell Environ. 2016, 39, 1420–1431. [Google Scholar] [CrossRef] [PubMed] [Green Version]
- Liu, R.; Xu, Y.; Jiang, S.; Lu, K.; Lu, Y.; Feng, X. The Light-Harvesting Chlorophyll a/B-Binding Proteins, Positively Involved in a Bscisic Acid Signaling, Require a Transcription Repressor, WRKY40, to Balance Their Function. J. Exp. Bot. 2013, 64, 5443–5456. [Google Scholar] [CrossRef] [PubMed] [Green Version]
- Liu, Y.; Ji, D.; Turgeon, R.; Chen, J.; Lin, T.; Huang, J.; Luo, J.; Zhu, Y.; Zhang, C.; Lv, Z. Physiological and Proteomic Responses of Mulberry Trees (Morus Alba. L.) to Combined Salt and Drought Stress. Int. J. Mol. Sci. 2019, 20, 2486. [Google Scholar] [CrossRef] [PubMed] [Green Version]
- Pennycooke, J.C.; Jones, M.L.; Stushnoff, C. Down-Regulating α-Galactosidase Enhances Freezing Tolerance in Transgenic Petunia1. Plant Physiol. 2003, 133, 901–909. [Google Scholar] [CrossRef] [Green Version]
- Vinocur, B.; Altman, A. Recent Advances in Engineering Plant Tolerance to Abiotic Stress: Achievements and Limitations. Curr. Opin. Biotechnol. 2005, 16, 123–132. [Google Scholar] [CrossRef]
- Rowland, O.; Zheng, H.; Hepworth, S.R.; Lam, P.; Jetter, R.; Kunst, L. CER4 Encodes an Alcohol-Forming Fatty Acyl-Coenzyme A Reductase Involved in Cuticular Wax Production in Arabidopsis1[W]. Plant Physiol. 2006, 142, 866–877. [Google Scholar] [CrossRef] [Green Version]
- He, J.; Tang, S.; Yang, D.; Chen, Y.; Ling, L.; Zou, Y.; Zhou, M.; Xu, X. Chemical and Transcriptomic Analysis of Cuticle Lipids under Cold Stress in the Llungiella Salsuginea. Inter. J. Mol. Sci. 2019, 20, e4519. [Google Scholar] [CrossRef] [Green Version]
- Lee, S.B.; Suh, M.C. Advances in the Understanding of Cuticular Waxes in Arabidopsis Thaliana and Crop Species. Plant Cell Rep. 2015, 34, 557–572. [Google Scholar] [CrossRef]
- Domínguez, E.; Heredia-Guerrero, J.A.; Heredia, A. The Biophysical Design of Plant Cuticles: A View. New Phytol. 2011, 189, 938–949. [Google Scholar]
- Todd, J.; Post-Beittenmiller, D.; Jaworski, J.G. KCS1encodes a Fatty Acid Elongase 3-Ketoacyl-CoA Synthase Affecting Wax Biosynthesis In Arabidopsis Thaliana. Plant J. 1999, 17, 119–130. [Google Scholar] [CrossRef] [PubMed]
- Xue, D.; Zhang, X.; Lu, X.; Chen, G.; Chen, Z.-H. Molecular and Evolutionary Mechanisms of Cuticular Wax for Plant Drought Tolerance. Front. Plant Sci. 2017, 8, 2115. [Google Scholar] [CrossRef] [PubMed]
- Zhang, C.-L.; Mao, K.; Zhou, L.-J.; Wang, G.-L.; Zhang, Y.-L.; Li, Y.-Y.; Hao, Y.-J. Genome-Wide Identification and Characterization of Apple Long-Chain Acyl-CoA Synthetases and Expression Analysis under Different Stresses. Plant Physiol. Biochem. 2018, 132, 320–332. [Google Scholar] [CrossRef] [PubMed]
- Cao, Y.; Han, Y.; Meng, D.; Abdullah, M.; Yu, J.; Li, D.; Jin, Q.; Lin, Y.; Cai, Y. Expansion and Evolutionary Patterns of GDSL-Type esterases/Lipases in Rosaceae Genomes. Funct. Integr. Genom. 2018, 18, 673–684. [Google Scholar] [CrossRef] [PubMed]
- Peng, X.; Wu, H.; Chen, H.; Zhang, Y.; Qiu, D.; Zhang, Z. Transcriptome Profiling Reveals Candidate Flavonol-Related Genes of Tetrastigma Hemsleyanum under Cold Stress. BMC Genom. 2019, 20, 687. [Google Scholar] [CrossRef] [PubMed] [Green Version]
- Jia, Y.; Li, B.; Zhang, Y.; Zhang, X.; Xu, Y.; Li, C. Evolutionary Dynamic Analyses on Monocot Flavonoid 3′-Hydroxylase Gene Family Reveal Evidence of Plant-Environment Interaction. BMC Plant Boil. 2019, 19, 347. [Google Scholar] [CrossRef] [Green Version]
- Martínez-Lüscher, J.; Delrot, S.; Aguirreolea, J.; Pascual, I.; Gomes, E.; Sánchez-Díaz, M.; Gomès, E. Ultraviolet-B Radiation and Water Deficit Interact to Alter Flavonol and Anthocyanin Profiles in Grapevine Berries through Transcriptomic Regulation. Plant Cell Physiol. 2014, 55, 1925–1936. [Google Scholar] [CrossRef]
Figure 1.
Changes of non-structural carbohydrates of Picea crassifolia with the increasing elevations (m). (A–C) Current-year needles; (D–F) current-year branches. Different lowercase letters represented the significance levels (p < 0.05) among the different elevations. NSC: non-structural carbohydrate.

Figure 2.
Changes of non-structural carbohydrates in the roots of Picea crassifolia with the increasing elevations (m). (A–C), coarse roots with 0.5–1.0 cm in diameter; (D–F), fine roots with <0.5 cm in diameter. Different lowercase letters represented the significance levels (p< 0.05) among the different elevations.

Figure 3.
Changes of total N in the different tissues of Picea crassifolia with the increasing elevations (m). (A) Current-year needles, (B) current-year branches, (C) coarse roots with 0.5–1.0 cm in diameter, (D) fine roots with <0.5 cm in diameter. Different lowercase letters represented the significance levels (p < 0.05) among the different elevations.

Figure 4.
Transcriptomes of Picea crassifolia with elevations. (A) Numbers of differentially expressed genes (DEGs). (B) Venn diagrams showing unique and shared DEGs between altitudes.
Figure 4.
Transcriptomes of Picea crassifolia with elevations. (A) Numbers of differentially expressed genes (DEGs). (B) Venn diagrams showing unique and shared DEGs between altitudes.

Figure 5.
Verification of RNA sequencing (RNA-Seq) results by quantitative real-time PCR (qRT-PCR).

Figure 6.
Gene Ontology (GO) term enrichment in Picea crassifolia with elevations.

Figure 7.
Kyoto Encyclopedia of Genes and Genomes (KEGG) pathways in Picea crassifolia with elevations.
Figure 7.
Kyoto Encyclopedia of Genes and Genomes (KEGG) pathways in Picea crassifolia with elevations.

Figure 8.
Clustering analysis by K-means clustering of differentially expressed genes (DEGs) in Picea crassifolia with elevations.
Figure 8.
Clustering analysis by K-means clustering of differentially expressed genes (DEGs) in Picea crassifolia with elevations.


Table 1.
DEGs involved in carbon assimilation and carbon metabolism.
| Gene | Log2(2900/2500) | Log2(3300/2500) | Gene ID | Annotation | Accession |
|---|---|---|---|---|---|
| Photosynthetic Carbon Assimilation | |||||
| CLH2 | 1.8 | 1.9 | MA_337265g0010 | Chlorophyllase-2 | sp|Q9M7I7|CLH2_ARATH |
| LHCA4 | −0.6 | −1.0 | MA_65346g0010 | Chlorophyll a-b binding protein 4 | sp|P27521|CA4_ARATH |
| LHCB4C | −0.6 | −1.0 | MA_129206g0010 | Chlorophyll a-b binding protein CP29.3 | sp|Q9S7W1|CB4C_ARATH |
| LHCB2A | −0.6 | −1.3 | MA_97315g0010 | Chlorophyll a-b binding protein type 2 member 1A | sp|P15193|CB2A_PINSY |
| LHCB22 | 0.9 | 1.8 | MA_1315g0010 | Chlorophyll a-b binding protein type 2 member 1B | sp|P15194|CB2B_PINSY |
| LHCB21 | −0.9 | −1.3 | MA_10431300g0030 | Chlorophyll a-b binding protein type 2 member 2 | sp|P15192|CB22_PINSY |
| LHCB21 | −1.1 | −1.9 | MA_10431300g0010 | Chlorophyll a-b binding protein type I | sp|P10049|CB21_PINTH |
| LHCB21 | −1.0 | −1.7 | MA_10431300g0020 | Chlorophyll a-b binding protein type I | sp|P10049|CB21_PINTH |
| LHCB21 | −1.0 | −1.7 | MA_267089g0010 | Chlorophyll a-b binding protein type I | sp|P10049|CB21_PINTH |
| PSAD | −0.5 | −1.0 | MA_9169733g0010 | Photosystem I reaction center subunit II, chloroplastic | sp|P32869|PSAD_CUCSA |
| PSAF | −0.8 | −1.5 | MA_10090427g0010 | Photosystem I reaction center subunit III, chloroplastic | sp|P46486|PSAF_FLATR |
| PSAN | 4.0 | 5.7 | MA_3482g0010 | Photosystem I reaction center subunit N, chloroplastic | sp|P49107|PSAN_ARATH |
| PSAG | −0.5 | −1.1 | MA_100910g0020 | Photosystem I reaction center subunit V, chloroplastic | sp|Q9S7N7|PSAG_ARATH |
| PSAL | −0.5 | −1.0 | MA_3403026g0010 | Photosystem I reaction center subunit XI, chloroplastic | sp|P23993|PSAL_HORVU |
| PSAO | −0.6 | −1.0 | MA_893g0010 | Photosystem I subunit | sp|Q949Q5|PSAO_ARATH |
| PSAO | −0.5 | −1.0 | MA_7732837g0010 | Photosystem I subunit | sp|Q949Q5|PSAO_ARATH |
| PSBR | −1.1 | −1.1 | MA_282261g0010 | Photosystem II 10 kDa polypeptide, chloroplastic | sp|P06183|PSBR_SOLTU |
| PST2 | −0.6 | −1.2 | MA_17217g0020 | Photosystem II 5 kDa protein, chloroplastic | sp|P31336|PST2_GOSHI |
| PSBY | −0.7 | −1.2 | MA_12201g0010 | Photosystem II core complex proteins psbY, chloroplastic | sp|P80470|PSBY_SPIOL |
| PSBO | −0.4 | −1.3 | MA_491379g0010 | Photosystem II oxygen-evolving enhancer protein 1, chloroplastic | sp|O49079|PSBO_FRIAG |
| PSBP | −0.7 | −1.0 | MA_3005g0010 | Photosystem II oxygen-evolving enhancer protein 2, chloroplastic | sp|Q9SLQ8|PSBP_CUCSA |
| PSBQ1 | −0.5 | −1.0 | MA_218996g0010 | Photosystem II oxygen-evolving enhancer protein 3-1, chloroplastic | sp|Q9XFT3|PSBQ1_ARATH |
| RBCS | 1.4 | 2.9 | MA_476g0010 | Ribulose bisphosphate carboxylase small chain, chloroplastic | sp|P16031|RBS_LARLA |
| FRO7 | −0.3 | −1.1 | MA_79239g0010 | Ferric reduction oxidase 7, chloroplastic | sp|Q3KTM0|FRO7_ARATH |
| Energy Metabolism | |||||
| F16P | −0.2 | −1.0 | MA_10432295g0010 | Fructose-1,6-bisphosphatase, chloroplastic | sp|Q07204|F16P1_BRANA |
| KPRS1 | −0.7 | −1.1 | MA_10431983g0010 | Ribose-phosphate pyrophosphokinase 1 | sp|Q9XG98|KPRS1_SPIOL |
| G3PC | −1.1 | −0.1 | MA_10426544g0010 | Glyceraldehyde-3-phosphate dehydrogenase, cytosolic | sp|P34924|G3PC_PINSY |
| G3PC | −1.1 | −0.7 | MA_8215705g0010 | Glyceraldehyde-3-phosphate dehydrogenase, cytosolic | sp|P34924|G3PC_PINSY |
| ALD | 1.1 | 1.7 | MA_259175g0010 | Aldose 1-epimerase | sp|Q5EA79|GALM_BOVIN |
| SDHA | 0.7 | 1.4 | MA_10427069g0010 | Succinate dehydrogenase [ubiquinone] flavoprotein subunit, mitochondrial | sp|Q6ZDY8|SDHA_ORYSJ |
| GAD | 2.0 | 2.3 | MA_161013g0010 | Glutamate decarboxylase | sp|Q07346|GAD_PETHY |
| GAD | 1.4 | 0.7 | MA_89828g0010 | Glutamate decarboxylase | sp|Q07346|GAD_PETHY |
Table 2.
DEGs involved in non-structural carbon metabolism.
| Gene | Log2(2900/2500) | Log2(3300/2500) | Gene ID | Annotation | Accession |
|---|---|---|---|---|---|
| Soluble Sugars | |||||
| AGLU | 2.3 | 2.5 | MA_10431114g0020 | Alpha-glucosidase | sp|O04893|AGLU_SPIOL |
| AGAL | 2.7 | 3.5 | MA_10434513g0010 | Alpha-galactosidase mel1 | sp|Q9URZ0|AGAL_SCHPO |
| GOLS1 | −1.0 | −1.9 | MA_67331g0010 | Galactinol synthase | sp|Q9XGN4|GOLS1_AJURE |
| GAOA | −0.4 | −1.4 | MA_10429735g0020 | Galactose oxidase | sp|I1S2N3|GAOA_GIBZE |
| GAOA | −0.6 | −2.9 | MA_10429735g0010 | Galactose oxidase | sp|I1S2N3|GAOA_GIBZE |
| GAOA | −1.4 | −1.8 | MA_10437233g0040 | Galactose oxidase | sp|P0CS93|GAOA_GIBZA |
| RFS5 | −0.1 | 1.4 | MA_5981g0010 | Probable galactinol--sucrose galactosyltransferase 5 | sp|Q9FND9|RFS5_ARATH |
| RFS6 | 1.5 | 0.0 | MA_18317g0010 | Probable galactinol--sucrose galactosyltransferase 6 | sp|Q8RX87|RFS6_ARATH |
| Fatty Acids | |||||
| TSC10A | 2.9 | 6.5 | MA_18495g0010 | 3-dehydrosphinganine reductase TSC10A | sp|Q0WRJ2|TSC10A_ARATH |
| TSC10B | 1.6 | 3.0 | MA_681548g0010 | 3-dehydrosphinganine reductase TSC10B | sp|F4JZN6|TSC10B_ARATH |
| KCS1 | 1.8 | 3.1 | MA_10426663g0020 | 3-ketoacyl-CoA synthase 1 | sp|Q9MAM3|KCS1_ARATH |
| KCS10 | 2.3 | 3.2 | MA_91011g0010 | 3-ketoacyl-CoA synthase 10 | sp|Q570B4|KCS10_ARATH |
| KCS4 | 2.2 | 4.0 | MA_56709g0010 | 3-ketoacyl-CoA synthase 4 | sp|Q9LN49|KCS4_ARATH |
| KCS6 | 0.9 | 1.7 | MA_10605g0020 | 3-ketoacyl-CoA synthase 6 | sp|Q9XF43|KCS6_ARATH |
| KCS9 | 1.8 | 2.0 | MA_339700g0010 | 3-ketoacyl-CoA synthase 9 | sp|Q9SIX1|KCS9_ARATH |
| KASC1 | 1.4 | 2.2 | MA_127500g0010 | 3-oxoacyl-[acyl-carrier-protein] synthase I, chloroplastic | sp|P52410|KASC1_ARATH |
| FAR2 | 3.9 | 4.9 | MA_59202g0010 | Fatty acyl-CoA reductase 2 | sp|Q08891|FAR2_ARATH |
| FAR2 | 2.9 | 5.7 | MA_95531g0010 | Fatty acyl-CoA reductase 2 | sp|Q08891|FAR2_ARATH |
| FAR2 | 2.6 | 3.5 | MA_182956g0010 | Fatty acyl-CoA reductase 2 | sp|Q08891|FAR2_ARATH |
| AOC3 | 1.4 | 1.1 | MA_137604g0010 | Allene oxide cyclase 3, chloroplastic | sp|Q9LS01|AOC3_ARATH |
| DOX1 | −1.9 | 0.1 | MA_879270g0010 | Alpha-dioxygenase 1 | sp|Q9SGH6|DOX1_ARATH |
| AGAL | 2.7 | 3.5 | MA_10434513g0010 | Alpha-galactosidase mel1 | sp|Q9URZ0|AGAL_SCHPO |
| ACCC1 | 0.9 | 1.4 | MA_8514g0010 | Biotin carboxylase 1, chloroplastic | sp|B9HBA8|ACCC1_POPTR |
| GONS3 | 1.7 | 2.8 | MA_10432234g0010 | GDP-mannose transporter GONST3 | sp|Q9S845|GONS3_ARATH |
| GDL6 | −0.8 | 2.1 | MA_405425g0010 | GDSL esterase/lipase 6 | sp|Q9C996|GDL6_ARATH |
| GDL1 | 1.3 | 2.1 | MA_27394g0010 | GDSL esterase/lipase At1g06990 | sp|Q9LMJ3|GDL1_ARATH |
| GDL11 | −2.5 | −0.6 | MA_108996g0010 | GDSL esterase/lipase At1g28650 | sp|Q3E7I6|GDL11_ARATH |
| GDL34 | 1.7 | 2.8 | MA_502586g0010 | GDSL esterase/lipase At2g04570 | sp|Q9SJB4|GDL34_ARATH |
| GDL34 | 1.0 | 2.0 | MA_127753g0010 | GDSL esterase/lipase At2g04570 | sp|Q9SJB4|GDL34_ARATH |
| GDL42 | 3.0 | 4.0 | MA_10200362g0010 | GDSL esterase/lipase At2g30310 | sp|O22927|GDL42_ARATH |
| GDL59 | −1.5 | −2.2 | MA_569398g0010 | GDSL esterase/lipase At3g53100 | sp|Q0WPI9|GDL59_ARATH |
| GDL61 | 4.3 | 4.6 | MA_9056794g0010 | GDSL esterase/lipase At4g01130 | sp|Q9M153|GDL61_ARATH |
| GDL61 | 1.4 | 2.1 | MA_7763761g0010 | GDSL esterase/lipase At4g01130 | sp|Q9M153|GDL61_ARATH |
| GDL61 | 2.4 | 2.4 | MA_10426064g000 | GDSL esterase/lipase At4g01130 | sp|Q9M153|GDL61_ARATH |
| GDL62 | −1.6 | −0.4 | MA_829166g0010 | GDSL esterase/lipase At4g10955 | sp|Q680C0|GDL62_ARATH |
| GDL62 | 1.4 | 0.8 | MA_10212g0010 | GDSL esterase/lipase At4g10955 | sp|Q680C0|GDL62_ARATH |
| GDL64 | 1.5 | 2.8 | MA_10432722g000 | GDSL esterase/lipase At4g16230 | sp|O23470|GDL64_ARATH |
| GDL66 | 1.7 | 2.2 | MA_127685g0010 | GDSL esterase/lipase At4g26790 | sp|Q8VY93|GDL66_ARATH |
| GDL71 | −2.2 | −0.8 | MA_5838g0010 | GDSL esterase/lipase At5g03610 | sp|Q9LZS7|GDL71_ARATH |
| GDL72 | 4.4 | 5.1 | MA_152453g0010 | GDSL esterase/lipase At5g03810 | sp|Q9FFN0|GDL72_ARATH |
| GDL73 | 1.0 | 1.6 | MA_429323g0010 | GDSL esterase/lipase At5g03820 | sp|Q9LZC5|GDL73_ARATH |
| GDL73 | 5.8 | 6.1 | MA_101465g0010 | GDSL esterase/lipase At5g03820 | sp|Q9LZC5|GDL73_ARATH |
| GDL78 | 2.4 | 3.6 | MA_95656g0010 | GDSL esterase/lipase At5g22810 | sp|Q9FFC6|GDL78_ARATH |
| GDL79 | 1.3 | 1.7 | MA_10426867g000 | GDSL esterase/lipase At5g33370 | sp|Q8LB81|GDL79_ARATH |
| GDL79 | 1.5 | 2.2 | MA_65830g0010 | GDSL esterase/lipase At5g33370 | sp|Q8LB81|GDL79_ARATH |
| LOX1 | −1.6 | −1.4 | MA_6186g0010 | Linoleate 9S-lipoxygenase 1 | sp|Q76I22|LOX1_ORYSJ |
| LOX5 | −1.5 | −3.1 | MA_10436100g000 | Linoleate 9S-lipoxygenase 5, chloroplastic | sp|Q9LUW0|LOX5_ARATH |
| LACS2 | 1.1 | 2.1 | MA_113173g0010 | Long chain acyl-CoA synthetase 2 | sp|Q9XIA9|LACS2_ARATH |
| LACS4 | 2.4 | 3.0 | MA_10432761g000 | Long chain acyl-CoA synthetase 4 | sp|Q9T0A0|LACS4_ARATH |
| LACS5 | 2.3 | 3.0 | MA_839621g0010 | Long chain acyl-CoA synthetase 5 | sp|Q9T009|LACS5_ARATH |
| WAXS1 | −0.8 | −2.3 | MA_185166g0020 | Long-chain-alcohol O-fatty-acyltransferase | sp|Q9XGY6|WAXS1_SIMCH |
| HHT1 | −1.1 | 1.7 | MA_7233g0010 | Omega-hydroxypalmitate O-feruloyl transferase | sp|Q94CD1|HHT1_ARATH |
| HHT1 | 1.4 | 2.7 | MA_56269g0010 | Omega-hydroxypalmitate O-feruloyl transferase | sp|Q94CD1|HHT1_ARATH |
| FATB | 1.7 | 1.5 | MA_10197220g0010 | Palmitoyl-acyl carrier protein thioesterase, chloroplastic | sp|Q39513|FATB_CUPHO |
| AIM1 | −1.2 | −1.5 | MA_17817g0010 | Peroxisomal fatty acid beta-oxidation multifunctional protein | sp|Q9ZPI6|AIM1_ARATH |
| MFP | −1.1 | −1.4 | MA_92062g0010 | Peroxisomal fatty acid beta-oxidation multifunctional protein | sp|Q8W1L6|MFP_ORYSJ |
| SDR1 | −1.7 | −0.6 | MA_8431623g000 | Short-chain type dehydrogenase/reductase | sp|Q08632|SDR1_PICAB |
| HACD | 1.8 | 2.9 | MA_57869g0010 | Very-long-chain (3R)-3-hydroxyacyl-CoA dehydratase 2 | sp|Q8VZB2|HACD_ARAH |
| HACD | 1.6 | 2.6 | MA_125121g0010 | Very-long-chain (3R)-3-hydroxyacyl-CoA dehydratase 2 | sp|Q8VZB2|HACD_ARAH |
| ADH3 | 1.2 | 1.9 | MA_30381g0010 | Alcohol dehydrogenase 3 | sp|P14675|ADH3_SOLTU |
| ADH | 1.3 | 1.8 | MA_10430026g0010 | Alcohol dehydrogenase | sp|P48977|ADH_MALDO |
| ADHL3 | 2.1 | 2.8 | MA_173093g0010 | Alcohol dehydrogenase-like 3 | sp|A1L4Y2|ADHL3_ARATH |
| ADHL3 | 2.3 | 1.0 | MA_10430588g0010 | Alcohol dehydrogenase-like 3 | sp|A1L4Y2|ADHL3_ARATH |
| ADHL4 | 2.1 | 0.2 | MA_9998439g0010 | Alcohol dehydrogenase-like 4 | sp|Q8VZ49|ADHL4_ARATH |
| ADHL6 | 1.2 | 1.7 | MA_409626g0010 | Alcohol dehydrogenase-like 6 | sp|Q8LEB2|ADHL6_ARATH |
| AL2B7 | 1.9 | 1.8 | MA_10436762g0010 | Aldehyde dehydrogenase family 2 member B7 | sp|Q8S528|AL2B7_ARATH |
| AL3F1 | 1.0 | 1.8 | MA_10014137g0010 | Aldehyde dehydrogenase family 3 member F1 | sp|Q70E96|AL3F1_ARATH |
| AL3F1 | 1.2 | 2.1 | MA_97566g0010 | Aldehyde dehydrogenase family 3 member F1 | sp|Q70E96|AL3F1_ARATH |
| Flavonoids | |||||
| PALY | −0.4 | −1.0 | MA_10429279g0010 | Phenylalanine ammonia-lyase | sp|Q42667|PALY_CITLI |
| TCMO | −1.7 | −2.2 | MA_202753g0010 | Trans-cinnamate 4-monooxygenase | sp|P48522|TCMO_CATRO |
| TCMO | −1.6 | −1.8 | MA_130482g0010 | Trans-cinnamate 4-monooxygenase | sp|Q96423|TCMO_GLYEC |
| TCMO | 2.4 | 0.7 | MA_10435536g0010 | Trans-cinnamate 4-monooxygenase | sp|Q43054|TCMO_POPKI |
| COMT1 | −0.5 | −1.2 | MA_15892g0020 | Caffeic acid 3-O-methyltransferase | sp|Q8W013|COMT1_CATRO |
| COMT1 | −0.5 | −1.0 | MA_15892g0010 | Caffeic acid 3-O-methyltransferase | sp|Q43239|COMT1_ZINVI |
| CAMT | 1.3 | 1.7 | MA_9065834g0010 | Caffeoyl-CoA O-methyltransferase | sp|O04854|CAMT_EUCGU |
| CAMT | −1.1 | 0.1 | MA_4674g0010 | Caffeoyl-CoA O-methyltransferase | sp|Q41720|CAMT_ZINVI |
| CSE | 1.2 | 2.6 | MA_93032g0010 | Caffeoylshikimate esterase | sp|Q9C942|CSE_ARATH |
| CSE | −0.4 | −2.3 | MA_38618g0020 | Caffeoylshikimate esterase | sp|Q9C942|CSE_ARATH |
| CHSY | −1.0 | −1.8 | MA_401848g0010 | Chalcone synthase | sp|O65872|CHSY_PINST |
| F3′H | 5.1 | 5.0 | MA_10434848g0010 | Flavonoid 3′-monooxygenase | sp|Q9SD85|F3′H_ARATH |
| F3′H | −0.1 | 2.0 | MA_76780g0010 | Flavonoid 3′-monooxygenase | sp|Q9SBQ9|F3′H_PETHY |
| F3′H | −1.3 | −1.4 | MA_10430254g0010 | Flavonoid 3′-monooxygenase | sp|Q9SD85|F3′H_ARATH |
| F3′H | −1.5 | −5.5 | MA_252610g0010 | Flavonoid 3′-monooxygenase | sp|Q9SBQ9|F3′H_PETHY |
| F3′5′H | −4.0 | −1.4 | MA_281597g0010 | Flavonoid 3′,5′-hydroxylase | sp|Q96418|F3′5′H_EUSER |
| F3′5′H | −0.3 | 1.9 | MA_633198g0010 | Flavonoid 3′,5′-hydroxylase | sp|P37120|F3′5′H_SOLME |
| DFRA | 0.0 | −2.3 | MA_6840966g0010 | Dihydroflavonol-4-reductase | sp|P51104|DFRA_DIACA |
| DFRA | 1.5 | 1.8 | MA_10430209g0020 | Dihydroflavonol-4-reductase | sp|P51105|DFRA_GERHY |
| DFRA | 1.3 | 1.8 | MA_23704g0010 | Dihydroflavonol-4-reductase | sp|P51105|DFRA_GERHY |
| DFRA | 2.5 | 3.4 | MA_10433570g0010 | Dihydroflavonol-4-reductase | sp|P51105|DFRA_GERHY |
| DFRA | −1.7 | −1.2 | MA_10432784g0010 | Dihydroflavonol-4-reductase | sp|P51106|DFRA_HORVU |
| DFRA | 0.0 | −1.2 | MA_10432862g0010 | Dihydroflavonol-4-reductase | sp|P51106|DFRA_HORVU |
| FLS | −0.8 | −2.1 | MA_10431216g0010 | Flavonol synthase/flavanone 3-hydroxylase | sp|Q9M547|FLS_EUSER |
| LDOX | −2.3 | 0.7 | MA_4447g0010 | Leucoanthocyanidin dioxygenase | sp|P51091|LDOX_MALDO |
| 5GT1 | −0.9 | −1.4 | MA_5871698g0010 | Anthocyanidin 3-O-glucoside 5-O-glucosyltransferase 1 | sp|Q9ZR27|5GT1_PERFR |
| UFGT | 2.1 | 3.2 | MA_477384g0010 | Anthocyanidin 3-O-glucosyltransferase | sp|Q43716|UFGT_PETHY |
| ANR | 0.5 | 2.1 | MA_927736g0010 | Anthocyanidin reductase | sp|Q9SEV0|ANR_ARATH |
| ANR | −0.5 | −1.5 | MA_6784553g0010 | Anthocyanidin reductase | sp|Q9SEV0|ANR_ARATH |
Table 3.
DEGs involved in nitrogen metabolism.
| Gene | Log2(2900/2500) | Log2(3300/2500) | Gene ID | Annotation | Accession |
|---|---|---|---|---|---|
| Nitrogen Assimilation | |||||
| NR | −0.5 | −2.1 | MA_2389043g0010 | Nitrate reductase | sp|P27969|NR_HORVU |
| NR | −0.8 | −1.6 | MA_10432360g0020 | Nitrate reductase [NADH] (Fragment) | sp|P43101|NR_CICIN |
| NR | −1.0 | −1.0 | MA_10432360g0010 | Nitrate reductase [NADH] | sp|P17569|NR_CUCM |
| NIR | −1.6 | −3.4 | MA_22510g0010 | Ferredoxin--nitrite reductase, chloroplastic | sp|Q39161|NIR_ARATH |
| NRT1 | -0.7 | −1.5 | MA_4273216g0010 | Protein NRT1/ PTR FAMILY 2.13 | sp|Q8RX77|PTR21_ARATH |
| NRT1 | −0.5 | −2.0 | MA_167141g0010 | Protein NRT1/ PTR FAMILY 2.13 | sp|Q9SX20|PTR18_ARATH |
| NRT1 | −0.2 | 1.2 | MA_122722g0010 | Protein NRT1/ PTR FAMILY 3.1 | sp|Q9SX20|PTR18_ARATH |
| AMT31 | 1.4 | 0.7 | MA_55379g0010 | Ammonium transporter 3 member 1 | sp|Q84KJ6|AMT31_ORYSJ |
| Amino Acid Metabolism | |||||
| GLMS | 0.8 | −1.2 | MA_46900g0010 | Glutamine--fructose-6-phosphate aminotransferase | sp|Q8AAB1|GLMS_BACTN |
| METE | −1.1 | −1.1 | MA_10436788g0010 | 5-methyltetrahydropteroyltriglutamate--homocysteine methyltransferase | sp|Q42662|METE_PLESU |
| ARGI1 | 0.4 | 1.6 | MA_10426056g0010 | Arginase 1, mitochondrial | sp|P46637|ARGI1_ARATH |
| ARGI1 | 0.8 | 1.8 | MA_10435722g0010 | Arginase 1, mitochondrial | sp|B8AU84|ARGI1_ORYSI |
| AROD2 | −1.5 | −2.0 | MA_864553g0010 | Arginase 1, mitochondria6 | sp|Q9SSE7|AROD2_ARATH |
| AROD6 | −1.9 | −2.9 | MA_43667g0010 | Arogenate dehydratase/prephenate dehydratase 6, | sp|Q9SGD6|AROD6_ARATH |
| AAT5 | −0.8 | −2.0 | MA_17674g0010 | Aspartate aminotransferase 5, chloroplastic | sp|P46248|AAT5_ARATH |
| GAD | 1.4 | 0.7 | MA_89828g0010 | Glutamate decarboxylase | sp|Q07346|GAD_PETHY |
| HMT1 | −0.2 | −0.7 | MA_7286g0010 | Homocysteine S-methyltransferase 1 | sp|Q9SDL7|HMT1_ARATH |
| CAS1 | −1.1 | −1.4 | MA_6291g0010 | L-3-cyanoalanine synthase 1, mitochondrial | sp|Q1KLZ2|CAS1_MALDO |
| PALY | −0.4 | −1.0 | MA_10429279g0010 | Phenylalanine ammonia-lyase | sp|Q42667|PALY_CITLI |
| AROF | −0.3 | −1.2 | MA_10437122g0020 | Phospho-2-dehydro-3-deoxyheptonate aldolase 1 | sp|P27608|AROF_TOBAC |
| AROF | −0.8 | −1.4 | MA_10142969g0010 | Phospho-2-dehydro-3-deoxyheptonate aldolase 1 | sp|P21357|AROF_SOLTU |
| AROF | −1.0 | −1.2 | MA_10436001g0020 | Phospho-2-dehydro-3-deoxyheptonate aldolase 1 | sp|P21357|AROF_SOLTU |
| SDC1 | 1.3 | 1.5 | MA_39829g0020 | Serine decarboxylase 1 | sp|Q6ESZ9|SDC1_ORYSJ |
| GLYM1 | −0.6 | −1.2 | MA_7027365g0010 | Serine hydroxymethyl transferase 1, mitochondrial | sp|Q9SZJ5|GLYM1_ARATH |
| GLYM | −0.6 | −1.3 | MA_905984g0010 | Serine hydroxymethyltransferase, mitochondrial | sp|P34899|GLYM_PEA |
| SPD1 | 2.5 | 2.4 | MA_136411g0010 | Spermidine synthase 1 | sp|Q96556|SPD1_DATST |
© 2020 by the authors. Licensee MDPI, Basel, Switzerland. This article is an open access article distributed under the terms and conditions of the Creative Commons Attribution (CC BY) license (http://creativecommons.org/licenses/by/4.0/).
Share and Cite
MDPI and ACS Style
Shi, Z.; Deng, X.; Bai, D.; Lei, J.; Li, M.; Zeng, L.; Xiao, W. Transcriptomic Analysis Reveals the Mechanism of Picea crassifolia Survival for Alpine Treeline Condition. Forests 2020, 11, 156. https://doi.org/10.3390/f11020156
AMA Style
Shi Z, Deng X, Bai D, Lei J, Li M, Zeng L, Xiao W. Transcriptomic Analysis Reveals the Mechanism of Picea crassifolia Survival for Alpine Treeline Condition. Forests. 2020; 11(2):156. https://doi.org/10.3390/f11020156
Chicago/Turabian StyleShi, Zheng, Xiuxiu Deng, Dengzhong Bai, Jingpin Lei, Maihe Li, Lixiong Zeng, and Wenfa Xiao. 2020. "Transcriptomic Analysis Reveals the Mechanism of Picea crassifolia Survival for Alpine Treeline Condition" Forests 11, no. 2: 156. https://doi.org/10.3390/f11020156
Note that from the first issue of 2016, this journal uses article numbers instead of page numbers. See further details here.