
Opposite Tree-Tree Interactions Jointly Drive the Natural Fir Treeline Population on the Southeastern Tibetan Plateau


1
College of Biology and the Environment, Nanjing Forestry University, Nanjing 210037, China
2
College of Life Sciences, Anhui Normal University, Wuhu 241000, China
3
State Key Laboratory of Tibetan Plateau Earth System, Resources and Environment (TPESRE), Institute of Tibetan Plateau Research, Chinese Academy of Sciences, Beijing 100101, China
4
Institute of Fundamental Research and Studies, Kathmandu 44600, Nepal
*
Author to whom correspondence should be addressed.
Forests 2021, 12(10), 1417; https://doi.org/10.3390/f12101417
Submission received: 9 September 2021
/
Revised: 9 October 2021
/
Accepted: 13 October 2021
/
Published: 18 October 2021
(This article belongs to the Special Issue Alpine Treeline Dynamics in the Anthropocene)
Abstract
:The long-term stability of alpine treeline positions and increased stem density are frequently reported by recent studies; however, whether a denser treeline forest is relevant to competitive tree–tree interactions remain unclear. Herein, we mapped and surveyed individual trees in two undisturbed Smith fir (Abies georgei var. smithii) treeline plots (with a size: 30 m × 200 m; plot NE1: 4477 m, NE2: 4451 m) near Ranwu Lake (RW) on the southeastern Tibetan Plateau. The surface pattern method and spatial point pattern analysis were used to detect the spatial distribution patterns of three size classes (seedlings, juveniles, adults) and spatial associations between the pairwise size classes. We also compared our results to the spatial patterns of the five other treeline forests (Deqin, Linzhi, Changdu, Yushu, Aba) reported from the Tibetan Plateau. Young trees dominated the two fir treeline plots. Both positive and negative spatial autocorrelations for all of the trees were detected in two study plots. Intraspecific facilitation and competition coexisted at the fir treelines in three forest regions (RW, Linzhi, Aba) characterized by a mild moist climate, whereas intraspecific facilitation dominated the other three forest regions (Changdu, Deqin, Yushu), which featured seasonal climatic stress or high disturbance pressure. Thus, increased stem density at alpine treeline can be linked to competitive interactions in relatively favorable environmental conditions. Overall, the spatial patterns of the treeline population are mainly shaped by the combination of thermal and moisture conditions and are also modulated by non-climatic variables (e.g., disturbance history and microtopography).
1. Introduction
The spatial patterns of trees provide valuable clues for revealing the linkages between forest dynamics and their underlying ecological processes [1]. It has been found that the spatial configurations of adult trees have a vital role in creating microenvironments and driving the growth and recruitment processes at treeline ecotones [2,3]. However, studies have shown that the earlier rather than later life stages of trees are the key determinants of treeline dynamics in response to climate change [4,5]. Thus, the spatial patterns established by young trees are likely to be governed by both abiotic and biotic factors (e.g., climate and plant–plant interactions) [6,7,8], which largely mediate the sensitivity of the treeline to climate change [9]. Given the aforementioned background, exploring the spatial patterns of the different life stages of trees contributes to a holistic understanding of the key ecological processes that are responsible for observed treeline structures and functions [10].
At a global scale, treeline positions are closely coupled to the mean growing-season temperature of 6–7 °C [11,12,13,14], thus, climate warming might lead to the northward or upward advance of treelines [15,16]. However, ubiquitous treeline advance has not been detected under the warming background in the last century, with the global mean advance rate of treeline position lagging far behind the warming velocity [17]. By contrast, the warming-induced tree densification of the treeline ecotone has been found in Europe, North America, and Asia when the moisture conditions are not limiting [10,18,19,20,21]. Such a mismatch between the two ecological processes (increasing tree recruitment vs. slow upward advances of treeline position) at treeline ecotones could lead to intraspecific interactions [5,9,22,23], even though microsite facilitation from neighboring plants is generally considered to be one of the major drivers of structuring population dynamics in stressful environments such as in alpine treelines [7,24,25]. Thus, both facilitative and competitive interactions among trees might coexist in slowly advancing treelines.
The Tibetan Plateau possesses the world’s highest natural treelines in the northern hemisphere [26], making it an ideal place for the investigation of ecological patterns and underlying processes within the treeline ecotones. It has been found that the altitudinal position of fir treelines near Ranwu Lake on the southeastern Tibetan Plateau has shown little change over the past century but that the fir population has shown a tendency to become denser in past decades [27]. Thus, the fir treeline near Ranwu Lake can be used to test whether distinct tree–tree interactions are important agents that are shaping the alpine treeline population. In addition, previous studies have explored the spatial tree patterns of treeline ecotones in several forest regions on the Tibetan Plateau [2,10,28,29,30,31,32]. Recognizing that the recurrent patterns at the treeline ecotone contribute to guiding large-scale applicable hypotheses about the key variables and processes determining treeline dynamics [33]. Owing to the lack of comparative analysis, however, surprisingly little information is available regarding whether consistent spatial tree patterns prevail in the treeline ecotones across the Tibetan Plateau.
We aimed to characterize the spatial distribution patterns of trees and spatial associations between the tree classes of two fir treeline plots near Ranwu Lake on the southeastern Tibetan Plateau (1) and to compare the tree spatial patterns near Ranwu Lake to those of other treeline forest regions on the Tibetan Plateau (2). Given the reasons mentioned above, we hypothesized that both facilitation and competition were the key drivers of the fir treeline populations near Ranwu Lake on the southeastern Tibetan Plateau. Considering the microsite heterogeneity across the treeline ecotone, we also hypothesized that the spatial tree patterns within the treeline ecotone may differ among the different forest regions on the Tibetan Plateau.
2. Material and Methods
2.1. Study Area and Climate
The study area is located near Ranwu Lake on the southeastern Tibetan Plateau (hereafter TP) (Figure 1). Due to the effects of Indian monsoons, the southeastern TP is dominated by a sub-humid climate. Based on CRU-gridded data (CRU TS 4.04, 0.5° spatial resolution) [34], the mean annual precipitation (1901–2020) in the study area is 718.63 mm, 59.4% of which falls during the summer season. January (mean temperature: −7.36 °C) and July (7.94 °C) are the coldest and warmest months, respectively. Tree-ring-based summer temperature reconstruction on the southeastern TP showed a significant warming trend over the past century [35].
2.2. Tree Species and Field Sampling
Abies georgei var. smithii (Smith fir hereafter) is a coniferous tree species that usually grows above 3800 m a.s.l. on the southeastern TP [36]. The elevational range of diffuse Smith fir treelines varies from 4400 m to 4500 m, owing to different topographic regimes. Across the treeline ecotone, mature Smith fir trees can reach heights of approximately 10 m. No evidence of human disturbance was found across the fir treeline ecotones studied here, resulting from the presence of obstacles such as difficult lake crossings.
Two Smith fir treeline plots (30 m × 200 m) on the northeast facing slopes (NE1: 4477 m, mean slope: 30.5°; NE2: 4451 m, mean slope: 33°) near Ranwu Lake in the southeastern TP were surveyed and mapped (Figure 2) using dendroecological methods [19,37]. Two treeline plots were established in relatively uniform terrain and included the current treeline and timberline. The origin of the plot (0, 0) was located in the lower left corner facing the upslope. The following variables were measured for each tree inside of the plot: location (x, y) of the tree’s centre, tree height, diameter at breast height (DBH), and the crown projection along the x and y directions of the plot. One radial core was sampled at the stem base if the tree height was ≥2.5 m so that the germination ages of mature and young trees (height ≥ 2.5 m) could be determined. When the pith was absent in the core, a pith geometric locator was applied to calculate the missing distance up to the stem centre [38]. The ages of trees with heights < 2.5 m were visually determined in a non-destructive way by counting the successive bud scars or internodes along the main stem [19]. According to a previous treeline study, this method (bud counting) can potentially underestimate the true age by up to 5 years [27]. Based on these methods, the age structure of the treeline populations was reconstructed.
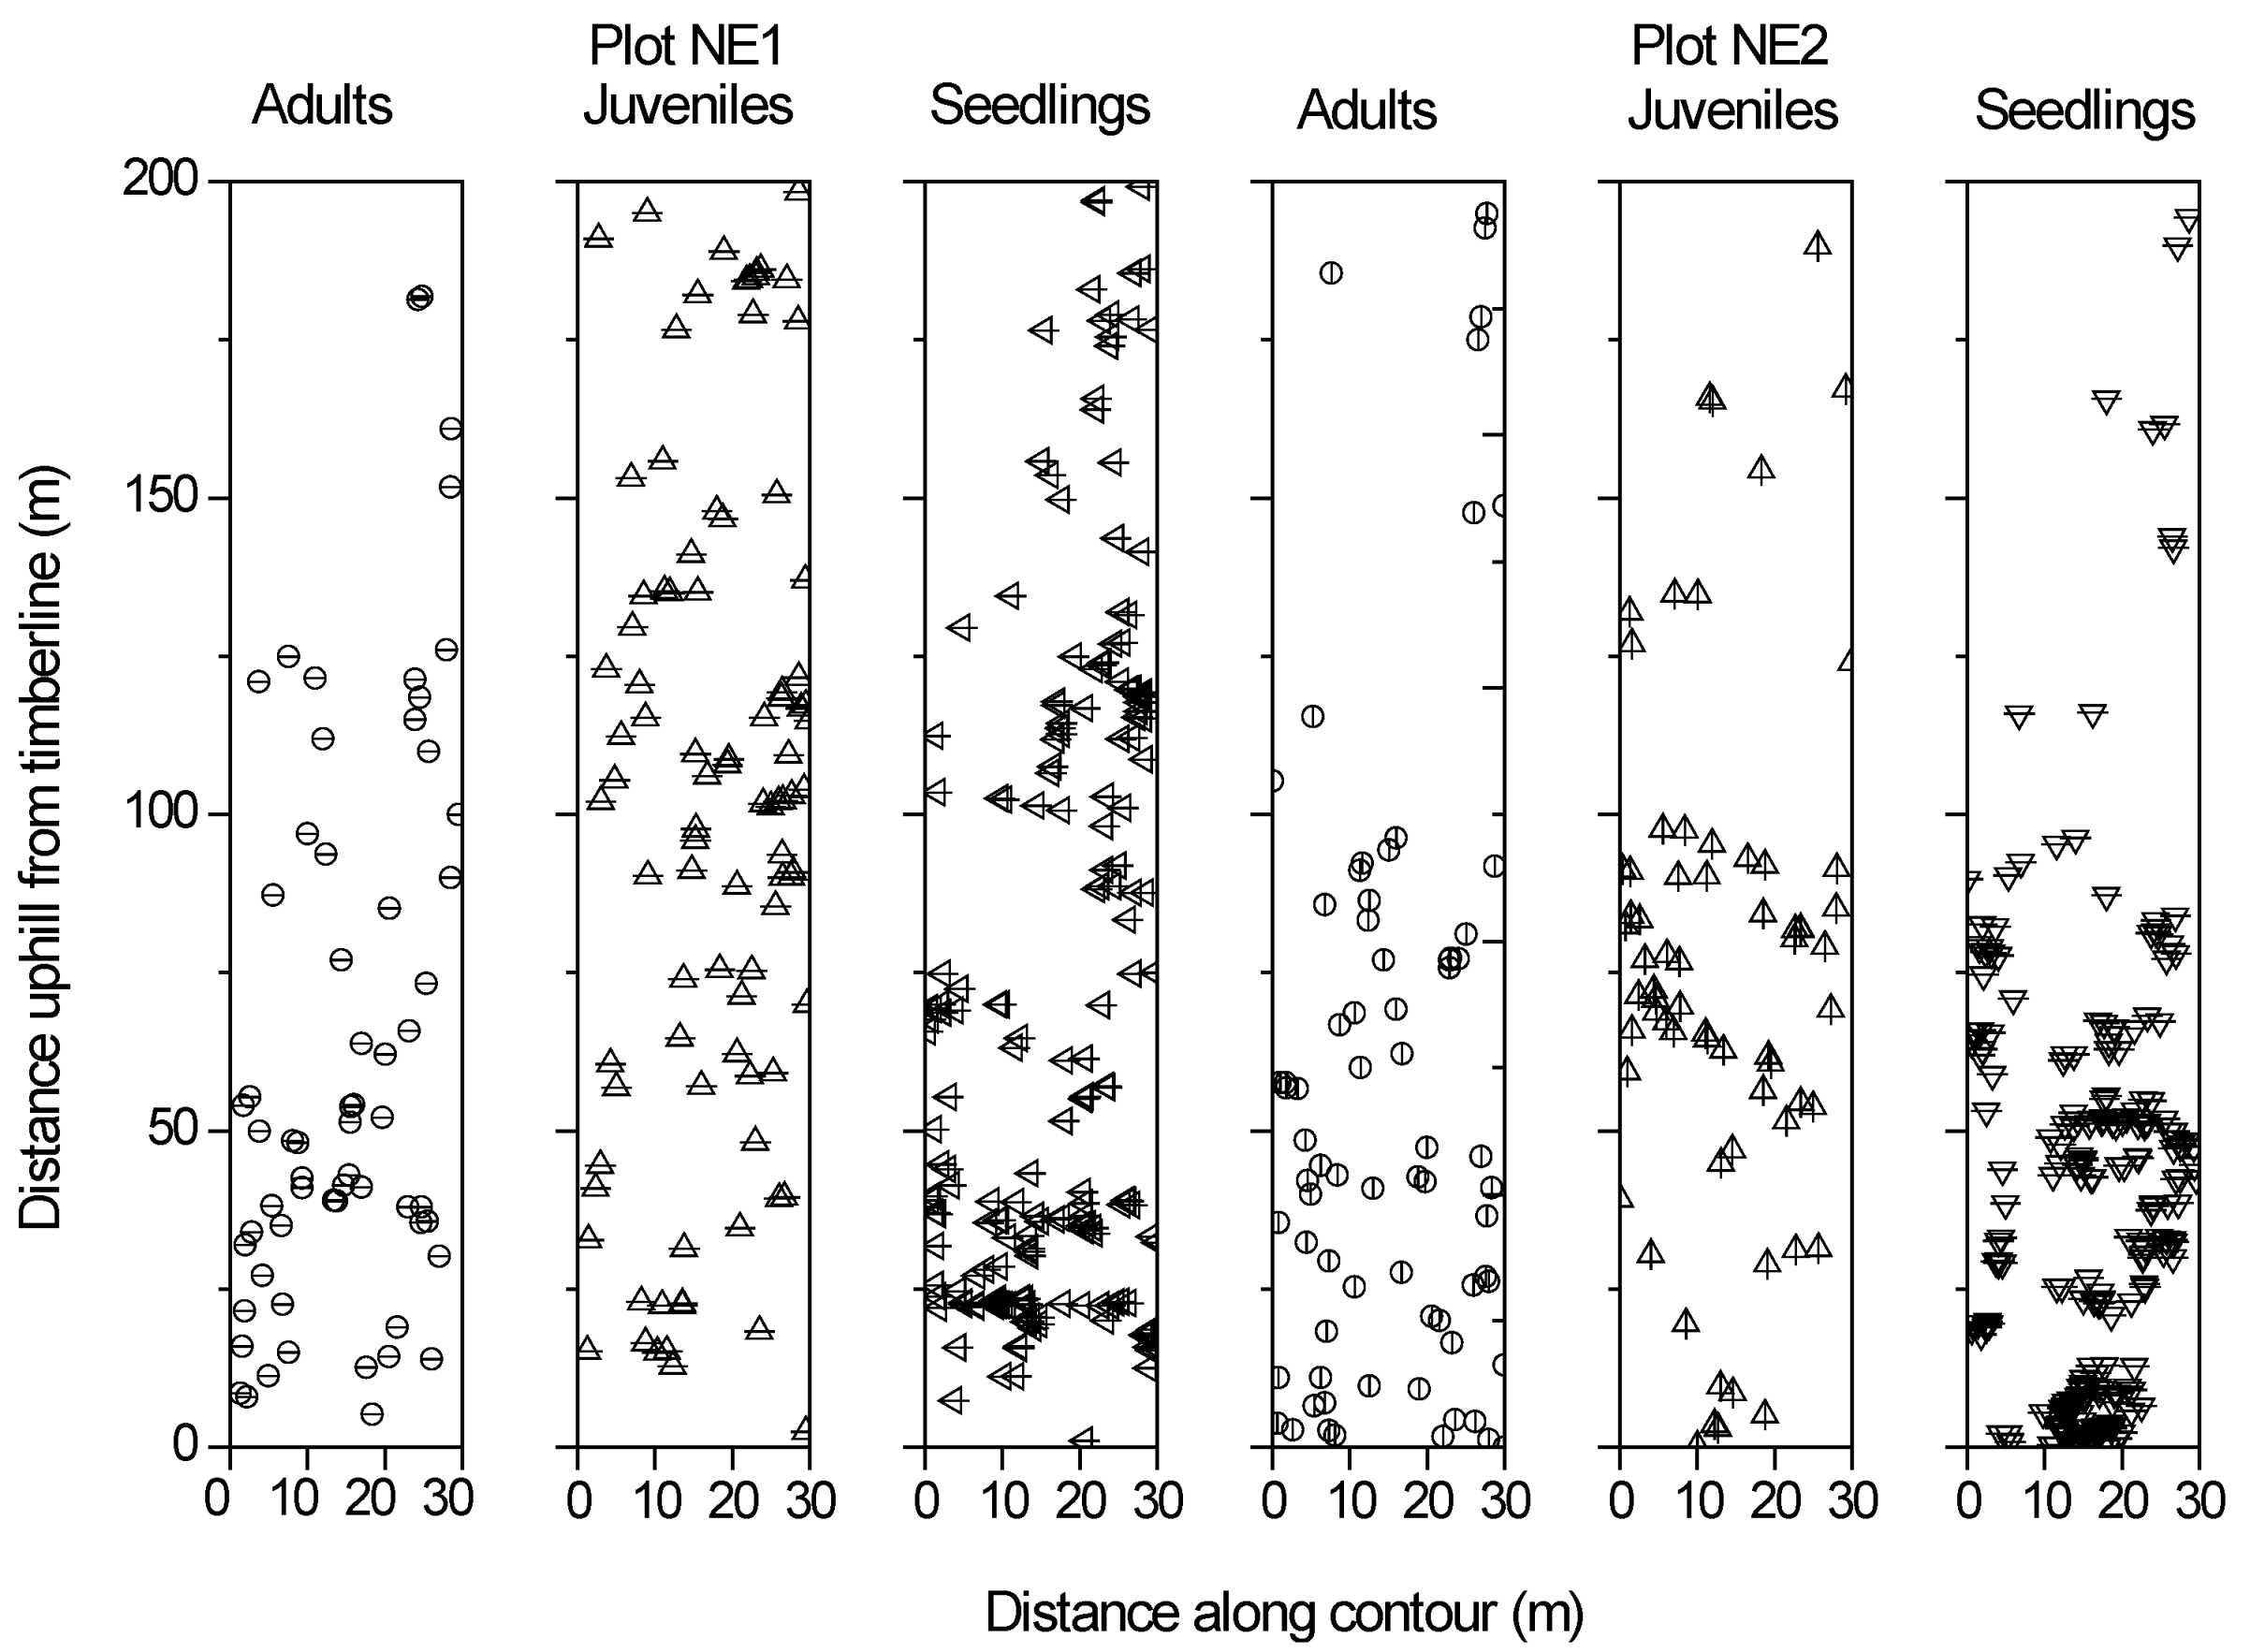
Following previous treeline studies [29], Smith fir populations were divided into three categories based on their height: seedlings ≤ 50 cm; juvenile > 50 cm to ≤2.5 m, adult > 2.5 m (Figure 2). No dead trees were detected during the plot investigation. We did not find krummholz individuals across the two Smith fir treeline plots.
2.3. Data Analysis
2.3.1. Analysis of Population Traits
The relationships between the DBH and the height of trees were calculated for the two treeline plots. We also computed the associations between the DBH and crown diameter of the trees for each plot. The size and age structure of the Smith fir population were fitted using linear or nonlinear regression equations. Based on the Cartesian coordinates, y values along the longer side of treeline plot (see Figure 2) varying from 0 to 200 m were used to denote the changes in the treeline elevation. Tree age was related to elevation (y value) along the y-axis of the treeline plot. The percentage of the number of trees at each 10 m interval (e.g., 0–10 m) in the whole treeline plot was calculated for both plots, so the frequency histogram of trees at each 10 m interval was used to explore the frequency–elevation relationships.
2.3.2. Surface Pattern Analysis
A surface pattern method (e.g., Moran’s I) was used to explore the surface patterns of different size classes of trees across the treeline ecotone [39]. Spatial autocorrelation coefficients of Moran’s I varied from −1 to +1, with 0 denoting the absence of spatial autocorrelation [40]. The spatial correlogram based on Moran’s I shows how the tree trait variables (e.g., height) changes as a function of distance along with the different directions (e.g., xy-direction). In this study, the spatial correlogram for the height of tree classes (seedlings, juveniles, and adults) was made using the calculated Moran’s I values at distances of 1–30 m. Significant spatial autocorrelation occurs when the p value of Moran I is less than 0.05. The surface pattern analysis was performed using the free SAM software (https://www.ecoevol.ufg.br/sam/sam.php, accessed on 16 April 2021).
2.3.3. Spatial Point Pattern Analysis
Spatial point pattern analysis is frequently employed to reveal the spatial patterns of trees across the treeline ecotone [6,7,29,41]. In this study, the heterogeneous version of O(r) statistic was used to analyze the spatial patterns of tree individuals within two treeline plots. The univariate O11(r) statistic was used to characterize the spatial distribution patterns of the different size classes, while the bivariate O12(r) statistic was employed to describe the spatial associations between different size classes. Upper and lower confidence limits of p = 0.05 were calculated using 999 Monte Carlo simulations of the point process. Following previous treeline studies [10], we hypothesized that asymmetric tree–tree interactions drove the treeline population, so the higher trees (e.g., adults) would inhibit or facilitate young trees (e.g., seedlings), but not vice versa. Both the univariate and bivariate statistics were performed using the Programita software [41].
2.3.4. Comparative Analysis
To examine whether similar tree spatial patterns existed in different treelines on the TP or not, we compared our results with the results from the previous treeline studies on the TP [2,28,29,30,31,32]. Previous treeline studies included two forest regions (LZ, DQ,) of the southeastern TP and three forest regions (CD, YS, AB) of the eastern TP [2,28,29,30,31,32]. LZ has dense undisturbed Smith fir treelines that are driven by a moist mild climate [13,27], while the fir (Abies georgei) and juniper (Juniperus saltuaria) treelines in DQ were mainly driven by cold winter temperatures [42]. Similarly, the spruce (Picea likiangensis (Franch) Pritz var. balfouriana) treelines in CD were strongly affected by seasonal drought stress [2]. In YS, the spruce treelines were subject to long-term disturbance pressure, with human disturbances mediating the treeline dynamics [30]. In AB, dense undisturbed fir (Abies faxoniana) treelines were also associated with a moist mild climate that is similar to the climate in LZ [28]. Combining the treeline used in our study, five tree species forming the treeline and different slope aspects (shady- and sunny-slope) were included; thus, the comparative analysis contributes to a better understanding of spatial patterns of trees within the treeline ecotone on the TP.
3. Results
3.1. Trait Relationships and Population Structure
The DBH and crown diameter or height of the trees exhibited the significant exponential relationships within the two treeline plots (p < 0.0001 in these four cases; Figure 3a–d). The multimodal distributions of the DBH classes were fitted significantly by the power function in the two plots (p < 0.01 in both plots; Figure 4a,b). The distributions of tree-age classes for the two plots were well fitted by the negative exponential functions (p < 0.0001 in both plots; Figure 4c,d).
3.2. Relationships between Tree Age and Altitude
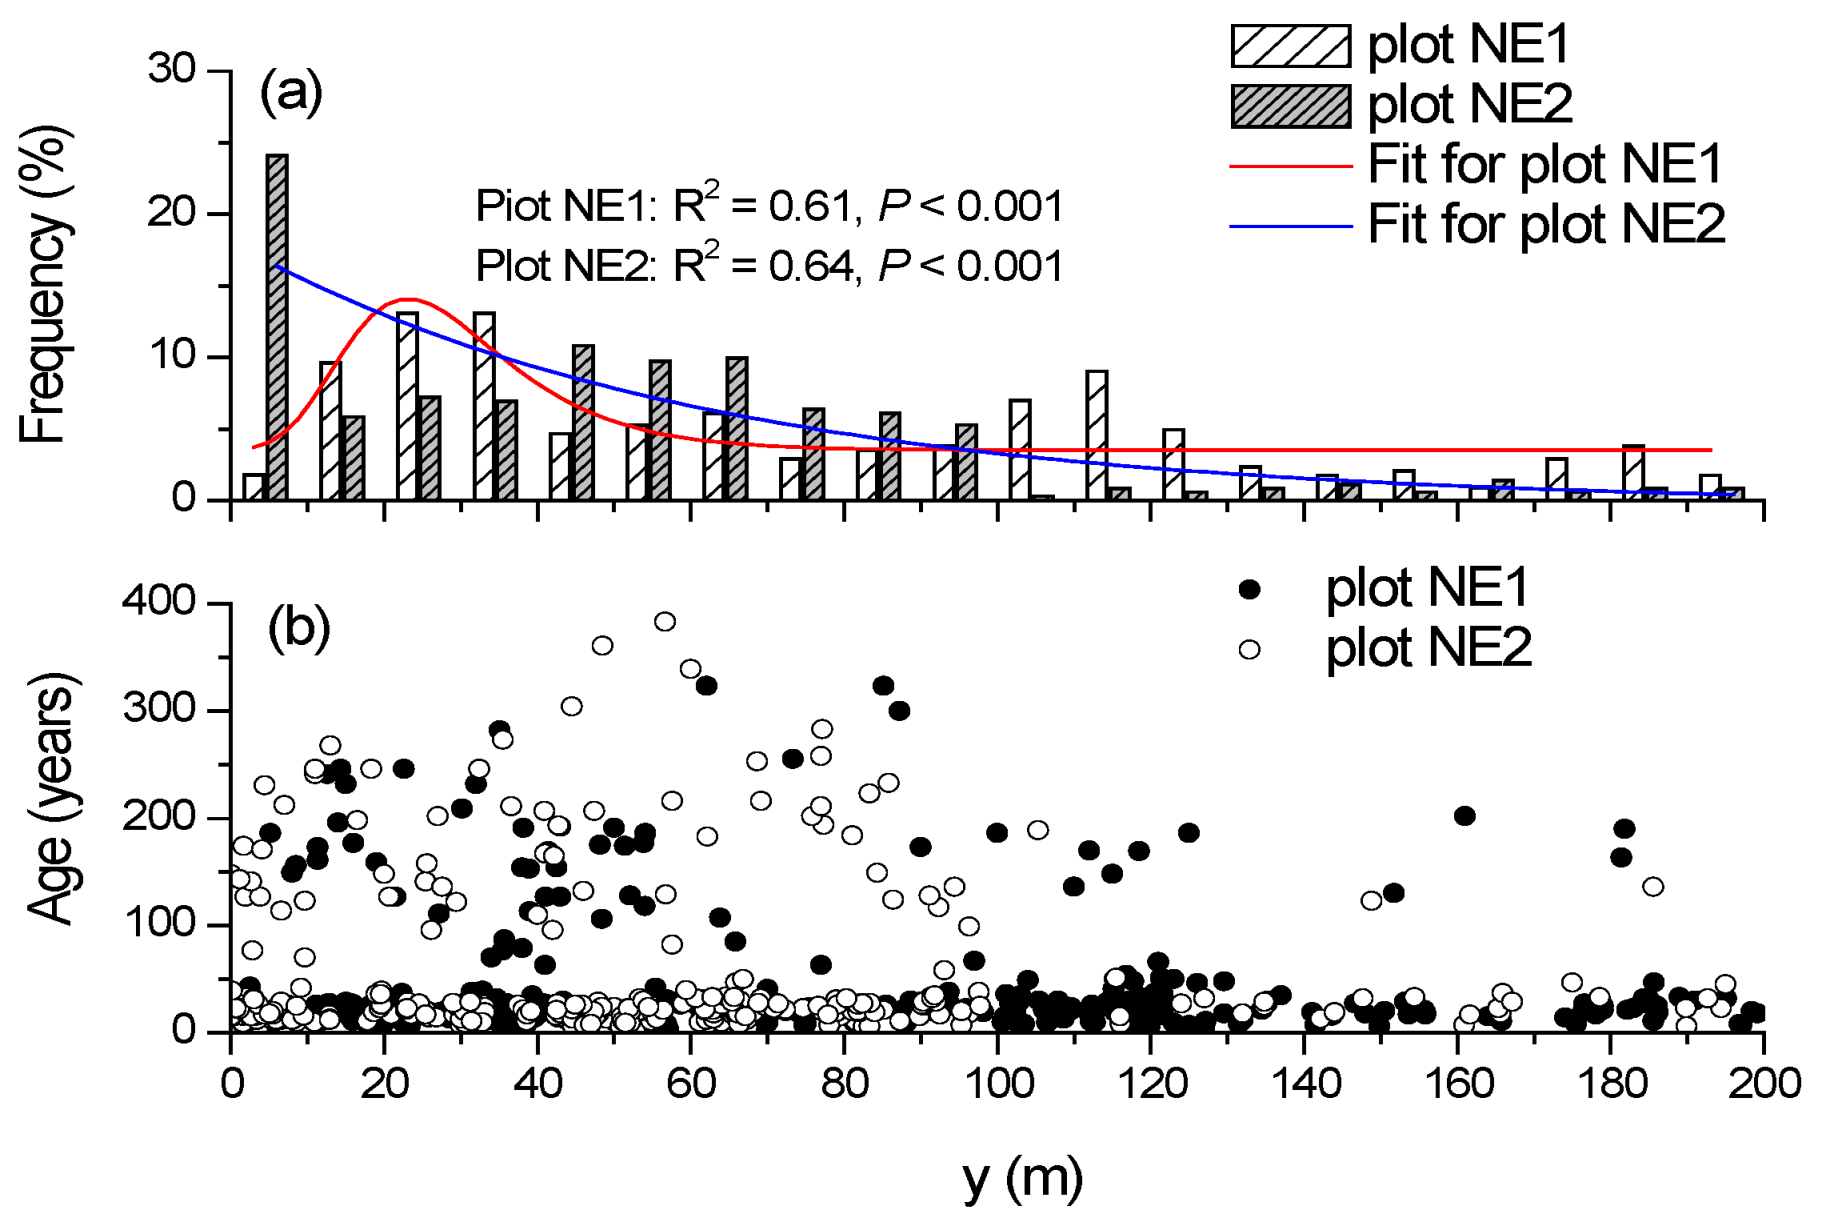
The distribution pattern of the frequency of trees along the altitude differed between the two plots (Figure 5a). In NE1, the frequency–altitude relationships followed the left-skewed distribution with the peak occurring at 30 m in the y-axis (p < 0.001). The tree frequency decreased with the increasing altitude in NE2, and the frequency–altitude relationships were fitted well by the negative exponential function (p < 0.001). However, tree age was unrelated to altitude (p > 0.05) in both plots (Figure 5b).
3.3. Spatial Autocorrelation of Trees
Significant autocorrelations for three size classes in plot NE1 appeared at limited scales (e.g., positive for seedlings: scale = 1 m, 3 m, p < 0.05; Figure 6a–c). Significant autocorrelations for three size classes in plot NE2 also occurred at limited scales (e.g., seedlings: positive at 11 m, 12 m, and 23 m but negative at 5 m and 18 m; Figure 6d–f). Both positive and negative spatial autocorrelations for all of the individual trees were detected for both plots (Figure 6g,h). Spatial autocorrelations for all of the individual trees tended to shift from positive to negative at a scale of 1–30 m, with a negative linear trend emerging in both plots (p < 0.05) (Figure 6g,h).
3.4. Spatial Distribution Patterns of Tree Size Classes
In plot NE1, the adult trees showed random distribution at scales up to 15 m (Figure 2 and Figure 7a), while the juveniles and seedlings exhibited aggregation at scales of up to 2 m and 5 m, respectively (Figure 2 and Figure 7b,c). In plot NE2, the adults were randomly distributed at scales of up to 15 m (Figure 2 and Figure 7d), while the juveniles and seedlings showed clumped distributions at scales of 1–2 m and 1–7 m, respectively (Figure 2 and Figure 7e,f). Note that the seedlings within plot NE2 exhibited random distribution at distances of 8–9 m and regular distributions at distances of 10–15 m (Figure 2 and Figure 7f).
3.5. Spatial Associations between Different Tree Size Classes
In plot NE1, adults and juveniles were negatively spatially correlated at scales of 8–9 m, 12 m, and 14 m (Figure 8a), while adults and seedlings were spatially negatively correlated at distances of 1–2 m and 10 m (Figure 8b). However, juveniles and seedlings were spatially positively correlated at scales of 1–4 m (Figure 8c). In plot NE2, adults and juveniles showed spatially negative associations at distances of 3–4 m and 6–8 m (Figure 8d). Adults and seedlings showed spatially positive associations at distances of 7–14 m (Figure 8e). Juveniles and seedlings presented the spatially positive associations at distances of 1–4 m and spatially negative associations at distances of 7–15 m (Figure 8f).
3.6. Tree Spatial Patterns in Other Treeline Sites on the TP
The six treeline forest regions (RW, AB, YS, CD, LZ, DQ) on the TP are characterized by different environmental conditions and show heterogeneous spatial patterns of trees (Table 1). In AB, the seedlings and juveniles of the fir treelines presented clustering distributions at distances of 1–5 m and 1–2 m, respectively, whereas adults were regularly distributed at scales of 1–2 m and random distributions at scales of 3–15 m. Seedlings and juveniles were spatially positively correlated at scales of 1–5 m, while the other two pairs were spatially negatively correlated at scales of 1–6 m (seedlings vs. adults) and 1–15 m (juveniles vs. adults). In addition, seedlings and adults were spatially positively associated at scales of 8–13 m.
In YS, the seedlings showed clumped distributions at scales of 1–4 m, and the juveniles and adults showed random distribution patterns at scales of 1–15 m in the spruce treelines, while spatially positive associations were present for the two pairs (seedlings vs. juveniles: 2–6 m; seedlings vs. adults: 9–14 m).
In CD, the seedlings and juveniles at the spruce treelines showed clumped distributions at scales of 1–15 m and 2–15 m, respectively, while the adults showed random distributions at scales of 2–15 m (Table 1). Spatially positive associations between the three tree size classes appeared at scales of 1–15 m.
In LZ, seedlings and juveniles within the fir treeline plots showed aggregation at scales of 1–7 m, while adults showed random distributions at scales of 1–15 m. Two pairs (seedlings vs. adults, juveniles vs. adults) showed negative associations at scales of 1–5 m, whereas seedlings and juveniles showed positive association at scales of 1–7 m.
In DQ, tree aggregation was detected from 1–15 m at the fir treelines on shady slopes (seedlings, juveniles and adults) and at juniper treelines on sunny slopes (juveniles and adults), whereas seedlings were randomly distributed at scales of 1–15 m at the juniper treelines. Spatial associations between these three tree classes were positive, ranging from 1–15 m, at the fir and juniper treelines.
4. Discussion
4.1. Stand Structure and Tree Trait Relations
The DBH- and age-class distributions in the two fir treeline plots on the southeastern TP were well fitted using the power or negative exponential functions, suggesting that young tree individuals (seedlings and juveniles) dominated the stand structure of the treeline ecotone under a warming climate [37]. The densification of the seedlings and juveniles over recent decades was also reported from different mountains around the world, such as on the TP [10,27,37], in the Himalayas [21], in the Spanish Pyrenees [43], and in the Rocky Mountains [9]. Irrelevance between tree age and altitude suggested that individual-level tree age was not sensitive to the environmental changes associated with the altitudinal gradient of the treeline ecotone. However, the frequency of trees at the 10 m interval was significantly negatively related to altitude, implying that key environmental factors (e.g., temperature) associated with the altitude may play important roles in the distribution patterns of canopy cover at the population level for the two diffuse fir treelines. Interestingly, a recent treeline study proposed that the increased tree mortality at rising elevations generally appeared in the diffuse treeline [31]. As the climate warms, increased tree density due to reduced tree mortality and unchanged treeline position may lead to similarities in the ecological processes of the treeline ecotone and closed-canopy forests [10]. In addition, the positive linkages between DBH and tree height or crown diameter indicate that older trees would have more advantages in terms of the resource acquisition (particularly use of sunlight) associated with tree height and canopy area than young trees, thus resulting in asymmetric tree–tree interactions within the treeline ecotone [29].
4.2. Tree Spatial Patterns
In this study, the clustering of seedlings and juveniles at the small scale (≤7 m) could be indicative of intraspecific facilitation among the neighboring trees [43]. It was found that the avoidance or alleviation of low-temperature stress and associated photoinhibition was the main benefit of facilitation, thus increasing photosynthetic carbon gain and respiration-driven growth processes [25]. The facilitative interactions among young individuals are in line with other studies, as observed in treelines or other plant communities under harsh climatic conditions [7,24]. The distribution patterns of trees within the two study plots shifted from high-intensity clustering to low-intensity clustering and then to complete spatial randomness as the trees grew, indicating that self-thinning processes associated with competition could drive density-dependent mortality [44]. The regular seedling distribution in plot NE2 at scales of 10–15 m may provide an indication for the influence of competitive interactions or edaphic conditions caused by regular microtopography [22,45]. Negative spatial associations between adults and young trees suggest that intraspecific competition for light or soil resources appears to be an important factor driving the ecological patterns at treeline ecotones. Conversely, the positive spatial associations between juveniles and seedlings elucidated that juveniles can create a favorable microenvironment for seedling establishment and survival [46] and can attenuate the impacts of a harsh climate [7,29]. In addition, both positive and negative spatial autocorrelations for all of the trees were detected within two study plots, further implying that both positive and negative tree–tree interactions may exist. Therefore, our results support the first hypothesis that both facilitation and competition are the key drivers of the fir treeline population on the southeastern TP.
4.3. Comparisons with Previous Studies on the TP
Tree–tree facilitation is usually related to high climatic stress [24,47,48,49]. In two treeline forest regions (CD, DQ) characterized by unfavorable climatic conditions (drought stress for CD and winter frost stress for DQ), the clustering of trees and intraspecific facilitation dominated the treeline populations. This result is consistent with the expectation of the stress-gradient hypothesis, which indicates that facilitation prevails as the abiotic stress increases [47]. Seasonal drought stress shaped the treelines in CD, where bigger trees provided a “nursing effect” for young trees by reducing evaporation and improving soil conditions [2]. Such a nursing effect has also been observed at the treelines of the central Himalayan Mountains and the Rocky Mountains, where warming-related drought stress frequently occurs [7,9]. In DQ, however, the seedlings showed a clumped distribution at the fir treelines on shady slopes but random distribution at the juniper treelines on sunny slopes, suggesting that slope aspect-mediated parameters may affect the recruitment processes in the treeline ecotone. Compared to these two forest regions (CD, DQ), tree–tree facilitation did not dominate the Smith fir treeline populations in RW, where seasonal drought stress was not found. Such differences could be due to the “lake effect” [50] and abundant seasonal precipitation on the southeastern TP. Such linkages among seedling recruitment, climate, and microsites have also been observed globally in alpine treelines, and tree recruitment or survival only benefit from climate warming in cold and moist areas [51]. This is also supported by the different tree clustering intensities and treeline shift rates across the precipitation gradient in the central Himalayas [7]. Tree–tree competition appears in the context of relatively low climatic stress [10]. In two forest regions (LZ, AB) dominated by relatively favorable climates, the clustering of young trees, and the over-dispersion of mature trees, and the coexistence of facilitative and competitive interactions were detected in the fir treeline populations. Such results could be due to the fact that suitable climatic conditions (e.g., a moist and mild temperature) allow the existence of a relatively dense tree stand of the undisturbed treeline ecotone, which can be largely linked to competitive interactions if the topographic factor is not a limit [22]. Interestingly two forest regions (LZ, AB) showed similar spatial patterns of trees, as observed in RW, as these areas are characterized by a mild moist climate. Disturbance history can also shape the spatial patterns of treeline trees [4,5]. Indeed, in YS, which is affected by high disturbance pressure, the clustering of trees and intraspecific facilitation dominated the spruce treeline population. High disturbance pressure could reduce the clumping of young trees but increase the environmental stress and is usually linked to facilitation [30,48,49]. If the disturbance pressure was reduced to an optimal level, the clustering intensity of young trees might increase, and interactions between neighboring trees could vary accordingly. Since human disturbances were not found in RW, the results of disturbed treeline populations in YS were obviously different from the results of the undisturbed treeline populations in RW [48]. In view of this, disturbance regimes should be carefully considered in studies of spatial patterns of treeline forests.
Our results in RW are similar to the findings from the two other fir treeline forest regions (LZ, AB). Such consistent results indicate that undisturbed treeline populations under relatively favorable climatic regimes are structured by conspecific interactions. It is likely that mature trees are robust enough to withstand harsh climatic conditions, but young seedlings are highly sensitive and less tolerant to severe climatic conditions [51]; thus, young trees are likely to benefit from the positive feedback associated with clustering [22,25]. In essence, niche overlap for young trees but niche separation for mature trees acts as an important agent driving the distribution patterns of trees and treeline dynamics if the environment is favorable. However, owing to heterogeneous environmental conditions at different treeline sites [52], our results are different from findings in three forest regions (CD, DQ, YS) characterized by unfavorable climates (winter frost stress or seasonal droughts) or high-pressure disturbances. Collectively, the spatial patterns of trees at treeline ecotones may differ among different forest regions of the TP, thus partly supporting our second hypothesis.
5. Conclusions
The opposite tree–tree interactions that occur at small scales have jointly driven the structure of fir treeline populations near Ranwu Lake on the southeastern TP. Intraspecific facilitation may play a critical role in improving seedling growth and establishment, whereas intraspecific competition may lead to niche separation as the trees become mature. Comparative analysis among six different forest regions on the TP indicates that both positive and negative tree–tree interactions emerged in natural treeline forests under favorable climatic conditions (e.g., a mild moist climate), whereas only positive tree–tree interactions dominated the treeline forests under harsh environmental conditions. Therefore, the spatial patterns of trees within the treeline ecotone are largely shaped by the particular combinations of thermal and moisture regimes but also modulated by non-climatic variables (e.g., disturbance history and topographic template). The long-term stability or slow shift rates of treelines and increased stem density indicated that population structure and spatial patterns of trees across treeline ecotones under a warming climate are strongly driven by species interactions. Both biotic and abiotic factors should be carefully considered when exploring the pattern–process linkages of the alpine treeline population.
Author Contributions
Conceptualization, Y.W.; formal analysis: Y.W., Q.M., and P.R.; investigation: Y.W.; writing—original draft preparation: Y.W., Q.M., and P.R.; writing—review and editing, S.R.S. All authors have read and agreed to the published version of the manuscript.
Funding
This study was funded by the National Natural Science Foundation of China (41771222, 42030508) and the Second Tibetan Plateau Scientific Expedition and Research Program (2019QZKK0301).
Data Availability Statement
All the data associated with this article was included in the results. So, we did not report any data.
Acknowledgments
We thank Eryuan Liang for the tremendous support and Xiaoming Lu and Shibin Jiao for their field assistance.
Conflicts of Interest
The authors declare no conflict of interest.
References
- McIntire, J.B.; Fajardo, A. Beyond Description: The Active and Effective Way to Infer Processes from Spatial Patterns. Ecology 2009, 90, 46–56. [Google Scholar] [CrossRef] [PubMed]
- Lyu, L.X.; Zhang, Q.B.; Deng, X.; Mäkinen, H. Fine-scale distribution of treeline trees and the nurse plant facilitation on the eastern Tibetan Plateau. Ecol. Indic. 2016, 66, 251–258. [Google Scholar] [CrossRef] [Green Version]
- Wieczorek, M.; Kruse, S.; Epp, L.S.; Kolmogorov, A.; Nikolaev, A.N.; Heinrich, I.; Jeltsch, F.; Pestryakova, L.A.; Zibulski, R. Dissimilar responses of larch stands in northern Siberia to increasing temperatures-a field and simulation based study. Ecology 2017, 98, 2343–2355. [Google Scholar] [CrossRef] [Green Version]
- Holtmeier, F.K.; Broll, G. Treeline advance-driving processes and adverse factors. Landsc. Online 2007, 1, 1–33. [Google Scholar] [CrossRef]
- Schickhoff, U.; Bobrowski, M.; Böhner, J.; Bürzle, B.; Chaudhary, R.P.; Gerlitz, L.; Heyken, H.; Lange, J.; Müller, M.; Scholten, T.; et al. Do Himalayan treelines respond to recent climate change? An evaluation of sensitivity indicators. Earth Syst. Dynam. 2016, 6, 245–265. [Google Scholar] [CrossRef]
- Shi, H.; Zhou, Q.; Xie, F.L.; He, N.J.; He, R.; Zhang, K.R.; Zhang, Q.F.; Dang, H.S. Disparity in elevational shifts of upper species limits in response to recent climate warming in the Qinling Mountains, North-central China. Sci. Total Environ. 2020, 706, 135718. [Google Scholar] [CrossRef]
- Sigdel, S.R.; Liang, E.; Wang, Y.F.; Dawadi, B.; Camarero, J.J. Tree-to-tree interactions slow down Himalayan treeline shifts as inferred from tree spatial patterns. J. Biogeogr. 2020, 47, 1816–1826. [Google Scholar] [CrossRef]
- Astudillo-Sanchez, C.C.; Fowler, M.S.; Villanueva-Diaz, J.; Villanueva-Díaz, J.; Endara-Agramont, A.R.; Soria-Díaz, L. Recruitment and facilitation in Pinus hartwegii, a Mexican alpine treeline ecotone, with potential responses to climate warming. Trees 2019, 33, 1087–1100. [Google Scholar] [CrossRef] [Green Version]
- Elliot, G.P. Influences of 20th-century warming at the upper tree line contingent on local-scale interactions: Evidence from a latitudinal gradient in the Rocky Mountains, USA. Glob. Ecol. Biogeogr. 2011, 20, 46–57. [Google Scholar] [CrossRef]
- Wang, Y.; Pederson, N.; Ellison, A.M.; Buckley, H.L.; Case, B.S.; Liang, E.Y.; Julio, C.; Camarero, J.J. Increased stem density and competition may diminish the positive effects of warming at alpine treeline. Ecology 2016, 97, 1668–1679. [Google Scholar] [CrossRef] [Green Version]
- Körner, C. Alpine Treelines: Functional Ecology of the Global High Elevation Tree Limits; Springer: Basel, Switzerland, 2012. [Google Scholar]
- Scherrer, D.; Vitasse, Y.; Guisan, A.; Wohlgemuth, T.; Lischke, H. Competition and demography rather than dispersal limitation slow down upward shifts of trees’s upper elevation limits in the Alps. J. Ecol. 2020, 108, 2416–2430. [Google Scholar] [CrossRef]
- Liu, B.; Liang, E.; Zhu, L.P. Microclimatic conditions for Juniperus saltuaria treeline in the Sygera Mountains, southeastern Tibetan Plateau. Mt. Res. Dev. 2011, 31, 45–53. [Google Scholar] [CrossRef]
- Li, X.; Liang, E.; Gričar, J.; Rossi, S.; Čufaret, K.; Ellison, A.M. Critical temperature and precipitation thresholds for the onset of xylogenesis and maintains treelines on the southeastern Tibetan Plateau. Sci. Bull. 2017, 62, 804–812. [Google Scholar] [CrossRef] [Green Version]
- Arekhi, M.; Yesil, A.; Ozkan, Y.; Sanli, F.B. Detecting treeline dynamics in response to climate warming using forest stand maps and Landsat data in a temperate forest. For. Ecosyst. 2018, 5, 23. [Google Scholar] [CrossRef] [Green Version]
- Gatti, R.C.; Callaghan, T.; Velichevskaya, A.; Dudko, A.; Fabbio, L.; Battipaglia, G.; Liang, J. Accelerating upward treeline shift in the Altai Mountains under last-century climate change. Sci. Rep. 2019, 9, 768. [Google Scholar]
- Lu, X.; Liang, E.; Wang, Y.; Babst, F.; Camarero, J.J. Mountain treelines climb slowly despite rapid climate warming. Glob. Ecol. Biogeogr. 2021, 30, 305–315. [Google Scholar] [CrossRef]
- Batllori, E.; Gutierrez, E. Regional tree line dynamics in response to global change in the Pyrenees. J. Ecol. 2008, 96, 1275–1288. [Google Scholar] [CrossRef]
- Camarero, J.J.; Gutierrez, E. Pace and pattern of recent treeline dynamics: Response of ecotones to climatic variability in the Spanish Pyrenees. Clim. Chang. 2004, 63, 181–200. [Google Scholar] [CrossRef]
- Bailey, S.N.; Elliot, G.P.; Schliep, E.M. Seasonal temperature-moisture interactions limit seedling establishment at upper treeline in the Southern Rockies. Ecosphere 2021, 12, e03568. [Google Scholar] [CrossRef]
- Sigdel, S.R.; Wang, Y.; Camarero, J.J.; Zhu, H.; Liang, E.; Peuelas, J. Moisture-mediated responsiveness of treeline shifts to global warming in the Himalayas. Glob. Chang. Bio 2018, 24, 5549–5559. [Google Scholar] [CrossRef] [Green Version]
- Harper, K.A.; Danby, R.K.; From Fields, D.L.; Lewis, K.P.; Trant, A.J.; Starzomski, B.M.; Savidge, R.; Hermanutz, L. Tree spatial pattern within the forest-tundra ecotone: A comparison of sites across Canada. Can. J. For. Res. 2011, 41, 479–489. [Google Scholar] [CrossRef]
- Feuillet, T.; Birre, D.; Milian, J.; Godard, V.; Clauzel, C.; Serrano-Notivoli, R. Spatial dynamics of alpine tree lines under global warming: What explains the mismatch between tree densification and elevational upward shifts at the tree line ecotone? J. Biogeogr. 2020, 47, 1056–1068. [Google Scholar] [CrossRef]
- Callaway, R.M. Positive Interactions and Interdependence in Plant Communities; Springer: Dordrecht, The Netherlands, 2007. [Google Scholar]
- Smith, W.K.; Germino, M.J.; Hancock, T.E.; Johnson, D.M. Another perspective on altitudinal limits of alpine timberlines. Tree Physiol. 2003, 23, 1101–1112. [Google Scholar] [CrossRef] [PubMed] [Green Version]
- Miehe, G.; Miehe, S.; Vogel, J.; Co, s.; Duo, L. Highest treeline in the northern hemisphere found in southern Tibet. Mt. Res. Dev. 2007, 27, 169–173. [Google Scholar] [CrossRef] [Green Version]
- Liang, E.; Wang, Y.; Piao, S.; Lu, X.; Camarero, J.J.; Zhu, L.; Zhu, L.; Ellison, A.M.; Ciais, P.; Josep, P. Species interactions slow warming-induced upward shifts of treelines on the Tibetan Plateau. Proc. Natl. Acad. Sci. USA 2016, 113, 4380–4385. [Google Scholar] [CrossRef] [Green Version]
- Miao, N.; Liu, S.; Shi, Z.; Xue, Z.B.; Yu, H.; He, F. Spatial pattern analysis of a Rhododendron-Abies virginal forest near timberline on the eastern edge of Qinghai-Tibetan Plateau, China. Acta Ecol. Sin. 2011, 31, 1–9. [Google Scholar]
- Wang, Y.; Camarero, J.J.; Luo, T.; Liang, E. Spatial patterns of Smith fir alpine treelines on the south-eastern Tibetan Plateau support that contingent local conditions drive recent treeline patterns. Plant Ecol. Divers. 2012, 5, 311–321. [Google Scholar] [CrossRef]
- Zhang, K.; Liu, B.; Wang, Y. Size structure and spatial patterns of Balfour spruce treeline population in Yushu, Qinghai. J. Earth Environ. 2020, 11, 660–671. [Google Scholar] [CrossRef]
- Zhang, Q.; Luo, P.; Zhang, Y.; Shi, F.; Wu, N. Ecological characteristics of Abies georgi population at timberline on the north-facing slope of Baima Snow mountains, southwest China. Acta Ecol. Sin. 2008, 28, 129–135. [Google Scholar] [CrossRef]
- Zhang, Q.; Zhang, Y.; Luo, P.; Wang, Q.; Wu, N. Ecological characteristics of a Sabina saltuaria population at timberline on the south facing slope of Baima Snow Mountain, southwest China. J. Plant Ecol. 2007, 31, 857–864. [Google Scholar] [CrossRef]
- Bader, M.Y.; Llambi, L.D.; Case, B.S.; Buckley, H.; Toivon, J.M.; Camarero, J.J.; Cairns, D.M.; Brown, C.D.; Wiegand, T.; Resler, L.M. A global framework for linking alpine-treeline ecotone patterns to underlying processes. Ecography 2021, 44, 265–292. [Google Scholar] [CrossRef]
- Harris, I.; Jones, P.D.; Osborn, T.J.; Lister, D.H. Updated high-resolution grids of monthly climatic observations- the CRU TS3.10 Dataset. Int. J. Climatol. 2014, 34, 623–642. [Google Scholar] [CrossRef] [Green Version]
- Zhu, H.F.; Shao, X.M.; Yin, Z.Y.; Xu, P.; Tian, H. August temperature variability in the southeastern Tibetan Plateau since AD 1385 inferred from tree rings. Palaeogeogr. Palaeoclim. Palaeocl 2011, 305, 84–92. [Google Scholar] [CrossRef]
- Liang, E.; Wang, Y.; Xu, Y.; Liu, B.; Shao, X. Growth variation in Abies georgei var. smithii along altitudinal gradients in the Sygera Mountains, southeastern Tibetan Plateau. Trees 2010, 24, 363–373. [Google Scholar] [CrossRef]
- Liang, E.; Wang, F.; Eckstein, D.; Luo, T. Little change in the fir tree-line position on the southeastern Tibetan Plateau after 200 years of warming. New Phytol. 2011, 190, 760–769. [Google Scholar] [CrossRef]
- Applequist, M.B. A simple pith locator for use with off-center increment cores. J. For. 1958, 56, 138–143. [Google Scholar] [CrossRef] [Green Version]
- Camarero, J.J.; Gutiérrez, E.; Fortin, M. Spatial pattern of subalpine forest-alpine grassland ecotones in the Spanish Central Pyrenees. For. Ecol. Manag. 2000, 134, 1–16. [Google Scholar] [CrossRef]
- Camarero, J.J.; Gutiérrez, E.; Fortin, M.; Ribbens, E. Spatial patterns of tree recruitment in a relict population of Pinus uncinata: Forest expansion through stratified diffusion. J. Biogeogr. 2005, 32, 1979–1992. [Google Scholar] [CrossRef]
- Wiegand, T.; Moloney, K.A. Rings, circles, and null-models for point pattern analysis in ecology. Oikos 2004, 104, 209–229. [Google Scholar] [CrossRef]
- Zhang, Q.; Zhang, Y.; Peng, S.; Yirdaw, E.; Wu, N. Spatial structure of alpine trees in Mountain Baima Xueshan. on the southeast Tibetan Plateau. Silva Fenn. 2009, 43, 197–208. [Google Scholar] [CrossRef] [Green Version]
- Batllori, E.; Camarero, J.J.; Gutiérrez, E. Current regeneration patterns at the tree line in the Pyrenees indicate similar recruitment processes irrespective of the past disturbance regime. J. Biogeogr. 2010, 37, 1938–1950. [Google Scholar] [CrossRef]
- Kenkel, N.C. Pattern of self-thinning in Jack pine: Testing the random mortality hypothesis. Ecology 1988, 69, 1017–1024. [Google Scholar] [CrossRef]
- Rietkerk, M.; Van de Koppel, J. Regular pattern formation in real ecosystems. Trends Ecol. Evol. 2008, 23, 169–175. [Google Scholar] [CrossRef] [PubMed]
- Batllori, E.; Camarero, J.J.; Ninot, J.M.; Gutiérrez, E. Seedling recruitment, survival and facilitation in alpine Pinus uncinata tree line ecotones. Implications and potential responses to climate warming. Glob. Ecol. Biogeogr. 2009, 18, 460–472. [Google Scholar] [CrossRef]
- He, Q.; Bertness, M.D.; Altieri, A.H.; Monstserrat, V. Global shifts towards positive species interactions with increasing environmental stress. Ecol. Lett. 2013, 16, 695–706. [Google Scholar] [CrossRef] [PubMed]
- Wang, Y.; Sylvester, S.P.; Lu, X.; Dawadi, B.; Sigdel, S.R.; Liang, E.; Camarero, J.J. The stability of spruce treelines on the eastern Tibetan Plateau over the last century is explained by pastoral disturbance. For. Ecol. Manag. 2019, 442, 34–45. [Google Scholar] [CrossRef]
- Naudiyal, N.; Wang, J.N.; Ning, W.; Gaire, N.P.; Peili, S.; Wei, Y.D.; He, J.A.; Shi, N.A. Potential distribution of Abies, Picea, and Juniperus species in the sub-alpine forest of Minjiang headwater region under current and future climate scenarios and its implications on ecosystem services supply. Ecol. Indic. 2021, 121, 107131. [Google Scholar] [CrossRef]
- Dai, Y.; Yao, T.; Li, X.; Ping, F. The impact of lake effect on the temporal and spatial distribution of precipitation in the Nam Co basin, Tibetan Plateau. Quat. Int. 2018, 475, 63–69. [Google Scholar] [CrossRef]
- Johnson, A.C.; Yeakley, J.A. Microsites and Climate Zones: Seedling Regeneration in the Alpine Treeline Ecotone Worldwide. Forests 2019, 10, 864. [Google Scholar] [CrossRef] [Green Version]
- Wang, Y.; Liang, E.; Sigdel, S.R.; Liu, B.; Camarero, J. The coupling of treeline elevation and temperature is mediated by non-thermal factors on the Tibetan Plateau. Forests 2017, 8, 109. [Google Scholar] [CrossRef] [Green Version]
Figure 1.
Spatial locations of treeline plots near Ranwu Lake (symbol: green tree; plot NE1, NE2) and previous studies (black square) on the TP. Abbreviations for treeline forest regions include YS (Yushu), CD (Changdu), LZ (Linzhi), AB (Aba), DQ (Deqin).
Figure 1.
Spatial locations of treeline plots near Ranwu Lake (symbol: green tree; plot NE1, NE2) and previous studies (black square) on the TP. Abbreviations for treeline forest regions include YS (Yushu), CD (Changdu), LZ (Linzhi), AB (Aba), DQ (Deqin).

Figure 2.
Spatial locations of three size classes (adults, juveniles, and seedlings) of the trees within two fir treeline plots (left part: plot NE1; right part: plot NE2).
Figure 2.
Spatial locations of three size classes (adults, juveniles, and seedlings) of the trees within two fir treeline plots (left part: plot NE1; right part: plot NE2).

Figure 3.
Relationships between the DBH and crown diameter (a,b) and DBH and height (c,d) of trees within the two fir treeline plots (first column: plot NE1; second column: plot NE2). An asterisk (*) represents multiplication.
Figure 3.
Relationships between the DBH and crown diameter (a,b) and DBH and height (c,d) of trees within the two fir treeline plots (first column: plot NE1; second column: plot NE2). An asterisk (*) represents multiplication.

Figure 4.
Distributions of DBH (5 cm classes) (a,b) and tree age classes (50 yr-interval) (c,d) and their fitted curves within two treeline plots (first row: plot NE1; second row: plot NE2). An asterisk (*) represents multiplication.
Figure 4.
Distributions of DBH (5 cm classes) (a,b) and tree age classes (50 yr-interval) (c,d) and their fitted curves within two treeline plots (first row: plot NE1; second row: plot NE2). An asterisk (*) represents multiplication.

Figure 5.
Frequency histogram of trees along the elevational gradient (10 m-interval) (a) and tree age–elevation relationships (b) within two treeline plots.
Figure 5.
Frequency histogram of trees along the elevational gradient (10 m-interval) (a) and tree age–elevation relationships (b) within two treeline plots.

Figure 6.
Values of Moran’ I for three size classes of trees (seedling, juvenile, adult) (plot NE1: (a–c); plot NE2: (d–f)) and the whole treeline population (plot NE1: (g); plot NE2: (h)). Dotted lines correspond to the upper and lower confidence intervals of p = 0.05.
Figure 6.
Values of Moran’ I for three size classes of trees (seedling, juvenile, adult) (plot NE1: (a–c); plot NE2: (d–f)) and the whole treeline population (plot NE1: (g); plot NE2: (h)). Dotted lines correspond to the upper and lower confidence intervals of p = 0.05.

Figure 7.
The univariate spatial point pattern analysis for three size classes of trees (adult, juvenile, seedling) (plot NE1: (a–c); plot NE2: (d–f)). Dotted lines represent the upper and lower confidence intervals of p = 0.05.
Figure 7.
The univariate spatial point pattern analysis for three size classes of trees (adult, juvenile, seedling) (plot NE1: (a–c); plot NE2: (d–f)). Dotted lines represent the upper and lower confidence intervals of p = 0.05.

Figure 8.
The bivariate spatial point pattern analysis for three size classes of trees (adults, juveniles, seedling) (plot NE1: (a–c); plot NE2: (d–f)). Dotted lines denote the upper and lower confidence interval of p = 0.05.
Figure 8.
The bivariate spatial point pattern analysis for three size classes of trees (adults, juveniles, seedling) (plot NE1: (a–c); plot NE2: (d–f)). Dotted lines denote the upper and lower confidence interval of p = 0.05.


Table 1.
Tree spatial patterns in six treeline forest regions on the TP (See the locations in Figure 1). Abbreviations include S1 (Abies faxoniana), S2 (Picea likiangensis (Franch) Pritz var. balfouriana), S3 (Abies georgei var. smithii), S4 (Abies georgei), S5 (Juniperus saltuaria); clumped distribution (CD), random distribution (RD), regular distribution (RGD). Spatial positive associations (PA), spatial negative associations (NA), spatial uncorrelated (UC); southeastern Tibetan Plateau (SETP), eastern Tibetan Plateau (ETP); seedlings (SE), juveniles (JV), adults (AD); environmental conditions (EC), winter stress (WS), suitable hydrothermal regimes (SHT), seasonal drought stress (DS), high human disturbance pressure (DP). Note that the summary results of five forest regions (AB, YS, CD, LZ, DQ) were extracted from the published literature.
| Study Region | Species | EC | Spatial Distributions of Tree Classes (Scale: m) | Spatial Associations between Tree Classes (Scale: m) | Data Source | ||||
|---|---|---|---|---|---|---|---|---|---|
| SE | JV | AD | SE-JV | SE-AD | JV-AD | ||||
| AB, ETP | S1 | SHT | CD: 1–5 | CD: 1–2 | RGD: 1–2; RD: 3–15 | PA: 1–5 | NA: 1–6; PA: 8–13 | NA: 1–15 | [28] |
| YS, ETP | S2 | DP | CD: 1–4 | RD: 1–15 | RD: 1–15 | PA: 2–6 | PA: 9–14 | UC: 1–15 | [30] |
| CD, ETP | S2 | DS | CD: 1–15 | CD: 2–15 | RD: 2–15 | PA: 1–15 | PA: 1–15 | PA: 1–15 | [2] |
| LZ, SETP | S3 | SHT | CD: 1–7 | CD: 1–7 | RD: 1–15 | PA: 1–7 | NA: 1–5 | NA: 1–5 | [29] |
| DQ, SETP | S4 | WS | CD: 1–15 | CD: 1–15 | CD: 1–15 | PA: 1–15 | PA: 1–15 | PA: 1–15 | [31] |
| DQ, SETP | S5 | WS | RD: 1–15 | CD: 1–15 | CD: 1–15 | PA: 1–15 | PA: 1–15 | PA: 1–15 | [32] |
| Plot NE1 in RW, SETP | S3 | SHT | CD: 1–5 | CD: 1–2 | RD: 1–15 | PA: 1–4 | NA: 1–2, 10 | NA: 8–9, 12, 14 | This study |
| Plot NE2 in RW, SETP | S3 | SHT | CD: 1–7 | CD: 1–2 | RD: 1–15 | PA: 1–4; NA: 7–15 | PA: 7–14 | NA: 3–4, 6–8 | This study |
Publisher’s Note: MDPI stays neutral with regard to jurisdictional claims in published maps and institutional affiliations. |
© 2021 by the authors. Licensee MDPI, Basel, Switzerland. This article is an open access article distributed under the terms and conditions of the Creative Commons Attribution (CC BY) license (https://creativecommons.org/licenses/by/4.0/).
Share and Cite
MDPI and ACS Style
Wang, Y.; Mao, Q.; Ren, P.; Sigdel, S.R. Opposite Tree-Tree Interactions Jointly Drive the Natural Fir Treeline Population on the Southeastern Tibetan Plateau. Forests 2021, 12, 1417. https://doi.org/10.3390/f12101417
AMA Style
Wang Y, Mao Q, Ren P, Sigdel SR. Opposite Tree-Tree Interactions Jointly Drive the Natural Fir Treeline Population on the Southeastern Tibetan Plateau. Forests. 2021; 12(10):1417. https://doi.org/10.3390/f12101417
Chicago/Turabian StyleWang, Yafeng, Qing Mao, Ping Ren, and Shalik Ram Sigdel. 2021. "Opposite Tree-Tree Interactions Jointly Drive the Natural Fir Treeline Population on the Southeastern Tibetan Plateau" Forests 12, no. 10: 1417. https://doi.org/10.3390/f12101417
Note that from the first issue of 2016, this journal uses article numbers instead of page numbers. See further details here.