
Heteroblastic Foliage Affects the Accumulation of Non-Structural Carbohydrates and Biomass in Pinus massoniana (Lamb.) Seedlings

1
Institute for Forest Resources and Environment of Guizhou, Guizhou University, Guiyang 550025, China
2
Key Laboratory of Forest Cultivation in Plateau Mountain of Guizhou Province, Guizhou University, Guiyang 550025, China
3
College of Forestry, Guizhou University, Guiyang 550025, China
*
Author to whom correspondence should be addressed.
†
Those authors contributed equally to this work.
Forests 2021, 12(12), 1686; https://doi.org/10.3390/f12121686
Submission received: 12 November 2021
/
Revised: 29 November 2021
/
Accepted: 30 November 2021
/
Published: 2 December 2021
(This article belongs to the Section Forest Ecophysiology and Biology)
Abstract
:Pines have heteroblastic foliage (primary and secondary needles) during seedling stage, but how heteroblastic foliage affects carbon storage and biomass accumulation, contributing to seedling quality, is unclear. We investigated the influences of heteroblastic foliage on photosynthetic physiological characteristics, non-structural carbohydrate (NSC) and biomass accumulation in current-year seedlings; the key factors determining biomass accumulation were mainly determined by principal component screening, Spearman correlation, and path analysis. The results indicated that (1) primary needles have high photosynthetic pigments (chlorophyll a and total chlorophyll), net photosynthetic rates (Pn), the potential maximum photochemical efficiency (Fv/Fm), and leaf instantaneous water use efficiency (WUEi), whereas higher non-photochemical quenching (NPQ) suggested that sudden light increases induce the initiation of quenching mechanism in primary needles; additionally, secondary needles had a lower transpiration rate (Tr), limiting stomata (Ls), and light saturation point. (2) Secondary needles promoted soluble sugar (fructose and glucose) increases in leaves compared to that of primary needles and increased the leaf biomass accumulation (from 47.06% to 54.30%), enhancing the overall ability of photosynthetic organs; additionally, secondary needles can enhance the proportion of starch storage in the roots, and NSC accumulation was significantly increasing in the seedling leaves and roots. (3) Photosynthetic pigments (carotenoids, chlorophyll a, and total chlorophyll) had direct positive effects on primary needle seedling (PNS) biomass and promoted biomass by indirectly increasing soluble sugar synthesis in the stems. The Pn was the main physiological factor determining PNS biomass accumulation. In addition, the WUEi, Ls, and NPQ had direct negative effects on PNS biomass accumulation, inhibiting photosynthesis to limit seedling growth. Considering the functional traits in heteroblastic foliage is necessary when assessing different leaf types of Pinus massoniana (Lamb.) seedlings, in particular those threats implicated in light, water, and temperature relations. Our results can be beneficial to guide the establishment of seedling management and afforestation measures.
1. Introduction
Heteroblastic foliage is defined as a certain degree of ontogenetic variation in the form and function of leaf as it transitions from immature to mature, and it is a result of structural changes within the shoot apical meristem (SAM), producing leaf primordia with different histological morphologies during the plant’s developmental stage [1]. Needles are the main photosynthetic organs in pine, and they are related to the physiological and ecological adaptability of plants [2]. The Pinus species has obvious ontogenetic differences in needle morphology between the juvenile and adult phases, i.e., the variation in the shape and size of needle mutate along the axis of an individual plant [3]. Pine seedlings exhibit heteroblastic foliage (primary and secondary needles) during seedling development. Primary needles grow after germination, followed by secondary needles, which usually occurs in the first few years of seedling [4]. For some pine species, primary needles will gradually fall off and be replaced by secondary needles at the end of the first growth season [5]. Secondary needle sprouting is noticeably delayed in several species, such as Pinus pinaster and Pinus brutia [6]. This kind of foliage displacement occurs only once and is irreversible [7].
Heteroblastic plants can possibly delay or hasten a shift from one leaf type to another with specific external conditions, which is called heteroblastic foliar plasticity [8]; i.e., the ability of a plant genotype to generate different phenotypes depends on the environment, which includes genetic differentiation between individuals and ontogenetic variation [9]. In Mediterranean species, pine seedlings form secondary needles after the second vegetative period, and this phenomenon is not related to seedling size [5], which is mainly controlled by genetics and might be related to inter-specific variation [10]. In the case of Pinus halepensis, the primary needles produced by seedlings can last for four or more years until secondary needles emerge, which indicates the end of an extremely long juvenile phase and the beginning of a maturity stage [11]. Therefore, variation in phenotypes of conifer needles is a consequence of genetic evolution [12], and significant genetic variations in needle characteristics are observed among and within the species [13,14]. Previous research has shown that the variance in morphological and anatomical traits of needles within species was higher than that among different species [15,16]. As the needle traits are closely associated with photosynthesis, water metabolism, and stress resistance, heteroblastic foliage has substantial consequences on the plant’s process of obtaining resources [17].
Non-structural carbohydrates (NSCs), which are composed of water-soluble sugars (e.g., fructose, glucose, and sucrose) and starch, provide energy for plant growth and physiological processes (e.g., plant metabolism, material transportation, and embolism repair) [18] and play an important regulatory role in plant stress tolerance [19,20]. Moreover, the allocation of NSCs in leaves, stems, and roots is regarded as ecophysiological attributes that reflect the carbon budgets in woody plants that exist between photosynthetic carbon assimilation and metabolic carbon consumption [20]. For example, leaves are a source organ for carbon assimilation, while stems and roots are important organs that are related to carbon storage [21]. Additionally, previous studies have demonstrated that plants can adjust the biomass ratio of photosynthetic and non-photosynthetic tissues to maintain their functional balance and resist the damage caused by environmental stress [22,23]. Growth traits and biomass are also important components of seedling quality evaluations [24,25]. The free shoot growth and biomass allocation patterns in seedlings have been known as fundamental features of life-history diversification in forest trees [26]. Leaf economics reveal the relationship between leaf function and either the growth potential or cost of morphological constructions, and seedlings can be categorized as having low photosynthetic rates and slow turnovers of dry matter or having high photosynthetic rates and rapid returns [27]. Optimal partitioning theory (OPT) accounts for the allocation of biomass in seedlings to organs with limited resources. Seedlings with heteroblastic foliage have various biological and ecological functions [28]. Studies on the effects of seedling carbon reserves and biomass distribution by heteroblastic foliage would be beneficial to guide the establishment of seedling management and afforestation measures.
P. massoniana Lamb. is an important afforestation tree species in southern China [29,30]. Interestingly, our previous research found that primary needle seedlings (PNSs) and secondary needle seedlings (SNSs) appeared in the first growing season of P. massoniana, implying that the axillary bud of some seedlings was not delayed [31]. Moreover, we found that the secondary needles of current-year P. massoniana seedlings had a larger photosynthetic area and leaf mass area (LAM) than those of the primary needles, the seedling quality and drought-resistant ability of SNS were higher than those of PNS after afforestation [31,32], and the morphological and physiological responses of P. massoniana seedlings under different light intensities were also caused by the developmental timing differences in heteroblastic foliage [33]. Primary needles are typically single and with different multiple needles of secondary needles in P. massoniana. Therefore, this species can provide a suitable model for expanding our understanding of the functions of heteromorphic foliage and how they influence the growth of seedlings.
Subdividing leaf functional traits into juvenile (primary) and adult (secondary) needles can provide a greater understanding of seedling growth strategies and biomass partitioning [34]. The seedlings showed different growth and survival rates, especially at the early stage of plantation establishment, which could be explained by the variation in leaf functional traits [35]. The primary needles of Mediterranean pines remained longer, implying that juvenile needles play a particularly significant role in the juvenile phase of seedling or sapling establishment [36]. Moreover, primary needles had greater mesophyll and chloroplast volume fractions than that of secondary needles, implying they have an overall greater photosynthetic activity [37]. Nevertheless, the secondary needles had a higher fraction of water conducting (xylem), nutrient transporting (phloem), and transfusion parenchyma than that of primary needles, improving the compensation mechanism of material transport capacity [38]. We hypothesized that heteroblastic foliage would exhibit different photosynthetic mechanisms under similar environmental conditions. However, little is known about the effects of heteroblastic foliage on the NSC concentration and biomass allocation in P. massoniana seedlings. Therefore, the objective of this study was to (i) explore how heteroblastic foliage affects photosynthetic physiological changes in P. massoniana seedlings, (ii) determine the variation in biomass and NSC allocation patterns of seedlings with primary and secondary needles, and (iii) identify which key physiological factors determine biomass accumulation. In this study, we identified and screened the key factors that were most related to the accumulation of biomass in various organs and adopted intervention measures in seedling management to promote seedling growth, which can be more informative for silvicultural interventions.
2. Materials and Methods
2.1. Plant Material and Growth Conditions
The study was conducted in an experimental field at Guizhou University (26°26′ N, 106°39′ E, 920 m elevation), Guizhou Province, China. The seeds were sown in germinator boxes placed in greenhouses. The substrate was vermiculite, and the greenhouses was maintained at the mean daily temperature of 27 °C, light intensity of 180 μmol·m−2·s−1, and the humidity of 75%. After 4 weeks, the seedlings were transferred into nonwoven planting bags (with 8.0 cm diameters and 12.0 cm heights). The substrate mixture was a topsoil:humus:vermiculite mixture (2:1:1, v/v/v; pH 5.0). The seedlings were placed in a seedbed outdoors to ensure the environmental conditions were the same. Previous studies showed that axillary buds formed in July and transitioned to secondary needles in August in some seedlings, which continued to develop into SNS. The PNS and SNS could be clearly distinguished in September. PNS and SNS (approximately 40 seedlings of each) were selected for the experiment and transferred to an illumination incubator (PRX-350C, SAFE, Ningbo, China) at light intensity (560 μmol·m−2·s−1), constant relative humidity (75%), and temperature (28 °C day/25 °C dark) under a 10 h day/14 h dark cycle for a month (Figure 1). All seedlings grew under the same light, precipitation, and soil fertility conditions in this study. In addition, there were no signs of competition among individuals at the time of measurements.
2.2. Measurements of Photosynthetic Physiology
Six seedlings from each leaf type were marked to measure photosynthesis. Chlorophylls and carotenoids were quantified in the needles sampled on the same days as the photosynthetic parameters, and fluorescence measurements were taken. The middle part of the fresh needles (both types) was collected in the field and frozen in liquid nitrogen. The contents of chlorophyll a (Chl a), chlorophyll b (Chl b), chlorophyll (a + b) (Chl C), and carotenoids (Car) were quantified with a spectrophotometer (UV-2100, UNICO, Princeton, NJ, USA) following the method described by Dere et al. [39].
The net photosynthetic rate (Pn), stomatal conductance (Gs), intercellular CO2 concentration (Ci), transpiration rate (Tr), leaf instantaneous water use efficiency (WUEi = Pn/Tr), and limiting stomata (Ls = 1 − Ci/Ca, Ca is the CO2 concentration in the air) were measured at approximately 9:00–11:00 am with a portable photosynthesis system (LI-6400, Li-Cor Inc., Lincoln, NE, USA). The healthy needles were spread over the leaf chamber, forming a one-needle-deep layer. The gas exchange parameters were measured at 1200 μmol photons m−2·s−1 of PPFD, chamber CO2 concentrations of 380 ppm, and a flow rate of 500 mmol·m−2·s−1. The method utilized was described by Li et al. [40].
Chlorophyll a fluorescence was measured after a dark adaptation for 35–40 min with a MONI-PAM fluorometer (Heinz Walz GmbH, Effeltrich, Germany). The needles were fully spread throughout the sample clamp, and the measurement data were transmitted to the computer through MONI-IB4 and MONI-DA. Then, the fast ChlF curves and rapid optical response curves (RLCs) were simulated by WinControl-3 software. The slow induction kinetics curve of the dark-adapted leaves was determined first; the initial fluorescence value (Fo) was determined by irradiation measurement light (less than 0.5 μmol·m−2·s−1); and the maximum fluorescence value (Fm) was determined by a 0.6 s saturation pulse (approximately 10,000 μmol·m−2·s−1). According to the parameters of the RLCs, the actinic intensity was set at 0–1500 μmol·m−2·s−1. The method utilized was described by Porcar-Castell [41].
2.3. Biomass Allocation and Non-Structural Carbohydrate Measurements
Six seedlings per type were destructively sampled individually. Each seedling was carefully excavated and washed. The whole seedlings were sampled destructively and separated into leaves, stems, and roots and oven-dried at 105 °C for 2.5 h and at 75 °C for 48 h until reaching a constant weight.
The total concentration of NSCs was defined as the sum of soluble sugar and starch concentrations. After grinding the dry sample with a ball mill (Retsch MM400; Retsch, Haan, Germany), the total NSC and soluble sugar (SS; sucrose, fructose, and glucose) concentrations of the leaves, roots, and stems were measured using a microplate reader (Spark 10 M, Tecan, Grödig, Austria). The method utilized was described by [19].
2.4. Statistical Analysis
The results are reported as the means with standard errors. Microsoft Excel (2013) was used to perform the preliminary statistics. The significance of the results was checked by using the paired-samples t test at p < 0.05 or p < 0.01 with SPSS 20.0 for Windows (SPSS Inc. Chicago, IL, USA). The correlation between biomass accumulation and photosynthetic physiological parameters was evaluated using Pearson’s correlation coefficient at p < 0.05 or p < 0.01. The effect of each physiological and biochemical index on organ morphogenesis was evaluated via principal component analysis (PCA) using the statistical program R 3.6.3. Origin Pro 8.5 (OriginLab Corporation, Northampton, MA, USA) was used to plot the data.
Path analysis is a useful statistical approach when an influence with multiple factors is involved, which considers both direct and indirect effects [42] (Figure 2). The independent variable xi (i = 1, 2, ……, m) and the correlation coefficient riy of the dependent variable y, which is divided by the direct effect of xi on y and the indirect effect of xi on y through other independent variables, are placed so that the relative importance of each factor can be directly compared.
3. Results
3.1. Variations in the Photosynthetic Physiology between Heteroblastic Foliage
Chl a and Chl C were greater in primary needles than in secondary needles (p < 0.01 or p < 0.05), but there was no significant difference in the Chl b and Car contents (Figure 3). In addition, the ratio of Chl a/Chl b was lower in secondary needles than in primary needles, which was 85.08% for the primary needles. The results showed that the difference in heteroblastic foliage was mainly due to the decrease in Chl a content in secondary needles, which led to a change in Chl C content; thus, both the ability of pigments to capture light energy and the process of photochemical reaction were affected.
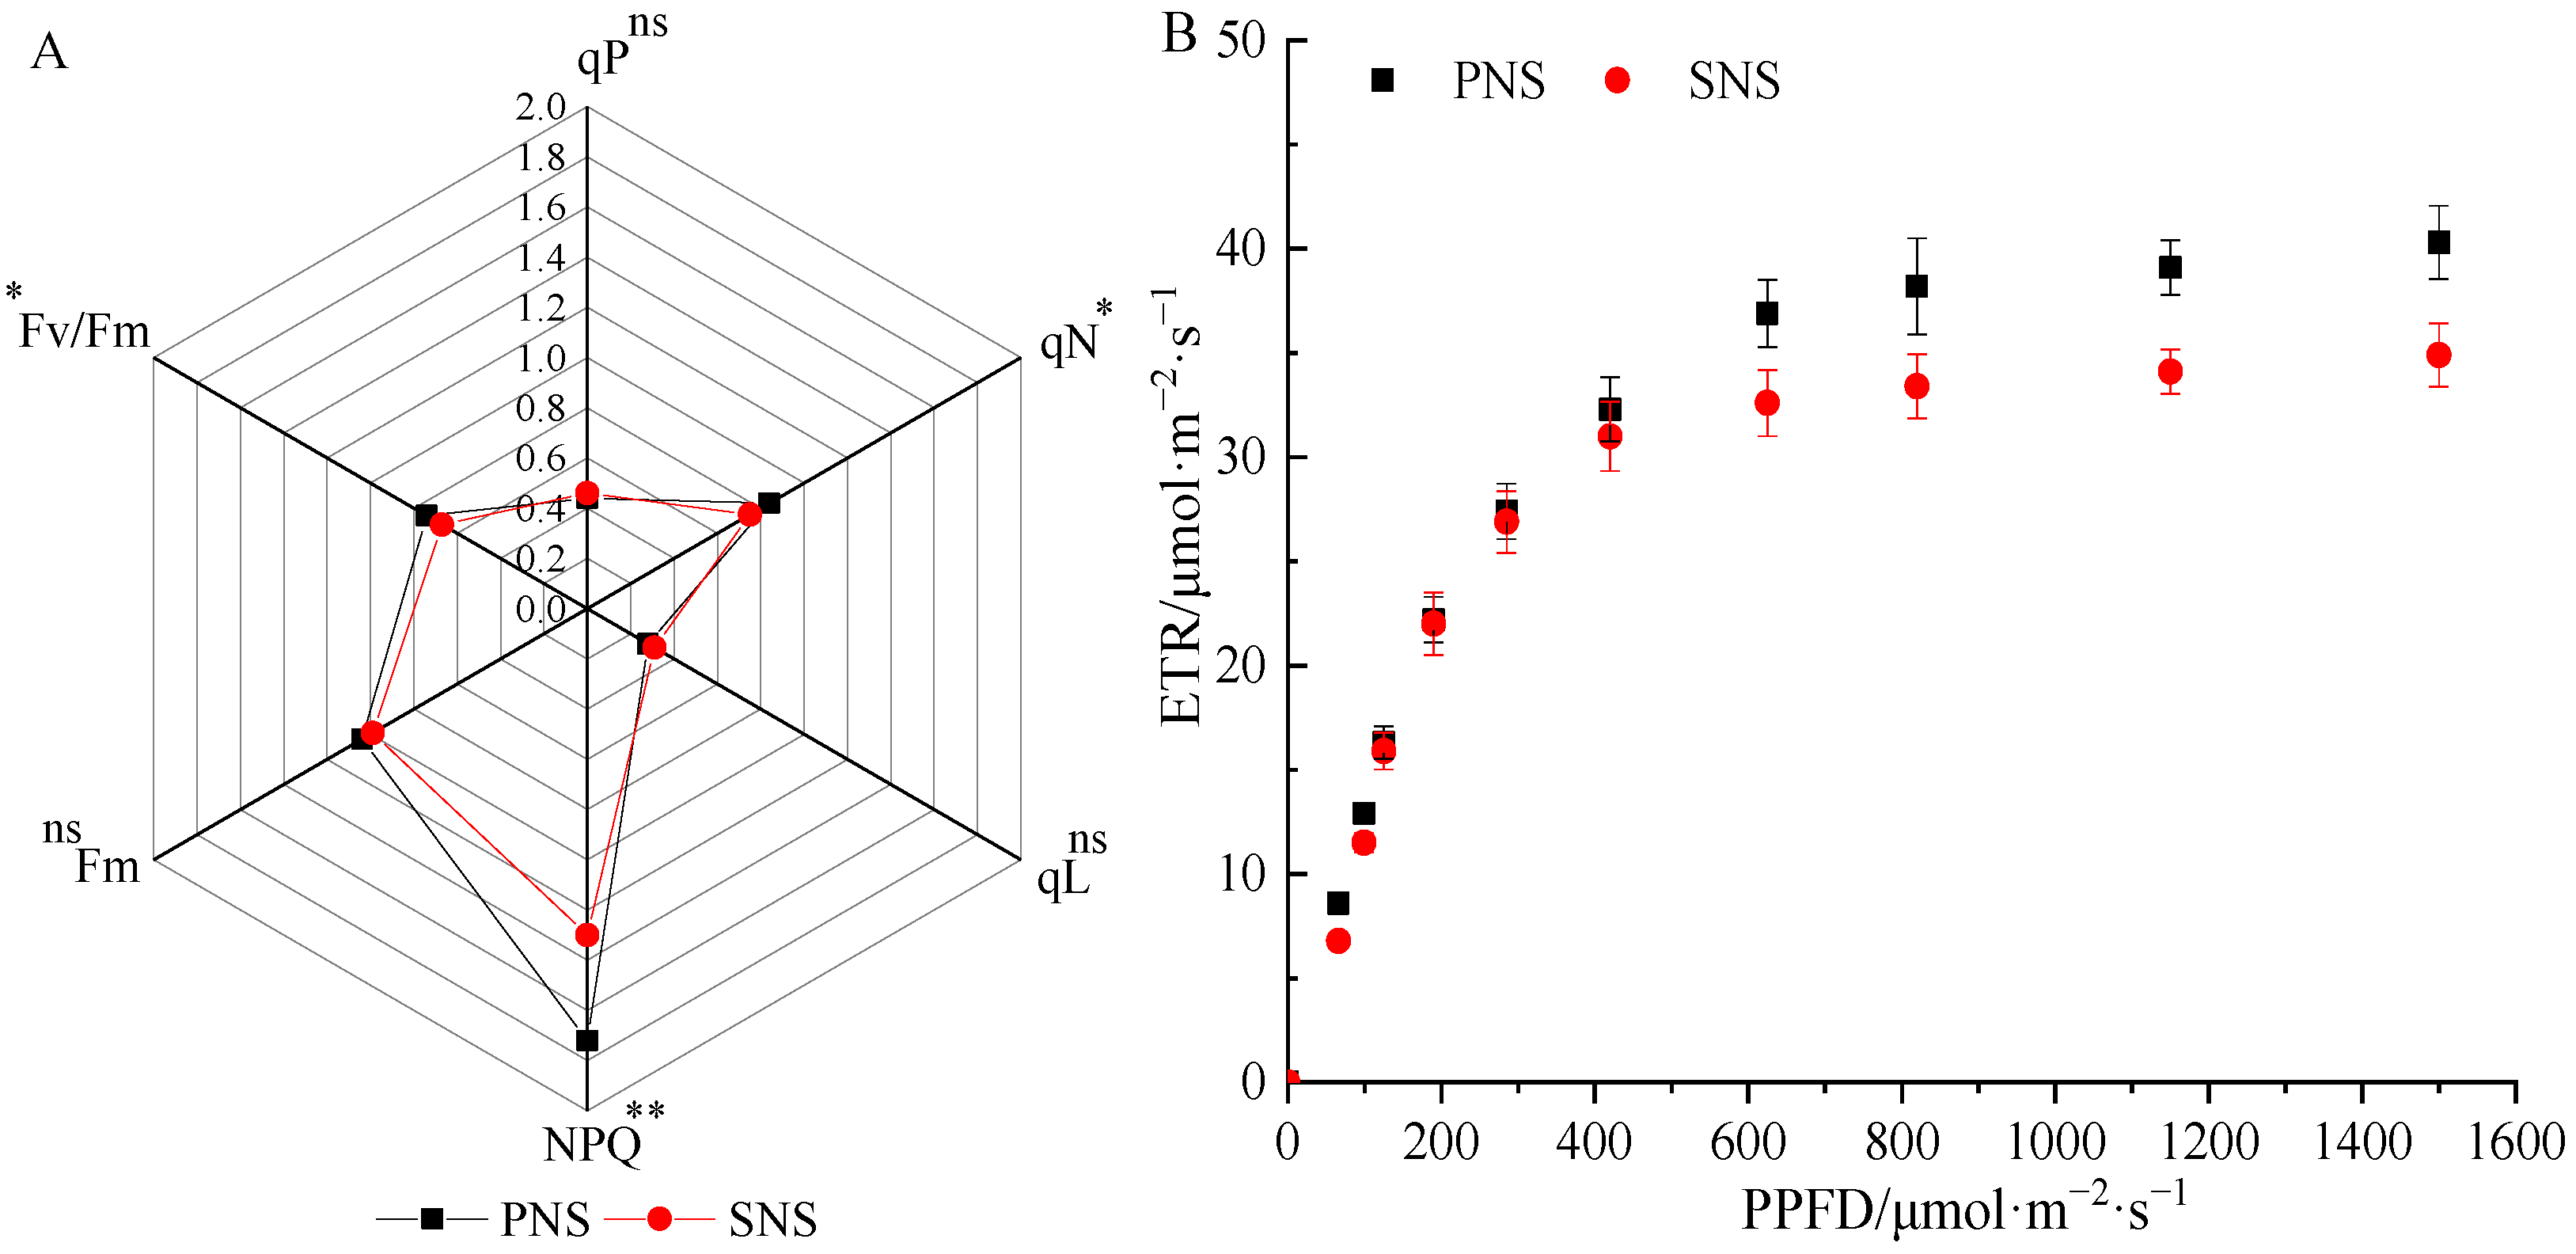
The maximum fluorescence yield (Fm) and photochemical quenching (qP and qL) of primary and secondary needles were not significantly different, while the nonphotochemical quenching (qN and NPQ) was greater in primary needles than in secondary needles, and the potential maximum photochemical efficiency (Fv/Fm) of primary needles was also higher (Figure 4A). In addition, the electron transfer rate (ETR) of primary and secondary needles was different in response to light intensities (Figure 4B). The ETR in primary needles tended to be stable when the light intensity reached 780 μmol·m−2·s−1, while that in the secondary needles was 550 μmol·m−2·s−1.
The heteroblastic foliage significantly affected the gas exchange parameter of P. massoniana seedlings, as shown in Table 1. The primary needles contained higher Pn, Gs, Tr, WUEi, and Ls and significantly lower Ci than those of secondary needles (p < 0.05). The primary needles had a higher net photosynthetic rate than that of the secondary needles and the absorption rate of CO2 was improved by increasing the stomatal conductance.
3.2. Effects of Heteroblastic Foliage on the Non-Structural Carbohydrates and Biomass Accumulation in Different Organs
As shown in Figure 5A, fructose mainly accumulated in the leaf tissues of the P. massoniana seedlings, and the SNS was greater than the PNS, which accounted for 60.57% and 57.78% of the fructose content in the whole seedling, respectively. However, there was no significant difference in the fructose content of the roots and stems of PNS and SNS. The glucose in all organs of the SNS was significantly higher than that in the PNS (Figure 5B). Among the content tested, the difference in leaf tissues contents was the most obvious, and the glucose in SNS reached 9.6 mg·g−1, which was 4.14 times that in PNS. Sucrose mainly accumulated in the roots and stems of P. massoniana seedlings, and it was lower in the leaf tissues (Figure 5C). However, sucrose accumulation in the leaf tissues of PNS was greater than that in SNS, and there was no significant difference for the roots and stems. In addition, heteroblastic foliage affected the accumulation of soluble sugar in the leaf tissues of P. massoniana seedlings (Figure 5D), and soluble sugar in SNS showed an increasing trend. Furthermore, starch was significantly greater in the roots of SNS compared with PNS (Figure 5E); a similar variation was observed for NSC in the leaf tissues and roots except for the stems (Figure 5F).
The dry mass of each organ tissue (root, stem, and leaf) in SNS was 1.95, 1.86, and 2.56 times that of PNS, respectively (Table 2). The results indicated that the SNS had a higher accumulation of biomass. In addition, it was found that the biomass harvest of P. massoniana seedlings was mainly stored in needle leaves, in which the leaf dry mass weight of PNS and SNS accounted for 47.06% and 54.30% of the whole plant, respectively, indicating the leaf tissue biomass was the main part of the seedling, thus the roots and stems have the least stock supply.
3.3. Path Analysis for the Effect of Relative Factors on the Total Biomass Accumulation
To identify the main factors affecting the biomass accumulation of PNS and SNS, gas exchange parameters (Pn, Gs, Ci, Tr, WUEi, and Ls), chlorophyll (Chl a, Chl b, Chl C, and Chl a/b), and chlorophyll fluorescence parameters (Fm, Fv/Fm, qP, qN, qL, and NPQ) were analyzed with the dry weight, fructose, glucose, sucrose, soluble sugar, starch, and NSC of the plants by principal component analysis (PCA), and some indexes were selected for further correlation and path analysis.
PCA shows the effects of heteroblastic foliage on various physiological parameters in leaf tissues (Figure 6A), roots (Figure 6B), and stems (Figure 6C). The heteroblastic foliage and physiological parameters were added to two major principal components (PC1 and PC2), accounting for 78.25%, 77.81%, and 74.31% of the total variance in different organs, respectively. Furthermore, PNSs and SNSs were added to the positive and negative sides of PC1. The main indexes were also distributed on both sides, and the angle separation between the indexes and the axis indicates the degree of correlation. The results showed that Chl a/b, Pn, WUEi, NPQ, Fv/Fm, Chl a, Chl C, SSS, Car, and LS were related to the biomass accumulation of PNS, while qL, Tr, Gs, Ci, LG, LW, LSS, LF, SG, SW, RW, RG, RF, RSt, Ls, and NSC were related to the SNS.
Pearson correlation analysis was performed for the selected indexes and total biomass weight (TDW) of PNS and SNS (Table 3). The TDW of PNS was significantly positively correlated with Pn (p < 0.01) and was positively correlated with Chl a, Chl C, and Car (p < 0.05) but had a significantly negative correlation with NPQ (p < 0.05). In addition, Pn was significantly positively correlated with LS, photosynthetic pigments were positively correlated with SSS, and NPQ was significantly negatively correlated with SSS.
Across all data, the TDW of SNS was positively correlated with LG, LW, SW, RW, and NSC but had a significantly negative correlation with qL and Tr (Table 4). However, it is easy to ignore the relative importance of indicators when only the correlation coefficient is used to analyze the relationship between various indicators and biomass. Therefore, this study adopted multiple linear regression-path analysis to split the relative coefficient into the direct effect of independent variables on dependent variables and the indirect effect of independent variables, such as the mutual results, on dependent variables. This analysis method is conducive to more accurately elaborating the essential relationship between multiple independent and dependent variables.
Path analysis showed that the increased net photosynthetic rate (Pn), photosynthetic pigments, and the soluble sugar of stem (SSS) had positive effects on PNS biomass accumulation, and photosynthetic pigments were beneficial to soluble sugar accumulation in the stem (Figure 7). In contrast, nonphotochemical quenching (NPQ), leaf instantaneous water use efficiency (WUEi), and limiting stomata (Ls) had a negative effect on the PNS biomass, Pn, and SSS. The results indicated that the increase in thermal dissipation, water deficit, and stomatal closure significantly limited the photosynthetic efficiency of PNS, which resulted in a decrease in the biomass accumulation rate.
Furthermore, the factors that promoted and contributed to SNS biomass accumulation included dry mass, non-structural carbohydrates in different organs, and glucose in leaves. However, the transpiration rate (Tr) and photochemical quenching (qL) inhibited SNS biomass accumulation and had especially negative effects on the growth of stems and roots and on glucose synthesis in leaves (Figure 8). Importantly, the growth strategy of SNS is to promote biomass accumulation by increasing the proportion of dry matter distribution in stems and roots, and the increase in leaf glucose content is more conducive to respiration. Moreover, maintaining the water balance in vivo is beneficial for photochemical reaction efficiencies.
4. Discussion
4.1. Physiological Traits Related to Photosynthesis in Heteroblastic Foliage
Heteroblastic foliar change the characteristics of photosynthesis and energy distribution. In our study with P. massoniana seedlings, the primary needles, because of their higher photosynthetic rates and efficiency of water usage (Table 2), experienced enhance seedling establishment and early growth. In contrast, the limitation of the photochemical activity in the assimilation process of secondary needles decreased the CO2 utilization rate, causing a large accumulation of CO2 in the cells and a reduced transpiration rate due to stomatal limitation (Table 2). Therefore, we infer that secondary needles, which are more conservative when acquiring resources, have a more water-stress-tolerant regulation strategy through adult foliage in comparison to that of primary needles. This conclusion is similar to a previous study on Acacia koa [43] and Mediterranean pines [37]. High photosynthetic rates require high costs, e.g., a high respiration rate, light capture ability, and photochemical efficiency [44,45]. Moreover, the seedling growth response to light manipulation should be better assessed by analyzing photosynthetic leaf traits that describe light interception and are efficient, since foliar plasticity has an intrinsic effect on the seedling growth–survival trade-off [46]. The coordination between efficiency and the ability to capture light can reflect the photosynthetic energy distribution pattern under different light responses [47]. Previous studies have found that the primary needles of P. massoniana are rhomboidal or sectorial in shape, in strong contrast to the semielliptical cross-sectional features of secondary needles, which are similar to heteroblastic leaves of Picea abies; therefore, a greater efficiency of light interception exists in primary needles than in secondary needles [48].
In general, the absorption of incident light depends on the concentration and type of pigments in the foliage [49]. Our findings indicated that the photosynthetic pigment concentrations varied between primary and secondary needles, and secondary needles had lower levels of chlorophyll (Chl a and Chl C) and lower Chl a/Chl b ratios (Figure 3), suggesting a decrease in the proportion of chlorophyll in the light-harvesting antenna [50]. In addition, the decrease can be interpreted as an effective photoprotection mechanism to prevent the absorbed excess energy from damaging the photosystems under full sun conditions [51]. Moreover, an increase in the mutual shading of secondary needles may lead to a lower photoinhibition to intense light radiation compared to that of the primary needles, which grow in a single spiral arrangement [17]. Chlorophyll fluorescence parameters, as an internal probe of the relationship between plant photosynthesis and environment, can sensitively reflect changes in photosynthesis [52]. Our results showed that primary needles had higher potential maximum photochemical efficiency (Fv/Fm), which is consistent with the results of their higher photosynthetic rate and chlorophyll concentrations (Figure 4A). However, the higher nonphotochemical quenching (NPQ) observed for primary needles suggests they have a stronger capacity for thermally dissipating excess energy in PNS under intense light radiation (Figure 4A) [41]. Meanwhile, the higher ETRmax in primary needles indicated that PNSs need more light to reach light saturation than that of SNSs (Figure 4B). Therefore, it could be inferred that sudden decreases in light may not be conducive to the growth of PNS. The results are similar to those of the Quevedo-Rojas study on leaf acclimation strategies of saplings with different shade tolerances in cloud forests [53].
4.2. Variations in the NSC and Biomass Allocation of Heteroblastic Foliage Seedlings
The formation of heteroblastic foliage was only developmentally delayed and was not due to the actual timing; thus, secondary needle germination can strongly affect the metabolic activity and resource reallocation in seedlings [54]. Our results showed that with the increase in SNS soluble sugar in leaves, monosaccharides (including fructose and glucose) increased while sucrose decreased, which can more greatly improve the protection of plant cells under stress compared to that seen with PNS (Figure 5A–D). In addition, secondary needles enhanced the proportion of starch storage in the roots of seedlings (Figure 5E), and the accumulation of NSCs was organ specific between PNS and SNS, significantly increasing in the leaves and roots of SNS (Figure 5F). These results indicate that the photosynthetic product of sucrose in secondary needles (the source organ) was easily decomposed into fructose and glucose, and glucose was transported to the roots and stems (reservoir organs) for storage; however, excessive glucose in roots was synthesized into starch storage, ensuring the rapid growth of the SNS root system, and NSCs were preferentially allocated to the roots to promote water and nutrient absorption, which is consistent with our previous study finding that SNSs have strong root characteristics [55].
In contrast to NSC partitioning, the biomass partitioning varied significantly (Table 2). Pine seedlings exhibit pronounced morphological and structural changes from primary to secondary needles in the first year, which may result in different carbon demands as leaves differ in both investment costs and photosynthetic efficiency [11]. We found that compared with PNS, SNS increased the biomass allocated to the leaves (from 47.06% to 54.30%) and enhanced the overall ability of photosynthetic organs, which can lay a foundation for carbon accumulation and thus provide a certain material guarantee for the growth of seedlings. We suspect that mutual shading of secondary needles between fascicles was better at blocking strong light, and in light-limited conditions, seedlings increase carbon allocation of each organ to enhance the efficiency of resource utilization [56]. According to the results, we concluded that although the photosynthetic capacity per unit area was greater in primary needles than in secondary (two-needle fascicles) needles, it is possible that photosynthesis of the whole plant was lower. Our findings concluded that primary needles provide the early seedling stage with necessary carbon building for establishing stable growth systems and later on for development for more durable secondary needles which are more resistant to mechanical stress.
4.3. The Key Factors Effecting Biomass Accumulation
The heteroblastic foliage studied has different strategies related to biomass and physiological traits, PNS and SNS, from two well-separated clusters located on the positive and negative sides of PC1 (Figure 6). In addition, Pearson’s correlation coefficient (Table 3 and Table 4) and path analysis (Figure 7 and Figure 8) revealed close relationships among the various indicators, showing that different factors were involved in the regulation of biomass accumulation in PNS and SNS. Although correlation analysis reflects the degree of correlation between various factors to some extent, biomass is a comprehensive character, and simple correlation analysis cannot truly reflect the correlation between each character and the biomass [57]. Path analysis can effectively express the direct effect of related variables on dependent variables and estimate the indirect effect of derived variables on dependent variables, which makes the statistical analysis of multivariable data more reasonable [58,59].
In this study, we found that photosynthetic pigments (Car, Chl a, and Chl C) had a direct positive effect on PNS biomass and promoted biomass by indirectly increasing soluble sugar synthesis in stems. The net photosynthetic rate (Pn) was the main physiological factor that determined PNS biomass accumulation, and the decision coefficient reached 1.078. In addition, the leaf instantaneous water use efficiency (WUEi), limiting stomata (Ls), and non-photochemical quenching (NPQ) had a direct negative effect on PNS biomass accumulation, which inhibited photosynthesis to limit seedling growth. The results suggest that thermal dissipation (TD) caused by photoinhibition and water deficit were the main limiting factors of carbon accumulation in PNS. Relative to the SNS, NSC storage in each organ was beneficial to biomass accumulation, while water transpiration and photochemical quenching caused by excessive temperature had negative effects.
5. Conclusions
This study provided valuable information on the change in photosynthesis capacity and non-structural carbohydrate accumulation in each organ for the primary and secondary needles of P. massoniana seedlings, and it would be interesting to more thoroughly examine the factors determining acclimation in heteroblastic foliage. It was found that primary needles, such as juvenile foliage, have higher photosynthetic rates per unit area and lower construction costs, which can enhance the establishment and early growth of seedlings. In contrast, secondary needles, such as adult foliage, are more conservative in acquiring resources, reflecting the advantage of a more stress-tolerant strategy. However, the non-photochemical quenching caused by photoinhibition and the water deficit caused by the external environment are the main factors limiting the biomass accumulation of PNS. Moreover, more NSCs were allocated to the leaves and roots of SNS to fuel the need for greater carbon availability for the growth of new biomass, and this contributes significantly to the later growth and resource acquirement.
Author Contributions
H.W.: methodology, field and lab experiments, formal analysis, writing—original draft, writing—review and editing. F.W.: methodology, conceptualization, project administration, writing—original draft, writing—review and editing, supervision. M.L.: lab experiments. D.L.: field experiments. G.D.: methodology, resources, revised and improved the manuscript, supervision. All authors have read and agreed to the published version of the manuscript.
Funding
The study was funded by the Guizhou Science and Technology Department under Grant ([2018]5261); National Natural Science Foundation of China under Grant (31660201); The first-class discipline construction project of Guizhou Province under Grant (GNYL[2017]007); Guizhou Province High-level Innovative Talents Project ([2015]4003); and Postgraduate Research Project of Guizhou Province under Grant (YJSCXJH [2019]020).
Institutional Review Board Statement
Not applicable.
Informed Consent Statement
Not applicable.
Data Availability Statement
The data supporting the conclusions of this article will be made available by authors, without undue reservation.
Conflicts of Interest
The authors declare that the research was conducted in the absence of any commercial or financial relationships that could be construed as a potential conflict of interest.
References
- Wright, S.D.; McConnaughay, K. Interpreting phenotypic plasticity: The importance of ontogeny. Plant Species Biol. 2002, 17, 119–131. [Google Scholar] [CrossRef]
- Jasińska, A.K.; Boratyńska, K.; Sobierajska, K.; Romo, A.; Ok, T.; Kharat, M.B.D.; Boratyński, A. Relationships among Cedrus libani, C. brevifolia and C. atlantica as revealed by the morphological and anatomical needle characters. Plant Syst. Evol. 2013, 299, 35–48. [Google Scholar]
- Zotz, G.; Wilhelm, K.; Becker, A. Heteroblasty—A review. Bot. Rev. 2011, 77, 109–151. [Google Scholar] [CrossRef]
- Climent, J.; Chambel, M.R.; Pardos, M.; Lario, F.; Villar-Salvador, P. Biomass allocation and foliage heteroblasty in hard pine species respond differentially to reduction in rooting volume. Eur. J. For. Res. 2011, 130, 841–850. [Google Scholar] [CrossRef]
- Climent, J.; San-Martín, R.; Chambel, M.R.; Mutke, S. Ontogenetic differentiation between Mediterranean and Eurasian pines (sect. Pinus) at the seedling stage. Trees 2010, 25, 175–186. [Google Scholar]
- Cannell, M.; Thompson, S.; Lines, R. Analysis of inherent differences in shoot growth within some north temperate conifers. In Tree Physiology and Yield Improvement; Academic Press: London, UK, 1976; pp. 173–205. [Google Scholar]
- Wells, C.L.; Pigliucci, M. Adaptive phenotypic plasticity: The case of heterophylly in aquatic plants. Perspect. Plant Ecol. Evol. Syst. 2000, 3, 1–18. [Google Scholar] [CrossRef]
- López, R.; Climent, J.; Gil, L. Intraspecific variation and plasticity in growth and foliar morphology along a climate gradient in the Canary Island pine. Trees 2009, 24, 343–350. [Google Scholar] [CrossRef]
- Pritzkow, C.; Williamson, V.; Szota, C.; Trouvé, R.; Arndt, S.K. Phenotypic plasticity and genetic adaptation of functional traits influences intra-specific variation in hydraulic efficiency and safety. Tree Physiol. 2020, 40, 215–229. [Google Scholar] [CrossRef] [PubMed]
- Climent, J.; Dantas, A.K.; Alia, R.; Majada, J. Clonal variation for shoot ontogenetic heteroblasty in maritime pine (Pinus pinaster Ait.). Trees 2013, 27, 1813–1819. [Google Scholar] [CrossRef]
- Pardos, M.; Calama, R.; Climent, J. Difference in cuticular transpiration and sclerophylly in juvenile and adult pine needles relates to the species-specific rates of development. Trees-Struct. Funct. 2009, 23, 501–508. [Google Scholar] [CrossRef]
- Meng, J.; Chen, X.; Huang, Y.; Wang, L.; Xing, F.; Li, Y. Environmental contribution to needle variation among natural populations of Pinus tabuliformis. J. For. Res. 2019, 30, 1311–1322. [Google Scholar] [CrossRef]
- Xu, Y.; Woeste, K.; Cai, N.; Kang, X.; Li, G.; Chen, S.; Duan, A. Variation in needle and cone traits in natural populations of Pinus yunnanensis. J. For. Res. 2016, 27, 41–49. [Google Scholar] [CrossRef]
- Zhang, M.; Meng, J.-X.; Zhang, Z.-J.; Zhu, S.-L.; Li, Y. Genetic analysis of needle morphological and anatomical traits among nature populations of Pinus tabuliformis. J. Plant Stud. 2017, 6, 62–75. [Google Scholar] [CrossRef]
- Huang, Y.; Mao, J.; Chen, Z.; Meng, J.; Xu, Y.; Duan, A.; Li, Y. Genetic structure of needle morphological and anatomical traits of Pinus yunnanensis. J. For. Res. 2016, 27, 13–25. [Google Scholar] [CrossRef]
- Wang, N.; Palmroth, S.; Maier, C.A.; Domec, J.C.; Oren, R. Anatomical changes with needle length are correlated with leaf structural and physiological traits across five Pinus species. Plant Cell Environ. 2019, 42, 1690–1704. [Google Scholar] [CrossRef]
- Kuusk, V.; Niinemets, Ü.; Valladares, F. A major trade-off between structural and photosynthetic investments operative across plant and needle ages in three Mediterranean pines. Tree Physiol. 2018, 38, 543–557. [Google Scholar] [CrossRef] [PubMed] [Green Version]
- Signori-Müller, C.; Oliveira, R.S.; de Vasconcellos Barros, F.; Tavares, J.V.; Gilpin, M.; Diniz, F.C.; Zevallos, M.J.M.; Yupayccana, C.A.S.; Acosta, M.; Bacca, J. Non-structural carbohydrates mediate seasonal water stress across Amazon forests. Nat. Commun. 2021, 12, 2310. [Google Scholar] [CrossRef] [PubMed]
- Guo, X.; Peng, C.; Li, T.; Huang, J.; Song, H.; Zhu, Q.; Wang, M. The effects of drought and re-watering on non-structural carbohydrates of Pinus tabulaeformis seedlings. Biology 2021, 10, 281. [Google Scholar] [CrossRef]
- Deng, X.; Xiao, W.; Shi, Z.; Zeng, L.; Lei, L. Combined effects of drought and shading on growth and non-structural carbohydrates in Pinus massoniana Lamb. seedlings. Forests 2020, 11, 18. [Google Scholar] [CrossRef] [Green Version]
- Furze, M.E.; Trumbore, S.; Hartmann, H. Detours on the phloem sugar highway: Stem carbon storage and remobilization. Curr. Opin. Plant Biol. 2018, 43, 89–95. [Google Scholar] [CrossRef]
- Bacelar, E.A.; Moutinho-Pereira, J.M.; Gonçalves, B.C.; Ferreira, H.F.; Correia, C.M. Changes in growth, gas exchange, xylem hydraulic properties and water use efficiency of three olive cultivars under contrasting water availability regimes. Environ. Exp. Bot. 2007, 60, 183–192. [Google Scholar] [CrossRef]
- Umaña, M.N.; Cao, M.; Lin, L.; Swenson, N.G.; Zhang, C. Trade-offs in above-and below-ground biomass allocation influencing seedling growth in a tropical forest. J. Ecol. 2021, 109, 1184–1193. [Google Scholar] [CrossRef]
- Mariotti, B.; Maltoni, A.; Jacobs, D.F.; Tani, A. Container effects on growth and biomass allocation in Quercus robur and Juglans regia seedlings. Scand. J. For. Res. 2015, 30, 401–415. [Google Scholar]
- Dominguez-Lerena, S.; Sierra, N.H.; Manzano, I.C.; Bueno, L.O.; Rubira, J.P.; Mexal, J. Container characteristics influence Pinus pinea seedling development in the nursery and field. For. Ecol. Manag. 2006, 221, 63–71. [Google Scholar] [CrossRef]
- Puglielli, G. Global patterns of biomass allocation in woody species with different tolerances of shade and drought: Evidence for multiple strategies. New Phytol. 2021, 229, 308–322. [Google Scholar] [CrossRef]
- Umaña, M.N.; Swenson, N.G.; Marchand, P.; Cao, M.; Lin, L.; Zhang, C. Relating leaf traits to seedling performance in a tropical forest: Building a hierarchical functional framework. Ecology 2021, 102, e03385. [Google Scholar] [CrossRef]
- Forster, M.A.; Bonser, S.P. Heteroblastic development and the optimal partitioning of traits among contrasting environments in Acacia implexa. Ann. Bot. 2009, 103, 95–105. [Google Scholar] [CrossRef] [Green Version]
- Ding, G.; Zhou, Z.; Wang, Z. Cultivation and Utilization of Pulpwood Stand for Pinus massoniana; China Forestry Publishing House: Beijing, China, 2006. (In Chinese) [Google Scholar]
- Zhang, Y.; Zhou, Z.; Yang, Q. Genetic variations in root morphology and phosphorus efficiency of Pinus massoniana under heterogeneous and homogeneous low phosphorus conditions. Plant Soil 2013, 364, 93–104. [Google Scholar] [CrossRef]
- Wang, H.; Wu, F.; Zhu, X.; Xie, W. Effects of leaf types on growth and chlorophyll fluorescence characteristics in Pinus massoniana seedlings. Sci. Silv Sin. 2019, 55, 183–192. (In Chinese) [Google Scholar]
- Wang, H.; Wu, F.; Wu, C.; Yu, S.; Zhu, X.; Xie, W. Growth and physiological responses of seedlings with different leaf shapes to drought and re-watering in Pinus massoniana. J. Northeast For. Univ. 2018, 46, 1–6. (In Chinese) [Google Scholar]
- Wang, H.; Wu, F.; Li, M.; Zhu, X.; Shi, C.; Ding, G. Morphological and physiological responses of Pinus massoniana seedlings to different light gradients. Forests 2021, 12, 523. [Google Scholar] [CrossRef]
- Liu, Z.; Jiang, F.; Li, F.; Jin, G. Coordination of intra and inter-species leaf traits according to leaf phenology and plant age for three temperate broadleaf species with different shade tolerances. For. Ecol. Manag. 2019, 434, 63–75. [Google Scholar] [CrossRef]
- Guimarães, Z.T.M.; Dos Santos, V.A.H.F.; Nogueira, W.L.P.; de Almeida Martins, N.O.; Ferreira, M.J. Leaf traits explaining the growth of tree species planted in a Central Amazonian disturbed area. For. Ecol. Manag. 2018, 430, 618–628. [Google Scholar] [CrossRef]
- Hódar, J.A.; Zamora, R.; Castro, J.; Gómez, J.M.; García, D. Biomass allocation and growth responses of Scots pine saplings to simulated herbivory depend on plant age and light availability. Plant Ecol. 2008, 197, 229–238. [Google Scholar] [CrossRef]
- Kuusk, V.; Niinemets, Ü.; Valladares, F. Structural controls on photosynthetic capacity through juvenile-to-adult transition and needle ageing in Mediterranean pines. Funct. Ecol. 2018b, 32, 1479–1491. [Google Scholar] [CrossRef]
- Fernández-Marín, B.; Ruiz-Medina, M.A.; Miranda, J.C.; González-Rodríguez, Á.M. Coexistent heteroblastic needles of adult Pinus canariensis C.Sm. ex DC. in buch trees differ structurally and physiologically. Forests 2021, 12, 341. [Google Scholar] [CrossRef]
- Dere, S.; Gunes, T.; Sivaci, R. Spectrophotometric determination of chlorophyll-A, B and total carotenoid contents of some algae species using different solvents. Turk. Bot. 1998, 22, 13–17. [Google Scholar]
- Li, M.; Wang, H.; Zhao, X.; Lu, Z.; Sun, X.; Ding, G. Role of suillus placidus in improving the drought tolerance of masson pine (Pinus massoniana Lamb.) seedlings. Forests 2021, 12, 332. [Google Scholar] [CrossRef]
- Porcar-Castell, A. A high-resolution portrait of the annual dynamics of photochemical and non-photochemical quenching in needles of Pinus sylvestris. Physiol. Plant. 2011, 143, 139–153. [Google Scholar] [CrossRef]
- Da Silveira, L.C.I.; Brasileiro, B.P.; Kist, V.; Weber, H.; Daros, E.; Peternelli, L.A.; Barbosa, M.H.P. Selection strategy in families of energy cane based on biomass production and quality traits. Euphytica 2015, 204, 443–455. [Google Scholar] [CrossRef]
- Pasquet-Kok, J.; Creese, C.; Sack, L. Turning over a new ‘leaf’: Multiple functional significances of leaves versus phyllodes in Hawaiian Acacia koa. Plant Cell Environ. 2010, 33, 2084–2100. [Google Scholar] [CrossRef]
- Liu, S.; Luo, Y.; Yang, R.; He, C.; Cheng, Q.; Tao, J.; Ren, B.; Wang, M.; Ma, M. High resource-capture and -use efficiency, and effective antioxidant protection contribute to the invasiveness of Alnus formosana plants. Plant Physiol. Biochem. 2015, 96, 436–447. [Google Scholar] [CrossRef]
- Dias, A.N.; Siqueira-Silva, A.I.; Souza, J.P.; Kuki, K.N.; Pereira, E.G. Acclimation responses of macaw palm seedlings to contrasting light environments. Sci. Rep. 2018, 8, 15300. [Google Scholar] [CrossRef]
- Santos, V.; Ferreira, M. Are photosynthetic leaf traits related to the first-year growth of tropical tree seedlings? A light-induced plasticity test in a secondary forest enrichment planting. For. Ecol. Manag. 2020, 460, 117900. [Google Scholar] [CrossRef]
- Li, Y.; Xin, G.; Wei, M.; Shi, Q.; Yang, F.; Wang, X. Carbohydrate accumulation and sucrose metabolism responses in tomato seedling leaves when subjected to different light qualities. Sci. Hortic. 2017, 225, 490–497. [Google Scholar] [CrossRef]
- Niinemets, Ü. Acclimation to low irradiance in Picea abies: Influences of past and present light climate on foliage structure and function. Tree Physiol. 1997, 17, 723–732. [Google Scholar] [CrossRef] [Green Version]
- Renner, S.S.; Zohner, C.M. The occurrence of red and yellow autumn leaves explained by regional differences in insolation and temperature. New Phytol. 2019, 224, 1464–1471. [Google Scholar] [CrossRef] [Green Version]
- Chukhutsina, V.U.; Liu, X.; Xu, P.; Croce, R. Light-harvesting complex II is an antenna of photosystem I in dark-adapted plants. Nat. Plants 2020, 6, 860–868. [Google Scholar] [CrossRef] [PubMed]
- Takahashi, S.; Badger, M.R. Photoprotection in plants: A new light on photosystem II damage. Trends Plant Sci. 2011, 16, 53–60. [Google Scholar] [CrossRef] [PubMed]
- Ma, J.; Lv, C.; Xu, M.; Hao, P.; Wang, Y.; Shen, W.; Gao, Z.; Chen, G.; Lv, C. Analysis of chlorophyll a fluorescence and proteomic differences of rice leaves in response to photooxidation. Acta Physiol. Plant. 2017, 39, 46. [Google Scholar] [CrossRef]
- Quevedo-Rojas, A.; Garcia-Nunez, C.; Jerez-Rico, M.; Jaimez, R.; Schwarzkopf, T. Leaf acclimation strategies to contrasting light conditions in saplings of different shade tolerance in a tropical cloud forest. Funct. Plant Biol. 2018, 45, 968–982. [Google Scholar] [CrossRef]
- Riikonen, J. Pre-cultivation of Scots pine and Norway spruce transplant seedlings under four different light spectra did not affect their field performance. New For. 2016, 47, 607–619. [Google Scholar] [CrossRef]
- Tu, J.; Wu, F.; Sun, X.; Wang, H.; Shi, C. Community structure characteristics of ectomycorrhizal fungi in different leaf type seedlings of Pinus massoniana. Mycosystema 2021, 40, 124–134. (In Chinese) [Google Scholar]
- Poorter, L.; Castilho, C.V.; Schietti, J.; Oliveira, R.S.; Costa, F.R. Can traits predict individual growth performance? A test in a hyperdiverse tropical forest. New Phytol. 2018, 219, 109–121. [Google Scholar] [CrossRef] [PubMed] [Green Version]
- Trautenmüller, J.W.; Netto, S.P.; Balbinot, R.; Dalla Corte, A.P.; Borella, J. Path analysis applied to evaluation of biomass estimates in subtropical forests at Brazil. Floresta 2019, 49, 587–596. [Google Scholar] [CrossRef]
- Gong, Y.-H.; Zhao, D.-M.; Ke, W.-B.; Fang, C.; Pei, J.-Y.; Sun, G.-J.; Ye, J.-S. Legacy effects of precipitation amount and frequency on the aboveground plant biomass of a semi-arid grassland. Sci. Total Environ. 2020, 705, 135899. [Google Scholar] [CrossRef]
- Hodgson-Kratky, K.; Papa, G.; Rodriguez, A.; Stavila, V.; Simmons, B.; Botha, F.; Furtado, A.; Henry, R. Relationship between sugarcane culm and leaf biomass composition and saccharification efficiency. Biotechnol. Biofuels 2019, 12, 247. [Google Scholar] [CrossRef] [Green Version]
Figure 1.
Morphological observation of the primary needle seedlings and secondary needle seedlings. The seedlings that contained all primary needles were labeled primary needle seedlings (PNSs); the primary needles were withered and replaced by secondary needles (secondary needle seedlings, SNSs).
Figure 1.
Morphological observation of the primary needle seedlings and secondary needle seedlings. The seedlings that contained all primary needles were labeled primary needle seedlings (PNSs); the primary needles were withered and replaced by secondary needles (secondary needle seedlings, SNSs).

Figure 2.
Graph of path analysis. The arrows in both directions indicate mutual association between variables, which is determined by the correlation coefficient (ri,j). The arrows in a single direction represent the direct effect, which are determined by the path coefficient (Pi,j).
Figure 2.
Graph of path analysis. The arrows in both directions indicate mutual association between variables, which is determined by the correlation coefficient (ri,j). The arrows in a single direction represent the direct effect, which are determined by the path coefficient (Pi,j).

Figure 3.
Photosynthetic pigment content of P. massoniana in primary and secondary needles. PNS, primary needle seedling; SNS, secondary needle seedling. Chl a, chlorophyll a; Chl b, chlorophyll b; Chl C, total chlorophyll; Car, carotenoids; Chl a/b, ratio of chlorophyll a to chlorophyll b. * p < 0.05, single asterisks indicate a significant difference at 0.05; ** p < 0.01, double asterisks indicate a significant difference at 0.01; ns, no significant.

Figure 4.
Differences in the chlorophyll fluorescence parameters of heteroblastic foliage. PNS, primary needle seedling; SNS, secondary needle seedling. (A) Fluorescence induction parameters. Fm, maximum fluorescence yield; Fv/Fm, potential maximum photochemical efficiency; qP and qL, photochemical quenching coefficient; qN and NPQ, non-photochemical quenching coefficient. (B) Rapid optical response curves. ETR, relative electron transfer rate. * p < 0.05, single asterisks indicate a significant difference at 0.05; ** p < 0.01, double asterisks indicate a significant difference at 0.01; ns, no significant.

Figure 5.
Effects of heteroblastic foliage on the content of non-structural carbohydrates in different organs of P. massoniana. PNS, primary needle seedling; SNS, secondary needle seedling. * p < 0.05, single asterisks indicate a significant difference at 0.05; ** p < 0.01, double asterisks indicate a significant difference at 0.01; ns, no significant. The letters denote (A) fructose; (B) glucose; (C) sucrose; (D) soluble sugar; (E) starch; (F) NSC (non-structural carbohydrate).


Figure 6.
Principal component analysis (PCA) of the biomass and physiological parameters. Symbols represent independent samples of the following different seedling types: PNS, primary needle seedling; SNS, secondary needle seedling. (A), leaf; (B), root; (C), stem. The arrows represent loadings.
Figure 6.
Principal component analysis (PCA) of the biomass and physiological parameters. Symbols represent independent samples of the following different seedling types: PNS, primary needle seedling; SNS, secondary needle seedling. (A), leaf; (B), root; (C), stem. The arrows represent loadings.

Figure 7.
Path diagrams showing the direct and indirect effects of relative factors on PNS biomass. Only the effective paths are shown in the diagram, and the useless paths were removed to simplify the path diagram. The value adjacent to each arrow indicates the standardized path coefficient. Solid and dashed arrows represent positive and negative effects, respectively.

Figure 8.
Path diagrams showing the direct and indirect effects of relative factors on SNS biomass. Only the effective paths are shown in the diagram, and the useless paths were removed to simplify the path diagram. The value adjacent to each arrow indicates the standardized path coefficient. Solid and dashed arrows represent positive and negative effects, respectively.


Table 1.
The difference of gas exchange parameter in primary and secondary needles. The values (means ± SE) followed by different letters represent significant differences at the 5% level. PNS, primary needle seedling; SNS, secondary needle seedling. Pn, net photosynthetic rate; Gs, stomatal conductance; Ci, intercellular CO2 concentration; Tr, transpiration rate; WUEi, leaf instantaneous water use efficiency; Ls, limiting stomata.
| Type | Pn/ (μmol·m−2·s−1) | Gs/ (mol·m−2·s−1) | Ci/ (μmol·mol−1) | Tr/ (mmol·m−2·s−1) | WUEi/ (μmol·mmol−1) | Ls/ (%) |
|---|---|---|---|---|---|---|
| PNS | 11.17 ± 0.75 a | 0.11 ± 0.003 a | 179.74 ± 9.49 b | 1.48 ± 0.022 a | 7.73 ± 0.50 a | 0.44 ± 0.029 a |
| SNS | 5.67 ± 0.12 b | 0.063 ± 0.0004 b | 373.05 ± 3.41 a | 0.89 ± 0.006 b | 6.37 ± 0.17 b | 0.23 ± 0.006 b |
Table 2.
Comparison of the biomass of different organs of primary needle and secondary needle seedlings. PNS, primary needle seedling; SNS, secondary needle seedling. The values (means ± SE) followed by different letters indicate significant differences at the 5% level.
Table 2.
Comparison of the biomass of different organs of primary needle and secondary needle seedlings. PNS, primary needle seedling; SNS, secondary needle seedling. The values (means ± SE) followed by different letters indicate significant differences at the 5% level.
| Type | Root Dry Mass | Stem Dry Mass | Leaf Dry Mass | Total Biomass | |||
|---|---|---|---|---|---|---|---|
| Weight (g) | Ratio (%) | Weight (g) | Ratio (%) | Weight (g) | Ratio (%) | Weight (g) | |
| PNS | 0.22 ± 0.01 b | 32.35 | 0.14 ± 0.01 b | 20.59 | 0.32 ± 0.02 b | 47.06 | 0.68 ± 0.03 b |
| SNS | 0.43 ± 0.03 a | 28.48 | 0.26 ± 0.02 a | 17.22 | 0.82 ± 0.04 a | 54.30 | 1.51 ± 0.12 a |
Table 3.
Pearson correlation coefficients among biomass accumulation and influencing factors for PNS. PNS, primary needles seedling. * p < 0.05, single asterisks indicate significant correlation; ** p < 0.01, double asterisks indicate extremely significant correlation; NS, no significant correlation.
| Factors | TDW | SSS | LS | Chl a/b | Pn | WUEi | Ls | NPQ | Fv/Fm | Chl a | Chl C | Car |
|---|---|---|---|---|---|---|---|---|---|---|---|---|
| TDW | 1 | |||||||||||
| SSS | NS | 1 | ||||||||||
| LS | NS | NS | 1 | |||||||||
| Chl a/b | NS | NS | 0.715 * | 1 | ||||||||
| Pn | 0.999 ** | NS | 0.808 * | NS | 1 | |||||||
| WUEi | NS | NS | NS | NS | 0.999 ** | 1 | ||||||
| Ls | NS | NS | NS | NS | 0.996 ** | 0.996 ** | 1 | |||||
| NPQ | −0.804 * | −0.732 * | NS | NS | NS | NS | NS | 1 | ||||
| Fv/Fm | NS | NS | NS | NS | 0.927 ** | 0.939 ** | −0.919 ** | NS | 1 | |||
| Chl a | 0.723 * | 0.989 ** | NS | NS | NS | NS | NS | 0.776 * | NS | 1 | ||
| Chl C | 0.704 * | 0.991 ** | NS | NS | NS | NS | NS | 0.747 * | NS | 0.999 ** | 1 | |
| Car | 0.716 * | 0.931 ** | NS | NS | NS | NS | NS | NS | NS | 0.913 ** | 0.917 ** | 1 |
Table 4.
Pearson correlation coefficients among biomass accumulation and influencing factors for SNS. SNS, secondary needles seedling. * p < 0.05, single asterisks indicate a significant correlation; ** p < 0.01, double asterisks indicate an extremely significant correlation; NS, no significant correlation.
| Factors | TDW | qL | Tr | Gs | Ci | LG | LW | LSS | LF | SG | SW | RW | RG | RF | RSt | NSC |
|---|---|---|---|---|---|---|---|---|---|---|---|---|---|---|---|---|
| TDW | 1 | |||||||||||||||
| qL | −0.764 * | 1 | ||||||||||||||
| Tr | −0.958 ** | 0.825 * | 1 | |||||||||||||
| Gs | NS | 0.82 * | 0.998 ** | 1 | ||||||||||||
| Ci | NS | 0.782 * | 0.859 * | 0.834 * | 1 | |||||||||||
| LG | 0.728 * | NS | NS | NS | NS | 1 | ||||||||||
| LW | 0.902 ** | NS | NS | NS | NS | NS | 1 | |||||||||
| LSS | NS | NS | NS | NS | NS | NS | NS | 1 | ||||||||
| LF | NS | NS | NS | NS | NS | NS | NS | NS | 1 | |||||||
| SG | NS | NS | NS | NS | NS | NS | NS | NS | NS | 1 | ||||||
| SW | 0.848 * | NS | NS | NS | NS | NS | 0.757 * | NS | NS | NS | 1 | |||||
| RW | 0.754 * | −0.905 ** | NS | NS | NS | −0.711 * | NS | NS | NS | NS | NS | 1 | ||||
| RG | NS | NS | NS | NS | NS | NS | NS | NS | NS | −0.959 ** | NS | NS | 1 | |||
| RF | NS | NS | NS | NS | NS | NS | −0.819 * | NS | NS | NS | NS | NS | NS | 1 | ||
| RSt | NS | NS | −0.785 * | −0.806 * | NS | NS | NS | −0.878 * | NS | NS | NS | NS | NS | NS | 1 | |
| NSC | 0.918 ** | NS | NS | NS | NS | NS | 0.775 * | NS | NS | −0.870 * | 0.804 * | 0.757 * | 0.836 * | NS | 0.710 * | 1 |
Publisher’s Note: MDPI stays neutral with regard to jurisdictional claims in published maps and institutional affiliations. |
© 2021 by the authors. Licensee MDPI, Basel, Switzerland. This article is an open access article distributed under the terms and conditions of the Creative Commons Attribution (CC BY) license (https://creativecommons.org/licenses/by/4.0/).
Share and Cite
MDPI and ACS Style
Wang, H.; Wu, F.; Li, M.; Liang, D.; Ding, G. Heteroblastic Foliage Affects the Accumulation of Non-Structural Carbohydrates and Biomass in Pinus massoniana (Lamb.) Seedlings. Forests 2021, 12, 1686. https://doi.org/10.3390/f12121686
AMA Style
Wang H, Wu F, Li M, Liang D, Ding G. Heteroblastic Foliage Affects the Accumulation of Non-Structural Carbohydrates and Biomass in Pinus massoniana (Lamb.) Seedlings. Forests. 2021; 12(12):1686. https://doi.org/10.3390/f12121686
Chicago/Turabian StyleWang, Haoyun, Feng Wu, Min Li, Daqu Liang, and Guijie Ding. 2021. "Heteroblastic Foliage Affects the Accumulation of Non-Structural Carbohydrates and Biomass in Pinus massoniana (Lamb.) Seedlings" Forests 12, no. 12: 1686. https://doi.org/10.3390/f12121686
Note that from the first issue of 2016, this journal uses article numbers instead of page numbers. See further details here.