Pipe Model Can Accurately Estimate Crown Biomass of Larch (Larix olgensis) Plantation Forest in Northeast China
by

Chenyu Huang
1, 
Yuanyuan Zhang
2,3,*,
Lu Chen
1,
Liwen Zhuang
4,
Yanliang Zhang
1 and
Weiguo Sang
1,* 1
College of Life and Environmental Sciences, Minzu University of China, Beijing 100081, China
2
Beijing Milu Ecological Research Center, Beijing 100076, China
3
Beijing Biodiversity Conservation Research Center, Beijing 100076, China
4
Heilongjiang Academy of Forestry, Harbin 150081, China
*
Authors to whom correspondence should be addressed.
Forests 2023, 14(2), 400; https://doi.org/10.3390/f14020400
Submission received: 8 December 2022
/
Revised: 27 January 2023
/
Accepted: 14 February 2023
/
Published: 16 February 2023
(This article belongs to the Section Forest Inventory, Modeling and Remote Sensing)
Abstract
:The pipe model theory has been applied to estimate allometry of trees in many regions; however, its reliability and generality need more verification for estimating crown biomass in China. In the present study, the crown biomass of Larix olgensis plantations in four sites in northeast China was estimated using the pipe model, and the correlation efficiency index of larch crown biomass for pipe model estimation was 0.953. The crown biomass of larch plantations could be accurately estimated by the tree height, crown base height, and stem area at breast height. Meanwhile, the effects of site, stand density, and age on the accuracy of crown biomass estimated by the pipe model were detected. The covariance analysis showed that the effect of age on crown biomass was 0.024, indicating that age had a significant effect on the estimation accuracy in this model, while site and stand density had no significant effects (p = 0.180 and p = 0.169). Our study showed that the crown biomass of L. olgensis plantations in northeast China could be accurately estimated using the pipe model, and we recommend considering the age effect in practical applications.
1. Introduction
Crown biomass is generally considered to be the sum of branch biomass and leaf biomass [1]. As an important component of forest biomass [2], crown biomass typically accounts for almost 30% of the aboveground biomass of adult tree species [3]. The key physiological processes of trees, such as photosynthesis, respiration, and transpiration, are operated primarily within the crown [4]. Therefore, crown biomass has a close relationship with the growth and development of trees. Accurate estimation of crown biomass can not only evaluate the vitality and growth potentiality of trees but also has important significance for assessing the net primary productivity and carbon storage in different forests [5,6].
The methods currently used to measure forest crown biomass can be divided into direct measurement and indirect estimation. The direct approach entails cutting trees down, dividing them into different parts (i.e., stems, branches, leaves, and roots), and measuring the weight of each part. This process is considered to be the most accurate approach to estimate biomass [7], but it is time and labor consuming, and it is only available in specific regions with logging permits. In comparison, indirect methods, especially those based on models, are being used more frequently. This approach utilizes allometric relationships that exist widely in organisms to establish statistical models that relate to easily measured variables and the biomass of trees [8,9]. For example, tree height and diameter at breast height (DBH) are often used as predictors of individual tree biomass [10], usually with an accuracy of more than 80% [6]. For the indirect modeling method, although it is necessary to collect and process enough sample data in preliminary work, the model can be applied to other similar regions to make estimations without damaging trees once it is established successfully [6,9]. However, some models have different accuracy for the biomass of different parts of trees [11], and the fitting of crown biomass is usually lower than that of stem biomass [12]. For example, Pérez-Cruzado and Rodríguez-Soalleiro [13] found that the coefficient of determination for the leaf biomass model was 18% lower than the total wood biomass model in estimating the above-ground biomass of Eucalyptus nitens plantations using tree height and DBH. In addition, there were significant variations in crown biomass estimations among different habitats [1,14]. Therefore, it is necessary to develop a model that can accurately estimate crown biomass at various sites.
Shinozaki et al. [15,16] first proposed the pipe model theory, in which the stem and branches were considered to be an assemblage of unit pipes supporting a unit number of photosynthetic organs. This means that the sapwood cross-sectional area at the base of a crown is positively related to the total leaf mass, as well as to the total sapwood cross-sectional area of the crown branches [17]. Based on the pipe model theory, equations have been developed for estimating the foliage or crown biomass of tree species in different habitats [18,19,20]. Ogawa et al. [5] analyzed the allometric relationships between leaf biomass and stem cross-sectional area at the crown base (AB), for example, and found that the pipe model could accurately estimate the foliage biomass of Chamaecyparis obtusa, with good model fitting. As an essential variable in estimating crown biomass using the pipe model theory, however, AB usually requires climbing trees to be measured [14]. The inconvenience of obtaining this measurement has limited the application of the pipe model theory for some tree species. Combined with the stem taper equation [21], Valentine et al. [22] proposed that AB of most species could be estimated by using tree height, crown base height (HB), and stem area at breast height (A1.3). This improved approach has greatly promoted the application of the pipe model theory in practice. Based on this modified approach, Sumida et al. [18] accurately simulated AB from ground-based measurements of tree dimensions (R2 = 0.97), and successfully estimated the crown biomass using AB in a naturally regenerated Betula ermanii stand. Inagaki et al. [14] also used this modified method to accurately estimate the crown biomass of Japanese cedars in five regions. However, the reliability and universality of the modified method based on the pipe model theory in crown biomass estimation of plantations in China have not been well verified.
Larix olgensis is one of the main reforestation species in northeast China [23], which is widely distributed in Heilongjiang, Jilin, and Liaoning provinces [24,25]. In this study, we used a modified method based on the pipe model theory to estimate the crown biomass (including the branches and foliage), leaf biomass, and branch biomass of L. olgensis for the first time. The objectives of this study were as follows: (1) To examine the accuracy of estimating AB using the tree height, HB, and A1.3 for L. olgensis in China, (2) to verify whether the proportional relationship between leaf biomass, branch biomass, crown biomass, and AB was consistent with the pipe model theory, and (3) to detect the effects of site, stand density, and age on leaf biomass, branch biomass, and crown biomass estimation based on the pipe model theory. This work provided a theoretical basis for accurately estimating the crown biomass of an L. olgensis plantation in northeast China and was helpful in the practical application of the pipe model theory.
2. Materials and Methods
2.1. Study Area and Data
The fieldwork was conducted in Heilongjiang Province by the Heilongjiang Academy of Forestry at four sites: The Hengdaohezi Forest Farm of the Hailin Forestry Bureau, the Dahailin Forestry Bureau, the Linkou Forestry Bureau, and the Mengjiagang Forest Farm of the Huanan Forestry Bureau (Figure 1). The altitude of all investigated sites is between 170 and 800 m, and the main landforms are low mountains and hills. This region is associated with a temperate continental monsoon climate, where the annual average temperature is 2.3~3.5 °C and the annual average precipitation ranges from 500 to 650 mm. The vegetation belongs to the Changbai Mountain flora, with the main tree species including L. olgensis, Pinus koraiensis, Pinus sylvestris var. mongolica, Betula platyphylla, etc.
In this study, inventory plots were uniformly set in L. olgensis plantation stands of different sites, densities, and ages, and each selected stand was observed to have grown well. A total of 199 inventory plots were analyzed (Table S1). Their characteristics were shown in Table 1. For each plot, two sample trees were selected from the intermediate trees for destructive sampling. All of the sample trees had intact and not forked crowns. The DBH and crown width (CW) of each sample tree were measured in the field. After the sample trees were felled, the tree height, HB, and live crown length (CL) were measured. The stems were crosscut at 1-m intervals and each section’s weight was recorded. The total characteristic statistics of height, DBH, HB, CW, and CL of all sample trees were shown in Table 2. The live crown from the first live branch to the base of the terminal bud was divided equally into upper, middle, and lower layers. All live branches within each crown layer were cut and the total fresh weight was measured. Three branches were selected from each layer, and the branches and leaves were separated and weighed. All separated branches and leaves were oven-dried at 85 °C for 48 h to a constant weight. The biomass of each component was calculated by the ratio of dry weight to fresh weight. The sum of the branch biomass and leaf biomass was considered the crown biomass (Table 3). A total of 398 sample trees from 199 plots were used in the analysis.
2.2. Estimation of the Stem Cross-Sectional Area at the Crown Base (AB)
Valentine et al. [22] proposed a method to estimate AB (m2) from the height (H) (m), crown base height (HB) (m), and stem area at DBH (A1.3) (m2) in B. ermanii forests. Linear regression analysis was performed after the logarithmic transformation of AB and [A1.3(H−HB)/(H−H1.3)] (Figure 2). H1.3 is the breast height of the tree.
If the slope (a) and intercept (b) were not significantly different from one and zero, respectively, then Equation (2) holds:
We investigated the above relationship for 80% of all individuals (318 trees) in the four forestry bureaus of Hailin, Dahailin, Linkou, and Huanan (Table S2). We determined the 95% confidence intervals for the slope and intercept in Equation (1) (Table S3). In addition, the remaining 20% of individuals not involved in the fitting model (80 trees) were used as test samples to test the suitability of the model. In accordance with previous studies on tree biomass models or growth models [26,27,28], the coefficient of determination (R2), total relative error (Rs), mean relative error (EE), mean absolute value of relative error (RMA), and prediction accuracy (P) were used to assess the model in this study (see the Supplementary Method 1). For these indicators, R2 was used to determine the model-fitting goodness of fit. Rs and EE were used to test the systematic deviation in the model, and the model had the best effect when they approached zero. RMA was a precision index reflecting the estimated crown biomass of an individual tree. P was used to evaluate the effect of the model prediction.
2.3. Estimation of Crown Biomass
Heteroscedasticity is common in biomass and volume data [29]. Measures should therefore be taken to eliminate the influence of heteroscedasticity before constructing biomass models. Weighted regression and logarithmic transformation are widely used methods to eliminate heteroscedasticity [30,31]. In this study, a logarithmic transformation was performed to remove the heteroscedasticity.
In this study, leaf biomass, branch biomass, and crown biomass were estimated using the AB crown base model Equation (3). The D2H model Equation (4) was also used to estimate the same parts of biomass as a comparison.
where Y is a component of the biomass of a single tree crown, such as leaf biomass, branch biomass, or crown biomass.
Analysis of Co-Variance (ANCOVA) was used to evaluate the effects of site, stand density, or age on each component of crown biomass in the AB model and the D2H model. The regression slope and intercept, together with 95% confidence intervals, were also calculated. If the slope of the regression line in the AB model was not significantly different from one, it was considered a proportional relationship between each component of crown biomass and AB. The bias of logarithmic transformation was adjusted by calculating the correction factor according to Baskerville [32]. All statistical analyses were performed using JMP software (ver. 13.0, SAS Institute).
3. Results
3.1. Estimation of the Stem Cross-Sectional Area at the Crown Base (AB)
In this study, data for 318 L. olgensis trees were fitted using Equation (1) (Table S2, Figure 3). Table S3 shows the relevant parameters.
Equation (2) could thus be used to estimate AB because the slope and intercept of the regression in Equation (3) were not significantly different from one and zero, respectively.
The test sample data were substituted into Equation (2) to calculate the estimated AB (Table S4). The statistics for model accuracy assessment were calculated. The results showed that Rs was −8.04%, EE was −7.58%, RMA was 8.63%, and P was 97.41%. Therefore, the model could be considered to be valid and veracious because it passed the accuracy test.
3.2. Estimation of Crown Biomass
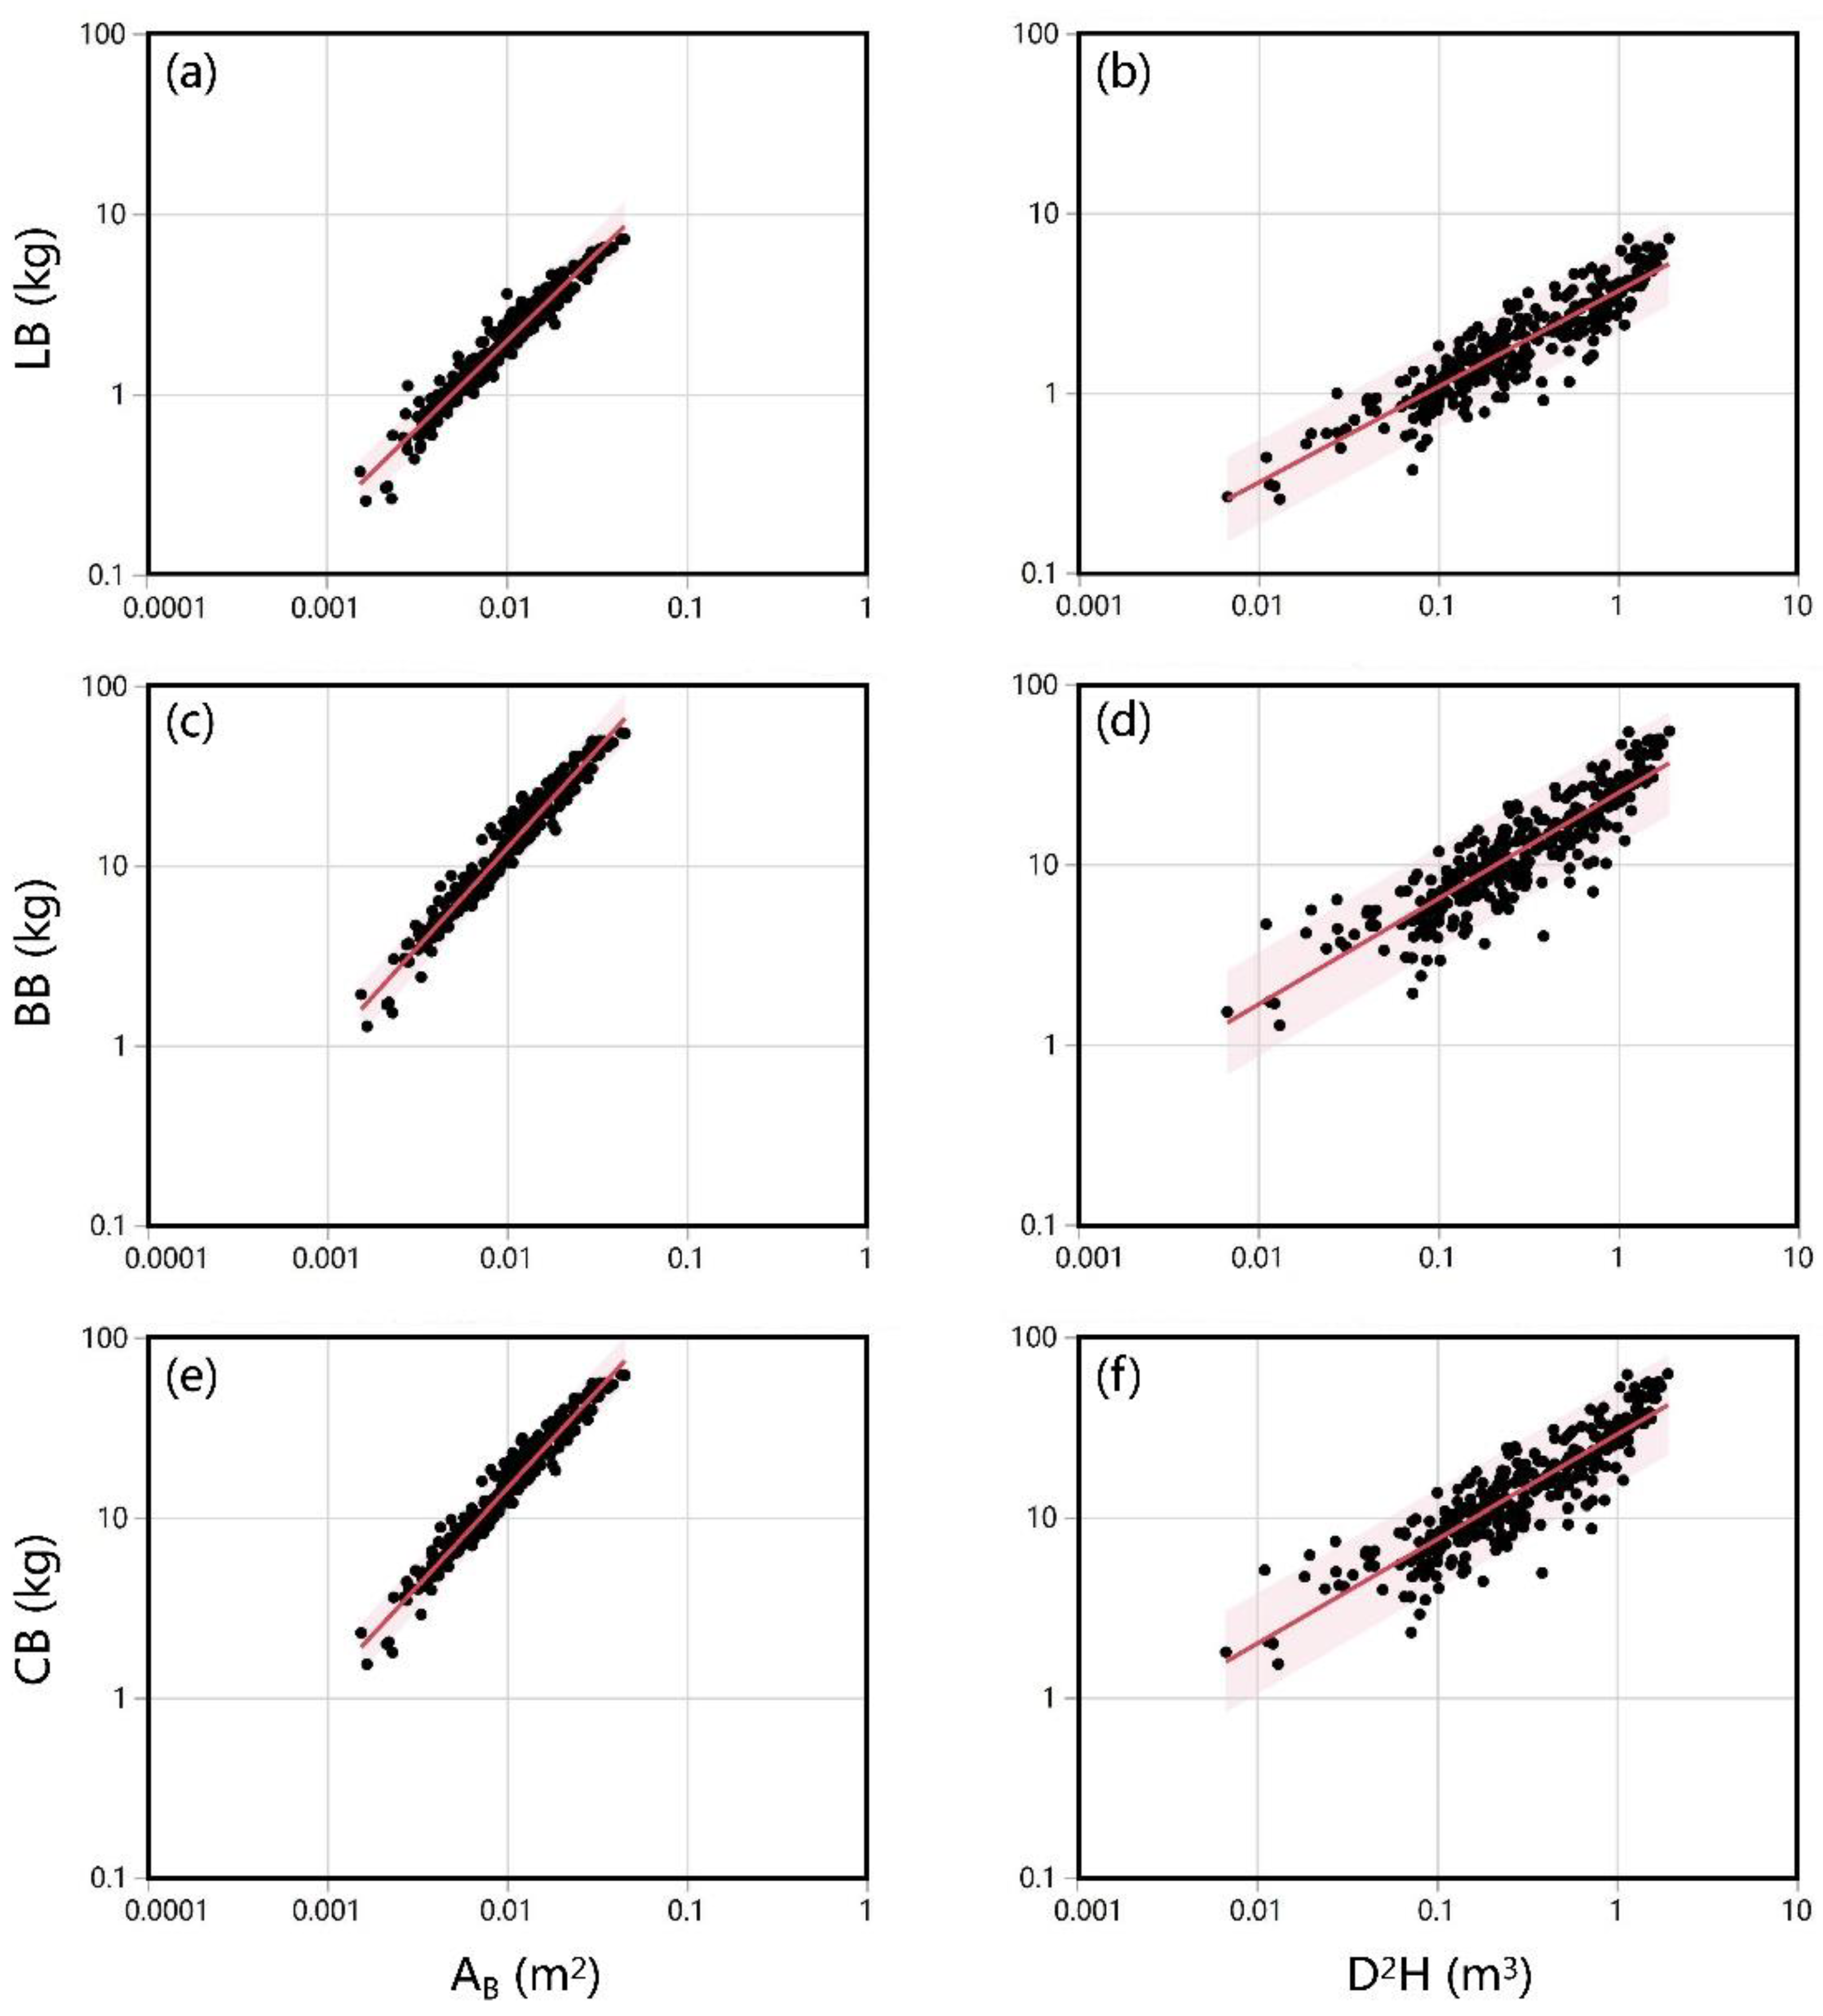
The slope for crown biomass in the AB model was 1.084 (Table 4, Figure 4e), indicating that crown biomass and AB had a proportional relationship. In the AB model, the R2adj values of leaf biomass, branch biomass, and crown biomass were 0.944, 0.952, and 0.953, respectively, which were higher than those in the D2H model (Table 4). These results showed that the AB model could simulate the crown biomass more accurately than the D2H model.
The results of the ANCOVA analysis are shown in Table S5. In the northeast forests, the relationships between leaf biomass (p = 0.662), branch biomass (p = 0.077), crown biomass (p = 0.180), and AB were not affected by site. According to the AB model, the effects of density on leaf biomass (p = 0.103), branch biomass (p = 0.178), and crown biomass (p = 0.169) were not significant. Tree age had a significant effect on leaf biomass (p = 0.006), the same as on branch biomass (p = 0.041) and crown biomass (p = 0.024) (Table S5). Compared with the AB model, site, density, and age had significant effects on each component of crown biomass in the D2H model.
In addition, leaf biomass, branch biomass, and crown biomass per unit of AB were calculated by dividing the biomass of each corresponding part by AB. A comparison of leaf biomass, branch biomass, and crown biomass per unit of AB between different sites, stand density, and age was performed by t-test (Table 5). The results showed that there was no significant difference in leaf biomass, branch biomass, and crown biomass per unit of AB between the four sites. Stand density had no significant effect on leaf biomass, branch biomass, and crown biomass per unit of AB. Leaf biomass per unit of AB in plantations less than 20 years old was significantly higher than that of older plantations.
4. Discussion
Estimations of a forest’s structural properties, such as crown height and aboveground biomass, are essential for monitoring forest dynamics and assessing the global carbon cycle [33]. As an important part of the aboveground biomass, crown biomass should be estimated accurately using an appropriate and well-parameterized model. Allometric models are often used to estimate crown biomass [29]. However, the results from allometric models vary [34], and an allometric relationship must be determined for each species of forest. The pipe model theory can be used to estimate the crown biomass of various habitats, without the variations in model accuracy caused by various factors [35]. Inagaki et al. [14] compared the results of common allometric models with the pipe model and their results showed that the pipe model was better able to simulate crown biomass. However, few studies have examined the applicability of the pipe model theory in China, especially for plantations. Therefore, in this study, the crown biomass of larch plantations in northeast China was estimated based on an improved pipe model.
4.1. Estimation AB Based on the Pipe Model
In previous studies on Japanese cedar, B. ermanii, Scots pine, and Norway spruce [14,17,18], it was found that the stem cross-sectional area at the crown base (AB) predicted using variables such as tree height and the stem area at DBH showed a 1:1 relationship with the measured AB, indicating that this relationship might be a general feature among tree species. For the larch trees investigated in the study, our results also showed that there was a 1:1 relationship between the measured and estimated AB (Figure 3). The result proved that the ratio of the crown basal stem area (AB) to the stem area at breast height (A1.3) and the ratio of the crown length (H − HB) to the height above breast height (H − H1.3) were the same (see Equation (2)). Low relative error and high prediction accuracy of test samples also indicated that the model has high precision [36]. Therefore, AB could be easily predicted using Equation (2) for larch plantations in northeast China, and the application convenience of the pipe model can be improved greatly because this method does not require climbing trees or using instruments to measure AB.
4.2. Positive Proportional Relationship between Biomass and AB
According to Table 4, the fitting effects (R2adj) of the AB model on each component of crown biomass were better than that of the D2H model, indicating that the AB model could estimate the crown biomass more accurately. In the AB model, the slope of the regression between crown biomass and the stem cross-sectional AB did not significantly differ from one (Table 4). Previous studies have found that the regression slope for the relationship between leaf biomass and AB ranged from 0.991 to 1.275, and the slope for branch biomass ranged from 1.015 to 1.208 in a middle-aged Japanese cedar forest [14]. Ogawa et al. [5] found that this ratio was 1.008 in an analysis of hinoki cypress (Chamaecyparis obtusa). Studies on B. ermanii [18] and Scots pine and Norway spruce [17] produced similar results. Thus, these results proved that the crown biomass was proportional to AB, consistent with the pipe model theory [15,16].
4.3. Effects of Site, Stand Density and Age on Biomass
The site was considered to be a significant influencing factor in general models (such as the D2H model) for estimating biomass [35,37,38]. However, in our study, it was found that the effect of site was not significant for leaf biomass (p = 0.662), branch biomass (p = 0.077), and crown biomass (p = 0.180) of the northeastern larch plantations in the AB crown base model (Table S5). Leaf biomass, branch biomass, and crown biomass per unit of AB were also not significantly different among the four sites (Table 5). These results suggested that the relationship between crown biomass (including branches and leaves) and AB was not affected by site. The pipe model theory assumes that the ratio between leaf biomass and sapwood area is constant [15], which can often be substituted by crown base area in practice [39]. Some previous studies have shown that the ratio of leaf biomass to stem area at the crown base is essentially stable within a species and an area [19,40,41]. Inagaki et al. [14] indicated that leaf biomass and branch biomass per unit crown base area were not influenced by positions, although environmental factors might vary at different topographic locations. Our results also confirmed that site has no general effect on crown biomass per unit of AB in L. olgensis plantations. This result was important because site differences need not be considered when estimating crown biomass using this model in northeast China.
Stand density is generally thought to affect biomass estimation [42,43,44]. In this study, nevertheless, stand density was not significantly affected for each component of crown biomass in larch plantations in the AB model (Table S5). This result indicated that the crown biomass per unit of the stem cross-sectional area at the crown base (AB) remained constant in different stand densities. Some previous studies have also suggested that the pipe model ratios [19], that is, the ratio of leaf biomass or area to the crown base area, are not affected by stand density. For example, Thompson [45] examined the pipe model ratios of lodgepole pine across different stand densities and found no statistical difference in density effects because the average ring area in the sapwood, which determined the pipe model ratios, was not affected by stand density. In addition, Berninger et al. [19] analyzed the data of Scots pine from 36 different stands and found that the leaf-to-stem cross-sectional area ratio was less correlated with stand density. In another study of black spruce forests, there was no significant correlation between the ratio of leaf biomass to stem cross-sectional area and stand density because the partial correlation coefficient between leaf biomass and stand density was only 0.25 [46]. This finding is consistent with the results of our study. Therefore, the effect of stand density was not significant in this study when the AB crown base model was used to estimate the biomass in northeast China.
Age dependence has been found in many parametric studies of the pipe model theory [35,47,48]. In a study of Scots pine and Norway spruce, Hu et al. [17] found that the leaf biomass per unit of stem cross-sectional area at the crown base (AB) gradually decreased with age, because the presence of heartwood caused the deviation of replacing sapwood with AB to increase with tree age. In this study, the leaf biomass per unit of AB decreased with increasing age, and the leaf biomass per unit of AB in stands <20 years old was significantly higher than that of stands between 20 and 30 years old and above 30 years old (Table 5), indicating that age had a significant impact on the estimation of leaf biomass using this model. In addition, Kostner et al. [47] studied Norway spruce of different ages consisting of six stands and also found that the ratio of leaf area to sapwood area decreased with the increase in tree age. A similar phenomenon of leaf biomass per unit of crown base stem area decreasing with the increase in tree age was observed in Japanese cedar plantations [14]. Therefore, the effect of age should be considered when estimating the biomass of the L. olgensis plantation in northeast China based on the pipe model theory.
5. Conclusions
In conclusion, a modified method based on the pipe model theory was used for the first time to simulate the crown biomass of L. olgensis plantations in northeast China. The results showed that the stem cross-sectional area at the crown base (AB) could be estimated accurately by using tree height, crown base height, and stem area at breast height, and there was a proportional relationship between crown biomass and AB. Crown biomass could be estimated accurately by the modified method, but the effect of age should be considered. Model methods that exclude the effects of age need to be further developed in future studies to be able to accurately estimate the crown biomass of L. olgensis plantations at different ages.
Supplementary Materials
The following supporting information can be downloaded at: https://www.mdpi.com/article/10.3390/f14020400/s1, Supplementary Method 1: Estimation of the Stem Cross-Sectional Area at the Crown Base (AB); Table S1: Topography of each plot in the four sites; Table S2: Estimation of the stem area at the crown base (AB) (318 trees); Table S3: Slope and intercept of the model for estimating AB; Table S4: The 20% individual trees to test the suitability of the estimation of the stem area at the crown base (AB); Table S5: Results of Analysis of Co-Variance (ANCOVA).
Author Contributions
C.H.: Conceptualization, methodology, formal analysis, investigation, writing—original draft. Y.Z. (Yuanyuan Zhang) and L.C.: Investigation, data curation. L.Z.: Investigation, formal analysis, validation. Y.Z. (Yanliang Zhang): Writing—original draft. W.S.: Supervision, project administration, funding acquisition, resources, writing—review and editing. All authors have read and agreed to the published version of the manuscript.
Funding
This study was financially supported by the Beijing Financial Project (23CB067), the Beijing Financial Project (11000022T000000440602), and the National Key Research and Development Program (2022YFF1303202). This work was supported by the International Research Training Group TreeDì jointly funded by the Deutsche Forschungsgemeinschaft (DFG, German Research Foundation; grant 319936945/GRK2324) and the University of Chinese Academy of Sciences (UCAS).
Data Availability Statement
The data that support the findings of this study are available from Heilongjiang Academy of Forestry, but restrictions apply to the availability of these data, which were used under license for the current study and so are not publicly available. Data are, however, available from the authors upon reasonable request and with permission of the Heilongjiang Academy of Forestry.
Acknowledgments
The authors thank the Heilongjiang Academy of Forestry for helping in the field data survey.
Conflicts of Interest
The authors declare no conflict of interest.
References
- Zou, W.T.; Zeng, W.S.; Zhang, L.J.; Zeng, M. Modeling crown biomass for four pine species in China. Forests 2015, 6, 433–449. [Google Scholar] [CrossRef]
- Clark, D.A.; Brown, S.; Kicklighter, D.W.; Chambers, J.Q.; Thomlinson, J.R.; Ni, J. Measuring net primary production in forests: Concepts and field methods. Ecol. Appl. 2001, 11, 356–370. [Google Scholar] [CrossRef]
- Meng, S.; Yang, F.; Hu, S.; Wang, H.; Wang, H. Generic additive allometric models and biomass allocation for two natural oak species in northeastern China. Forests 2021, 12, 715. [Google Scholar] [CrossRef]
- Chen, D.; Li, F. The characteristics and biomass distribution in crown of Larix olgensis in Northeastern China. J. Korean Soc. For. Sci. 2010, 99, 204–212. [Google Scholar]
- Ogawa, K.; Adu-Bredu, S.; Yokota, T.; Hagihara, A. Leaf biomass changes with stand development in hinoki cypress (Chamaecyparis obtusa [Sieb. et Zucc.] Endl.). Plant Ecol. 2010, 211, 79–88. [Google Scholar] [CrossRef]
- Ochał, W.; Wertz, B.; Orzeł, S. Above-ground biomass allocation and potential carbon sink of black pine–a case study from southern Poland. Ann. For. Res. 2022, 65, 71–90. [Google Scholar]
- Dong, L.; Zhang, L.; Li, F. Additive biomass equations based on different dendrometric variables for two dominant species (Larix gmelini Rupr. and Betula platyphylla Suk.) in natural forests in the Eastern Daxing’an Mountains, Northeast China. Forests 2018, 9, 261. [Google Scholar] [CrossRef]
- Huxley, J.S. Problems of relative growth (Methuen & Co. Ltd, London). Nature 1932, 129, 775–777. [Google Scholar]
- Zianis, D.; Radoglou, K. Comparison between empirical and theoretical biomass allometric models and statistical implications for stem volume predictions. Forestry 2006, 79, 477–487. [Google Scholar] [CrossRef]
- Dutcă, I.; McRoberts, R.E.; Naesset, E.; Blujdea, V.N. A practical measure for determining if diameter (D) and height (H) should be combined into D2H in allometric biomass models. For. Int. J. For. Res. 2019, 92, 627–634. [Google Scholar] [CrossRef]
- Henry, M.; Picard, N.; Trotta, C.; Manlay, R.; Valentini, R.; Bernoux, M.; Saint-André, L. Estimating tree biomass of sub-Saharan African forests: A review of available allometric equations. Silva Fenn. 2011, 45, 477–569. [Google Scholar] [CrossRef]
- Hosoda, K.; Iehara, T. Aboveground biomass equations for individual trees of Cryptomeria japonica, Chamaecyparis obtusa and Larix kaempferi in Japan. J. For. Res. 2010, 15, 299–306. [Google Scholar] [CrossRef]
- Pérez-Cruzado, C.; Rodríguez-Soalleiro, R. Improvement in accuracy of aboveground biomass estimation in Eucalyptus nitens plantations: Effect of bole sampling intensity and explanatory variables. For. Ecol. Manag. 2011, 261, 2016–2028. [Google Scholar] [CrossRef]
- Inagaki, Y.; Nakanishi, A.; Tange, T. A simple method for leaf and branch biomass estimation in Japanese cedar plantations. Trees 2020, 34, 349–356. [Google Scholar] [CrossRef]
- Shinozaki, K.; Yoda, K.; Hozumi, K.; Kira, T. A quantitative analysis of plant form-the pipe model theory: I. Basic analyses. Jpn. J. Ecol. 1964, 14, 97–105. [Google Scholar]
- Shinozaki, K.; Yoda, K.; Hozumi, K.; Kira, T. A quantitative analysis of plant form-the pipe model theory: II. Further evidence of the theory and its application in forest ecology. Jpn. J. Ecol. 1964, 14, 133–139. [Google Scholar]
- Hu, M.; Lehtonen, A.; Minunno, F.; Mäkelä, A. Age effect on tree structure and biomass allocation in Scots pine (Pinus sylvestris L.) and Norway spruce (Picea abies [L.] Karst.). Ann. For. Sci. 2020, 77, 1–15. [Google Scholar] [CrossRef]
- Sumida, A.; Nakai, T.; Yamada, M.; Ono, K.; Uemura, S.; Hara, T. Ground-based estimation of leaf area index and vertical distribution of leaf area density in a Betula ermanii forest. Silva Fenn. 2009, 43, 799–816. [Google Scholar] [CrossRef]
- Berninger, F.; Coll, L.; Vanninen, P.; Mäkelä, A.; Palmroth, S.; Nikinmaa, E. Effects of tree size and position on pipe model ratios in Scots pine. Can. J. For. Res. 2005, 35, 1294–1304. [Google Scholar] [CrossRef]
- Shelburne, V.B.; Hedden, R.L.; Allen, R.M. The effect of site, stand density, and sapwood permeability on the relationship between leaf area and sapwood area in loblolly pine (Pinus taeda L.). For. Ecol. Manag. 1993, 58, 193–209. [Google Scholar] [CrossRef]
- McTague, J.P.; Weiskittel, A. Evolution, history, and use of stem taper equations: A review of their development, application, and implementation. Can. J. For. Res. 2021, 51, 210–235. [Google Scholar] [CrossRef]
- Valentine, H.T.; Baldwin, V.C., Jr.; Gregoire, T.G.; Burkhart, H.E. Surrogates for foliar dry matter in loblolly pine. For. Sci. 1994, 40, 576–585. [Google Scholar]
- Pan, L.; Mei, G.; Wang, Y.; Saeed, S.; Chen, L.; Cao, Y.; Sun, Y. Generalized Nonlinear Mixed-Effect Model of Individual TREE Height to Crown Base for Larix olgensis Henry in Northeast China. J. Sustain. For. 2020, 39, 827–840. [Google Scholar] [CrossRef]
- Zeng, W.; Duo, H.; Lei, X.; Chen, X.; Wang, X.; Pu, Y.; Zou, W. Individual tree biomass equations and growth models sensitive to climate variables for Larix spp. in China. Eur. J. For. Res. 2017, 136, 233–249. [Google Scholar] [CrossRef]
- Dong, L.; Zhang, Y.; Zhang, Z.; Xie, L.; Li, F. Comparison of tree biomass modeling approaches for larch (Larix olgensis Henry) trees in Northeast China. Forests 2020, 11, 202. [Google Scholar] [CrossRef]
- Zhou, L.; Zhu, D.; Li, Z.; Lv, X.; Zhai, X. Research and establishment of the aboveground biomass model of Robinia pseudoacacia L. Acta Agric. Shanghai 2016, 32, 138–142. [Google Scholar] [CrossRef]
- Li, F. Modeling crown profile of Larix olgensis trees. Sci. Silvae Sin. 2004, 40, 16–24. [Google Scholar] [CrossRef]
- Zeng, W.; Tang, S. Goodness evaluation and precision analysis of tree biomass equations. Sci. Silvae Sin. 2011, 47, 106–113. [Google Scholar] [CrossRef]
- Dong, L.; Zhang, L.; Li, F. Evaluation of stand biomass estimation methods for major forest types in the eastern Da Xing’an Mountains, Northeast China. Forests 2019, 10, 715. [Google Scholar] [CrossRef]
- Dong, L.; Zhang, L.; Li, F. Developing additive systems of biomass equations for nine hardwood species in Northeast China. Trees 2015, 29, 1149–1163. [Google Scholar] [CrossRef]
- Zhao, D.; Kane, M.; Markewitz, D.; Teskey, R.; Clutter, M. Additive tree biomass equations for midrotation loblolly pine plantations. For. Sci. 2015, 61, 613–623. [Google Scholar] [CrossRef]
- Baskerville, G.L. Use of logarithmic regression in the estimation of plant biomass. Can. J. For. Res. 1972, 2, 49–53. [Google Scholar] [CrossRef]
- Schlund, M.; Boehm, H.D. Assessment of linear relationships between TanDEM-X coherence and canopy height as well as aboveground biomass in tropical forests. Int. J. Remote Sens. 2021, 42, 3405–3425. [Google Scholar] [CrossRef]
- António, N.; Tomé, M.; Tomé, J.; Soares, P.; Fontes, L. Effect of tree, stand, and site variables on the allometry of Eucalyptus globulus tree biomass. Can. J. For. Res. 2007, 37, 895–906. [Google Scholar] [CrossRef]
- Forrester, D.I.; Tachauer, I.H.H.; Annighoefer, P.; Barbeito, I.; Pretzsch, H.; Ruiz-Peinado, R.; Stark, H.; Vacchiano, G.; Zlatanov, T.; Chakraborty, T.; et al. Generalized biomass and leaf area allometric equations for European tree species incorporating stand structure, tree age and climate. For. Ecol. Manag. 2017, 396, 160–175. [Google Scholar] [CrossRef]
- Sumida, A.; Miyaura, T.; Torii, H. Relationships of tree height and diameter at breast height revisited: Analyses of stem growth using 20-year data of an even-aged Chamaecyparis obtusa stand. Tree Physiol. 2013, 33, 106–118. [Google Scholar] [CrossRef]
- Zapatacuartas, M.; Sierra, C.A.; Alleman, L. Probability distribution of allometric coefficients and Bayesian estimation of aboveground tree biomass. For. Ecol. Manag. 2012, 277, 173–179. [Google Scholar] [CrossRef]
- Rubilar, R.A.; Allen, H.L.; Alvarez, J.S. Silvicultural manipulation and site effect on above and belowground biomass equations for young Pinus radiata. Biomass Bioenerg. 2010, 34, 1825–1837. [Google Scholar] [CrossRef]
- Lehtonen, A.; Heikkinen, J.; Petersson, H.; Ťupek, B.; Liski, E.; Mäkelä, A. Scots pine and Norway spruce foliage biomass in Finland and Sweden—Testing traditional models vs. the pipe model theory. Can. J. For. Res. 2020, 50, 146–154. [Google Scholar] [CrossRef]
- Kantola, A.; Mäkelä, A. Development of biomass proportions in Norway spruce (Picea abies [L.] Karst.). Trees 2006, 20, 111–121. [Google Scholar] [CrossRef]
- Ilomäki, S.; Nikinmaa, E.; Mäkelä, A. Crown rise due to competition drives biomass allocation in silver birch. Can. J. For. Res. 2003, 33, 2395–2404. [Google Scholar] [CrossRef]
- Wassihun, A.N.; Hussin, Y.A.; Van Leeuwen, L.M. Effect of forest stand density on the estimation of above ground biomass/carbon stock using airborne and terrestrial LIDAR derived tree parameters in tropical rain forest, Malaysia. Environ. Syst. Res. 2019, 8, 1–15. [Google Scholar] [CrossRef]
- Dahlhausen, J.; Uhl, E.; Heym, M. Stand density sensitive biomass functions for young oak trees at four different European sites. Trees 2017, 31, 1811–1826. [Google Scholar] [CrossRef]
- Jagodziński, A.M.; Dyderski, M.K.; Gęsikiewicz, K. How do tree stand parameters affect young Scots pine biomass?—Allometric equations and biomass conversion and expansion factors. For. Ecol. Manag. 2018, 409, 74–83. [Google Scholar] [CrossRef]
- Thompson Dan, C. The effect of stand structure and stand density on the leaf area–sapwood area relationship of lodgepole pine. Can. J. For. Res. 1989, 19, 392–396. [Google Scholar] [CrossRef]
- Robichaud, E.; Methven, I.R. The applicability of the pipe model theory for the prediction of foliage biomass in trees from natural, untreated black spruce stands. Can. J. For. Res. 1992, 22, 1118–1123. [Google Scholar] [CrossRef]
- Köstner, B.; Falge, E.; Tenhunen, J.D. Age-related effects on leaf area/sapwood area relationships, canopy transpiration and carbon gain of Norway spruce stands (Picea abies) in the Fichtelgebirge, Germany. Tree Physiol. 2002, 22, 567–574. [Google Scholar] [CrossRef] [PubMed]
- Ogawa, K. Mathematical analysis of age-related changes in leaf biomass in forest stands. Can. J. For. Res. 2012, 42, 356–363. [Google Scholar] [CrossRef]
Figure 1.
Location of the study area in northeast China.

Figure 2.
The method of Valentine et al. [22] to estimate stem cross-sectional area at the crown base (AB).
Figure 2.
The method of Valentine et al. [22] to estimate stem cross-sectional area at the crown base (AB).

Figure 3.
Relationship between the measured and predicted AB for Larix olgensis. The broken diagonal line indicates the 1:1 relationship. Abbreviation: AB, stem area at crown base.
Figure 3.
Relationship between the measured and predicted AB for Larix olgensis. The broken diagonal line indicates the 1:1 relationship. Abbreviation: AB, stem area at crown base.

Figure 4.
Relationships between AB and LB, BB, CB (a–e) and that between D2H and LB, BB, CB (b,d,f) in Larix olgensis plantations. The information on the regression lines is shown in Table 4. Abbreviation: AB, stem area at crown base; D, diameter at breast height; H, tree height; LB, leaf biomass; BB, branch biomass; CB, crown biomass.


Table 1.
Sample plot and stand characteristics.
| Site | Plot Number | Area (ha) | Density (n/ha) | Age (Year) | ||||||
|---|---|---|---|---|---|---|---|---|---|---|
| Max | Min | Mean | Max | Min | Mean | Max | Min | Mean | ||
| Hailin | 50 | 0.1225 | 0.0100 | 0.0735 | 7800 | 475 | 1653.36 | 40 | 6 | 27.37 |
| Dahailin | 48 | 0.1225 | 0.0400 | 0.0635 | 4525 | 542 | 1822.14 | 40 | 12 | 20.80 |
| Linkou | 51 | 0.1200 | 0.0225 | 0.0805 | 3967 | 500 | 1567.28 | 40 | 6 | 20.20 |
| Huanan | 50 | 0.1200 | 0.0100 | 0.0738 | 7800 | 408 | 1843.89 | 40 | 9 | 26.59 |
| Total | 199 | 0.1225 | 0.0100 | 0.0730 | 7800 | 408 | 1719.88 | 40 | 6 | 23.76 |
Table 2.
Characteristics of sampling Larix olgensis trees in the study sites.
| Site | Plot Number | Sample Trees Number | DBH (cm) | Height (m) | HB (m) | CW (m) | CL (m) | |||||||||||||||
|---|---|---|---|---|---|---|---|---|---|---|---|---|---|---|---|---|---|---|---|---|---|---|
| Max | Min | Mean ± Std | CV | Max | Min | Mean ± Std | CV | Max | Min | Mean ± Std | CV | Max | Min | Mean ± Std | CV | Max | Min | Mean ± Std | CV | |||
| Hailin | 50 | 100 | 27.8 | 5.8 | 14.7 ± 5.46 | 0.37 | 25.95 | 3.30 | 14.62 ± 5.45 | 0.37 | 15.90 | 0.21 | 6.63 ± 4.75 | 0.72 | 6.35 | 1.25 | 3.42 ± 1.01 | 0.29 | 11.90 | 2.35 | 7.99 ± 1.97 | 0.25 |
| Dahailin | 48 | 96 | 26.7 | 8.1 | 14.0 ± 4.46 | 0.32 | 25.33 | 9.68 | 14.41 ± 3.90 | 0.27 | 17.80 | 1.10 | 6.58 ± 3.51 | 0.53 | 7.55 | 0.83 | 3.19 ± 1.18 | 0.37 | 12.85 | 2.92 | 7.82 ± 1.90 | 0.24 |
| Linkou | 51 | 102 | 25.8 | 5.0 | 16.3 ± 4.40 | 0.27 | 24.45 | 2.70 | 15.65 ± 3.75 | 0.24 | 16.70 | 0.98 | 7.47 ± 3.23 | 0.43 | 6.00 | 1.00 | 2.84 ± 1.14 | 0.40 | 14.30 | 1.65 | 8.18 ± 2.12 | 0.26 |
| Huanan | 50 | 100 | 29.6 | 5.0 | 16.8 ± 6.07 | 0.36 | 24.40 | 3.80 | 16.55 ± 5.49 | 0.33 | 16.50 | 0.50 | 7.86 ± 4.63 | 0.59 | 5.90 | 1.25 | 3.32 ± 1.10 | 0.33 | 14.70 | 2.10 | 8.69 ± 2.49 | 0.29 |
| Total | 199 | 398 | 29.6 | 5.0 | 15.5 ± 5.27 | 0.34 | 25.95 | 2.70 | 15.32 ± 4.80 | 0.31 | 17.80 | 0.21 | 7.14 ± 4.12 | 0.58 | 7.55 | 0.83 | 3.19 ± 1.13 | 0.35 | 14.70 | 1.65 | 8.17 ± 2.16 | 0.26 |
DBH: Diameter at breast height; HB: Height at crown base; CW: Crown width; CL: Crown length.; Std: Standard deviation; CV: Coefficient of variation.
Table 3.
The statistics of biomass of the trees analyzed in the study sites.
| Site | Plot Number | Sample Trees Number | Leaf Biomass (kg) | Branch Biomass (kg) | Crown Biomass (kg) | |||||||||
|---|---|---|---|---|---|---|---|---|---|---|---|---|---|---|
| Max | Min | Mean ± Std | CV | Max | Min | Mean ± Std | CV | Max | Min | Mean ± Std | CV | |||
| Hailin | 50 | 100 | 5.87 | 0.44 | 2.16 ± 1.26 | 0.58 | 46.72 | 2.91 | 14.49 ± 9.67 | 0.67 | 52.59 | 3.46 | 16.65 ± 10.92 | 0.66 |
| Dahailin | 48 | 96 | 6.14 | 0.37 | 1.92 ± 1.12 | 0.59 | 49.11 | 1.91 | 12.45 ± 8.91 | 0.72 | 55.25 | 2.28 | 14.36 ± 10.02 | 0.70 |
| Linkou | 51 | 102 | 7.21 | 0.26 | 2.49 ± 1.28 | 0.51 | 54.08 | 1.51 | 16.18 ± 9.56 | 0.59 | 61.28 | 1.78 | 18.67 ± 10.81 | 0.58 |
| Huanan | 50 | 100 | 7.20 | 0.26 | 2.69 ± 1.63 | 0.60 | 54.71 | 1.27 | 18.55 ± 12.73 | 0.69 | 61.90 | 1.53 | 21.24 ± 14.35 | 0.68 |
| Total | 199 | 398 | 7.21 | 0.26 | 2.32 ± 1.37 | 0.59 | 54.71 | 1.27 | 15.45 ± 10.57 | 0.68 | 61.90 | 1.53 | 17.77 ± 11.93 | 0.67 |
Std: Standard deviation; CV: Coefficient of variation.
Table 4.
Slope and intercept values for the biomass estimation by the AB model and D2H model.
| X | Slope(a) | Intercept(b) | R2 | R2adj | ||
|---|---|---|---|---|---|---|
| a | 95% CI | b | 95% CI | |||
| Leaf biomass | ||||||
| AB | 0.974 | (0.948, 1.001) | 5.156 | (5.032, 5.280) | 0.944 | 0.944 |
| D2H | 0.533 | (0.505, 0.560) | 1.298 | (1.252, 1.343) | 0.825 | 0.825 |
| Branch biomass | ||||||
| AB | 1.102 | (1.075, 1.129) | 7.591 | (7.462, 7.720) | 0.952 | 0.952 |
| D2H | 0.587 | (0.553, 0.620) | 3.208 | (3.151, 3.264) | 0.790 | 0.789 |
| Crown biomass | ||||||
| AB | 1.084 | (1.057, 1.110) | 7.654 | (7.529, 7.779) | 0.953 | 0.953 |
| D2H | 0.579 | (0.547, 0.612) | 3.347 | (3.292, 3.401) | 0.797 | 0.796 |
AB: Stem area at crown base; D: Diameter at breast height; H: Tree height; R2: Coefficient of determination; R2adj: Adjusted R-squared; CI: Confidence interval. ln(Y) = a*ln(X) + b, X = AB, D2H, Y = leaf biomass, branch biomass, crown biomass.
Table 5.
Leaf biomass, branch biomass, and crown biomass per unit of AB in larch plantations.
| Effect Factors | Leaf Biomass/AB (kg m−2) | Branch Biomass/AB (kg m−2) | Crown Biomass/AB (kg m−2) |
|---|---|---|---|
| Site | |||
| Hailin | 196.08 ± 28.58 a | 1284.35 ± 259.29 a | 1480.43 ± 281.28 a |
| Dahailin | 198.72 ± 27.98 a | 1284.35 ± 259.29 a | 1415.60 ± 213.92 a |
| Linkou | 199.58 ± 43.64 a | 1220.54 ± 169.18 a | 1420.12 ± 192.07 a |
| Huanan | 196.56 ± 28.60 a | 1278.90 ± 239.23 a | 1475.46 ± 261.45 a |
| Stand density (stems ha−1) | |||
| <1000 | 197.31 ± 44.65 a | 1246.10 ± 264.89 a | 1443.41 ± 288.95 a |
| 1000–2000 | 197.99 ± 27.76 a | 1262.81 ± 214.84 a | 1460.80 ± 235.37 a |
| >2000 | 197.61 ± 25.97 a | 1222.75 ± 174.90 a | 1420.36 ± 189.26 a |
| Age | |||
| <20 | 208.09 ± 37.66 a | 1231.08 ± 152.27 a | 1439.17 ± 170.51 a |
| 20–30 | 193.69 ± 23.63 b | 1260.02 ± 208.20 a | 1453.71 ± 225.90 a |
| >30 | 189.21 ± 31.57 b | 1260.30 ± 300.96 a | 1449.51 ± 327.88 a |
Different lowercase letters (a and b) indicate significant differences at 0.05 level. Abbreviation: AB, stem area at the crown base.
Disclaimer/Publisher’s Note: The statements, opinions and data contained in all publications are solely those of the individual author(s) and contributor(s) and not of MDPI and/or the editor(s). MDPI and/or the editor(s) disclaim responsibility for any injury to people or property resulting from any ideas, methods, instructions or products referred to in the content. |
© 2023 by the authors. Licensee MDPI, Basel, Switzerland. This article is an open access article distributed under the terms and conditions of the Creative Commons Attribution (CC BY) license (https://creativecommons.org/licenses/by/4.0/).
Share and Cite
MDPI and ACS Style
Huang, C.; Zhang, Y.; Chen, L.; Zhuang, L.; Zhang, Y.; Sang, W. Pipe Model Can Accurately Estimate Crown Biomass of Larch (Larix olgensis) Plantation Forest in Northeast China. Forests 2023, 14, 400. https://doi.org/10.3390/f14020400
AMA Style
Huang C, Zhang Y, Chen L, Zhuang L, Zhang Y, Sang W. Pipe Model Can Accurately Estimate Crown Biomass of Larch (Larix olgensis) Plantation Forest in Northeast China. Forests. 2023; 14(2):400. https://doi.org/10.3390/f14020400
Chicago/Turabian StyleHuang, Chenyu, Yuanyuan Zhang, Lu Chen, Liwen Zhuang, Yanliang Zhang, and Weiguo Sang. 2023. "Pipe Model Can Accurately Estimate Crown Biomass of Larch (Larix olgensis) Plantation Forest in Northeast China" Forests 14, no. 2: 400. https://doi.org/10.3390/f14020400
Note that from the first issue of 2016, this journal uses article numbers instead of page numbers. See further details here.