
Rates of Stemwood Carbon Accumulation Are Linked to Hydroclimate Variability in Mexican Conifers
by
 , , and
Marín Pompa-García
1 ,
,
Eduardo D. Vivar-Vivar
1 ,
,
Ernesto A. Rubio-Camacho
2 and
Jesús Julio Camarero
3,*
1
Laboratorio de Dendroecología, Facultad de Ciencias Forestales y Ambientales, Universidad Juárez del Estado de Durango, Río Papaloapan y Blvd, Durango s/n, Col. Valle del Sur, Durango 34120, Durango, Mexico
2
Campo Experimental Centro Altos de Jalisco, Instituto Nacional de Investigaciones Forestales, Agrícolas y Pecuarias-Centro de Investigación Regional Pacífico Centro, Av. Biodiversidad 2470, Tepatitlán de Morelos 47600, Jalisco, Mexico
3
Instituto Pirenaico de Ecología (IPE-CSIC), Avda. Montaña 1005, 50192 Zaragoza, Spain
*
Author to whom correspondence should be addressed.
Forests 2023, 14(7), 1381; https://doi.org/10.3390/f14071381
Submission received: 18 May 2023
/
Revised: 26 June 2023
/
Accepted: 30 June 2023
/
Published: 6 July 2023
(This article belongs to the Section Forest Meteorology and Climate Change)
Abstract
:Evapotranspiration demand has increased rapidly as temperatures have risen, affecting forest productivity. Consequently, carbon (C) uptake by forests is being modified; therefore, a more refined knowledge of the relationships between C capture and hydroclimate variability is required, particularly in drought-prone regions. In this study, we analyzed the relationships between climate and C capture as stemwood through the dendroecological analyses of radial growth in 15 conifer species distributed along a broad bioclimatic gradient in Mexico. The C content was calculated using densitometry data; correlations and mixed models were then used to determine the influence of climatic variables (precipitation, mean maximum and minimum temperatures, SPEI drought index) on tree growth. Each species showed specific responses to the climate with Taxodium mucronatum being the most responsive species. Both precipitation and maximum temperature best explained changes in C capture, with minimum temperature and SPEI playing secondary roles. The winter before the growth period was the most important season for C capture, particularly through positive responses to wet-cool conditions. However, the climatic influences of the current fall and summer were also notable. Seasonal climatic influences have implications for C uptake and forest productivity in the face of the severe droughts that repeatedly affect the study region.
1. Introduction
The frequency and intensity of drought periods have increased worldwide with more widespread and negative impacts on forests [1,2]. Drought affects tree respiration, photosynthesis, and growth rates negatively, therefore influencing forest productivity by decreasing the carbon (C) uptake rate [3]. Consequently, it has been a constant concern worldwide to improve our understanding of drought–growth relationships, particularly in the face of predicted climate warming and forecasted aridification [4]. Regarding radial growth, tree-ring variables such as width, density or blue intensity have been used to reconstruct C pools or fluxes and to assess climate impacts on wood production [2], but we still lack multi-species assessments in seasonally dry areas. Such comparisons would allow deciphering which species are more sensitive to more arid conditions and show lower or more variable long-term stemwood C accumulation rates as compared with more resilient species showing higher or more stable C long-term uptake rates.
Forest ecosystems are known to represent important C sinks that have been used in environmental services market policies to mitigate global warming (Red++). The scientific community has been concerned with providing scientific knowledge that highlights the sensitivity of trees to climatic variability. For example, [5] found that some tree species are vulnerable to rising maximum temperatures, while others appear to benefit from global warming and CO2 fertilization [6]. Such divergent responses have been attributed to several processes related to biome type, site climate conditions, species functional traits, genetic load, etc. [7]. Moreover, current climate models indicate warmer conditions based on rising atmospheric CO2 concentrations [8], which highlight the need to discern in a more refined manner the interaction between C uptake by trees and its relationships with hydroclimate variability based on the measurement of different tree-ring variables (e.g., width, wood density). Improved understanding of these mechanisms would allow the design and implementation of better management programs according to species’ climatic responses, as well as contribute to the understanding of C dynamics in different forest types and under contrasting climate conditions.
The existence of regions with diverse forests under varied climate conditions is a strategic opportunity for this purpose. Mexican forests are an example of diverse ecosystems, distributed in distinct and well-differentiated bioclimatic ranges [9]. In Mexico, there are several conifer species with high dendroecological potential: from arid to tropical environments, along gradients ranging from 0 up to more than 3000 m a.s.l. [10]. They represent varied soil, climatic, and physiographic features and can be used to reconstruct stemwood C uptake [11,12]. Many of these species and forests provide relevant ecological and commercial services [13]. Against such a perspective, these sites constitute ideal natural settings to test the influence of hydroclimate on the dynamics of C capture. Current methods for C estimation include the use of growth rings as natural archives that, through allometric relationships and using densitometric techniques, have proven their efficiency to model C fluxes and pools [14,15].
Although multiple efforts have been developed to estimate changes through time in C uptake, multispecies studies are limited [14,16]. The complexity is increased by the diverse sites tree species inhabit, as well as variations in the adaptive strategies of tree species [16]. Consequently, this requires a rigorous statistical process and the measurement of different tree-ring variables which allow inferring the dependences among C uptake, tree radial growth and hydroclimate. Models that include random effects, i.e., mixed models, are therefore an appropriate approach because they allow the determination of whether C fixation differs among trees subjected to similar hydroclimatic conditions. The distribution of residuals from this inference explains, to a large extent, the variation in C capture as related to regional hydroclimate. The development of successful climate change mitigation strategies will depend on this knowledge, given the forecasted scenarios of forest productivity loss in countries subjected to increasing drought stress such as Mexico [17].
The objective of this study is to assess changes in stemwood radial growth and wood density to reconstruct stemwood C accumulation rates. We compared data from 15 Mexican conifers growing under different climate conditions to identify the main climatic variables regulating C capture. We hypothesize that tree species will present different responses in their stemwood C uptake rates to hydroclimate variability, specifically to winter–spring water availability which mainly affects tree growth rates in the study area [4,5].
2. Materials and Methods
2.1. Study Area and Sampling Details
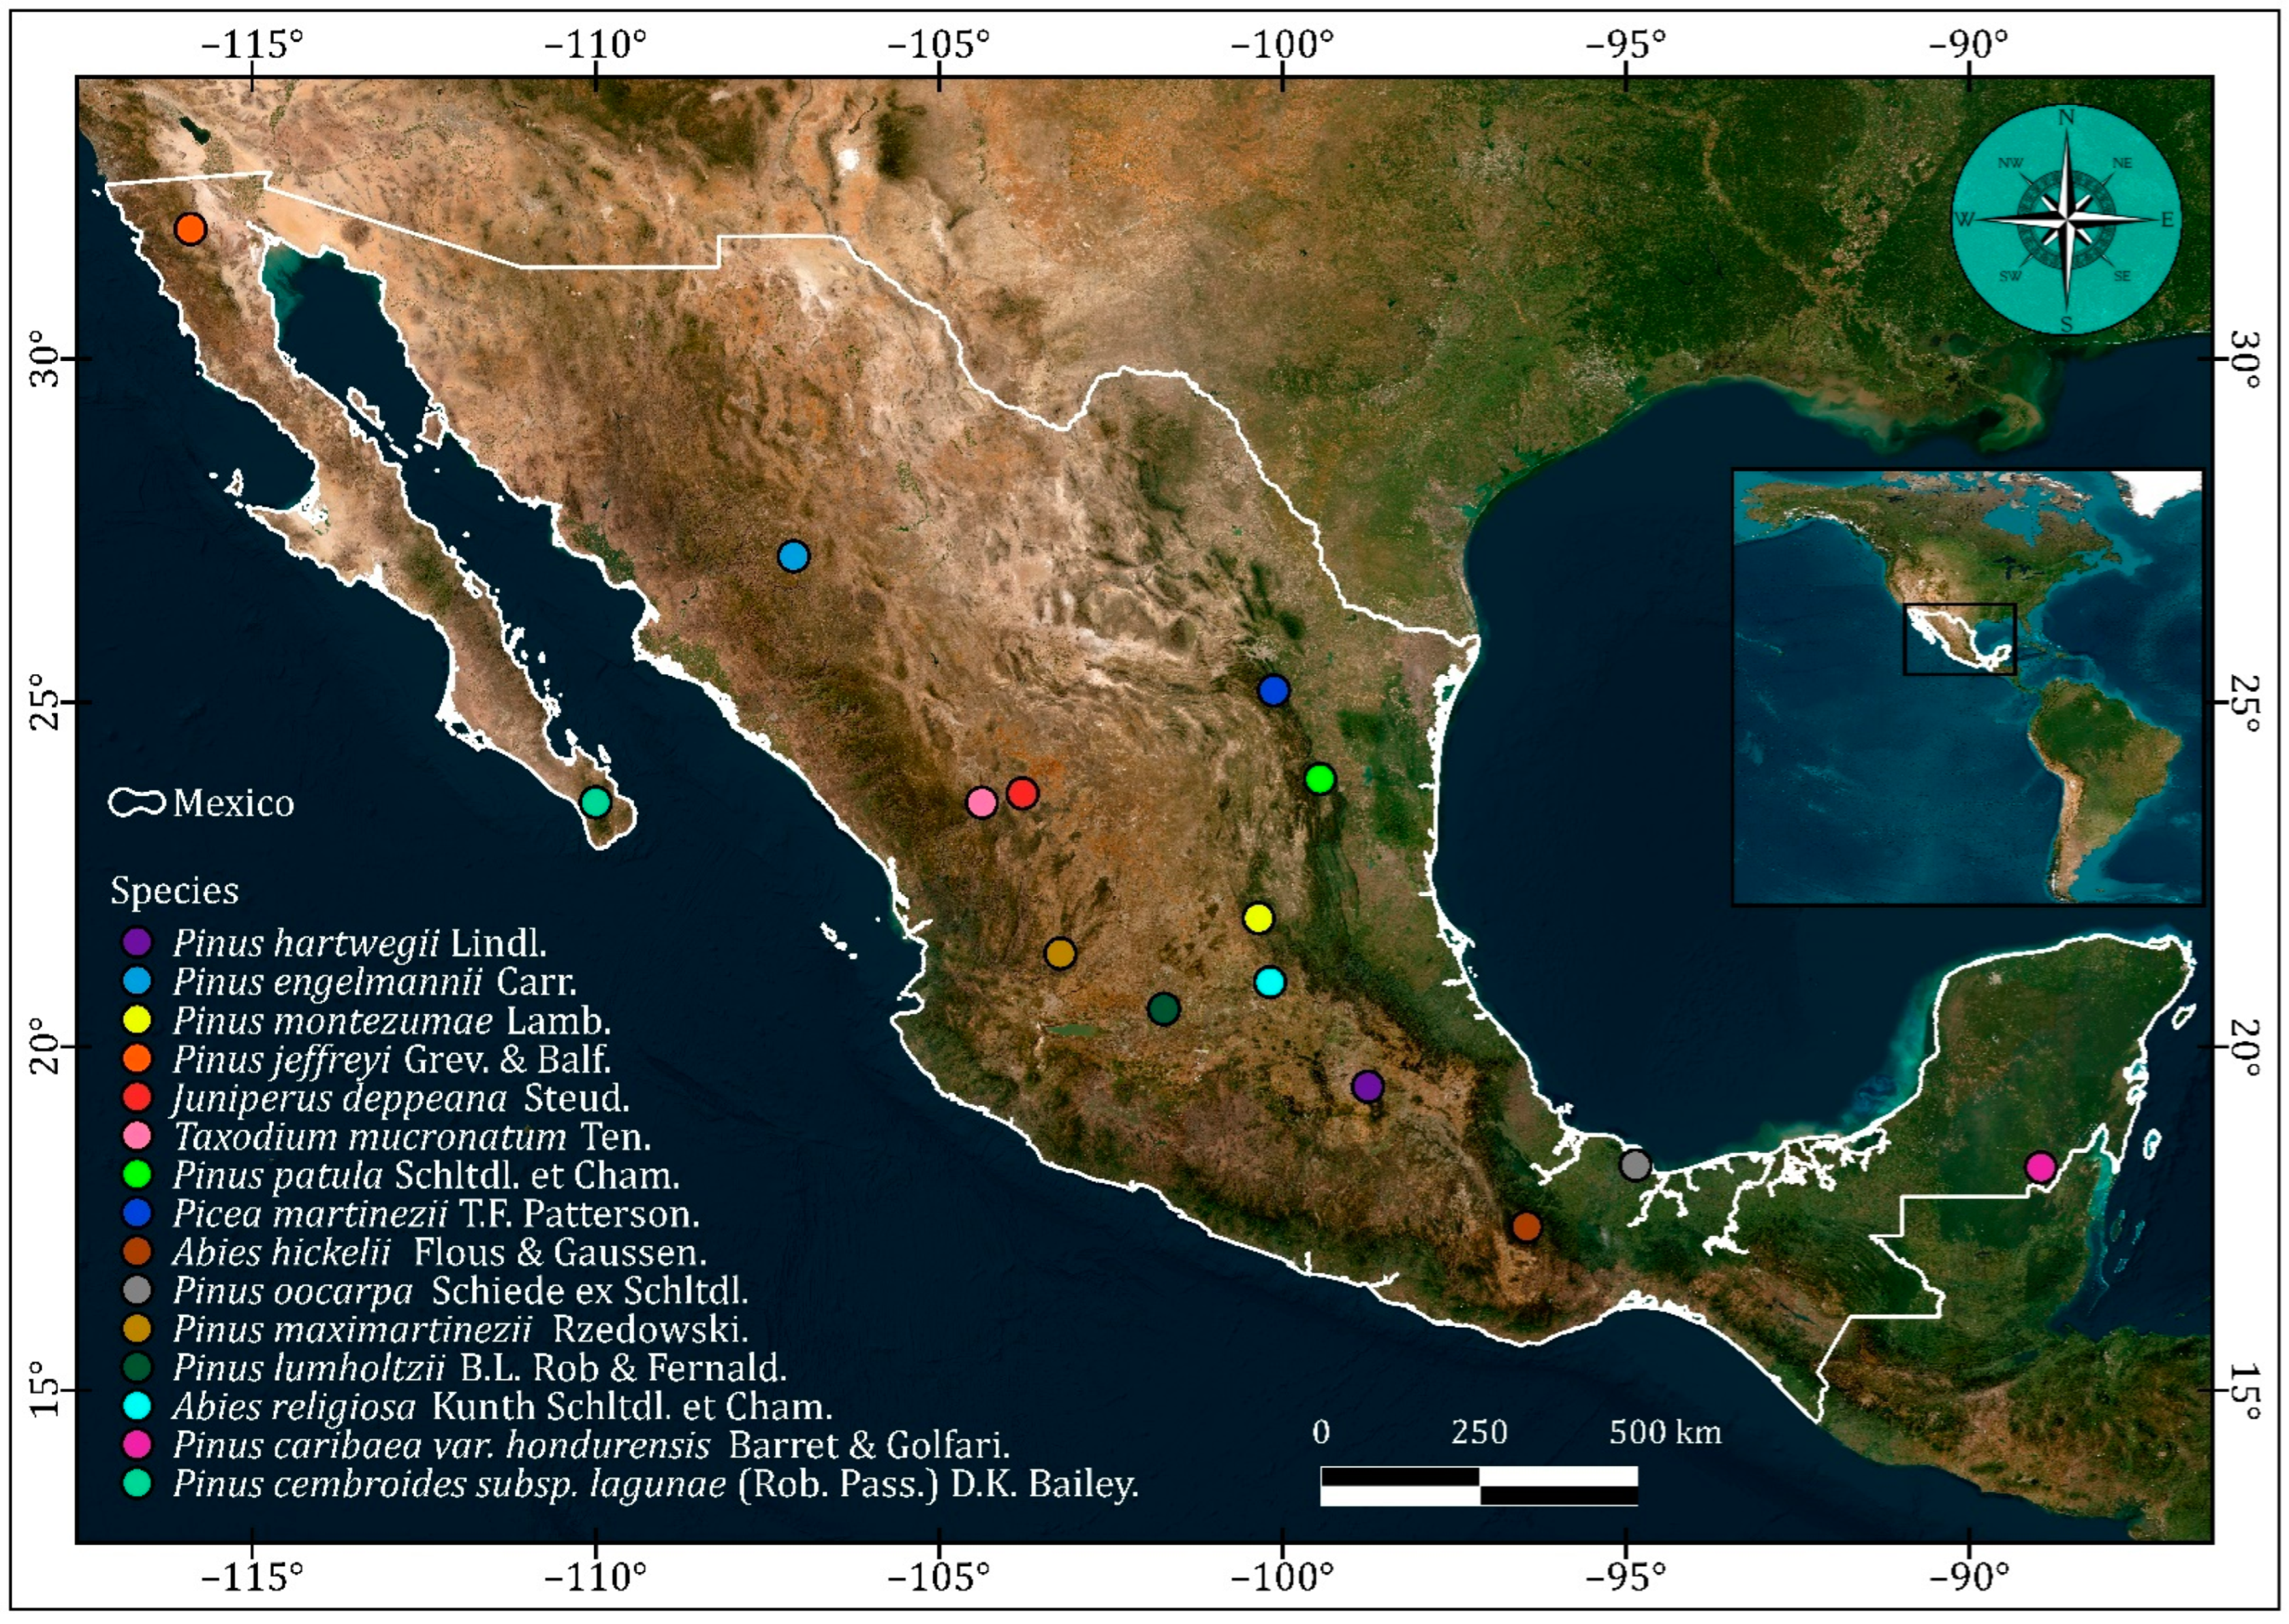
To encompass contrasting climatic conditions, 15 conifers located along bioclimatic gradients were sampled in Mexico, which is considered one of the most biodiverse regions of the planet [18] (Figure 1). The elevation at which these species were sampled ranged from 713 to 3500 m a.s.l. The dominant species in each stand occupied at least 70% of the basal area. From a random and centrally located tree, the 14 closest mature trees were selected to represent the stand, in contrast to the selective sampling of old trees growing in marginal conditions used to emphasize climate sensitivity (see [19]). Two cores were taken from each tree using a 5-mm Pressler increment borer at a height of 1.3 m above ground level, where the diameter at breast height was measured (DBH).
2.2. Tree-Ring Data
Once in the laboratory, wood samples were air dried, mounted, polished, and visually cross-dated following dendrochronological methods [20]. The visual cross-dating was checked using COFECHA software which calculates moving correlations between individual tree-ring width series and the site mean series [21]. Descriptive statistics related to growth data were calculated, specifically: the mean ring width and its standard deviation, the first-order autocorrelation (AR1), mean sensitivity (MS), and expressed population signal (EPS) (Table 1). The mean AR1 of ring widths measures year-to-year persistence in growth, while the mean MS of the ring-width accounts for relative changes in growth between consecutive years. The EPS is a measure of how coherent and replicated is a mean site ring-width series or chronology [22].
2.3. Series of Carbon Capture and Statistical Analysis
The two cores taken from each sampled tree were processed and measured in the tree-ring and wood anatomy laboratory at the University of São Paulo, Brazil. Initially, densitometry profiles were generated in an X-ray densitometry chamber (Faxitron X-Ray, Wheeling, IL, USA), with a measurement unit scale and a cellulose acetate wedge to calibrate wood density, according to established protocols [23,24]. Each radiographed sample was cross-dated to extract the annual density profile. Subsequently, the normal diameter was reconstructed from the total ring width (TRW) as an input for calculating the aboveground woody biomass (AWB) value for each species following [25] (Equation (1)). The AWB value allowed the annual C capture to be estimated (Equation (2)) considering the respective wood density (WD, in g cm–3) and the fact that WD responds to seasonal changes in climate [26,27].
where AWB is aboveground woody biomass, C is the annual carbon captured (in kg yr−1), and cf is the carbon factor, obtained according to specific laboratory analyses [28].
AWB = 0.0752 × DBH2.4448 × 2.0331WD
C = AWB × cf
To evaluate the influence of the climate on the annual C capture rates of the study species, Pearson correlation coefficients between C and monthly climatic variables were calculated considering a 0.05 significance level and using a window from previous Septembers to the current September. Prior to correlation analyses, we checked that the analyzed variables followed normal distributions. The climatic variables considered were the monthly mean maximum (Tmax) and minimum (Tmin) temperatures, and total precipitation (PP). The climatic data were obtained from the CRU TS 4.06 database at a 0.5° spatial resolution. We also calculated the Standardized Precipitation-Evapotranspiration Index (SPEI) to assess changes in drought intensity and duration [29]; We extracted data from the SPEI webpage (https://spei.csic.es/, accessed on 10 May 2023) also at a 0.5° resolution with a temporal scale of 1 to 48 months and from January to December.
To summarize the relationships between climatic variables and C accumulation rates, a principal component analysis (PCA) was calculated on the covariance matrix containing 585 values corresponding to the 39 Pearson correlation coefficients (13 for each climatic variable) of the 15 study species. The number of principal components was selected by examining a scree plot. Tree species were grouped according to their loadings on the first three principal components.
Linear mixed-effects models were used to analyze the relationship between the seasonal environmental variables and the carbon storage, as follows: winter PP (from the previous December to February of the growing season), and spring PP (from March to May), summer PP (from June to September), and autumn PP (from October to November) of the growing season for the last three seasons. The general form of the mixed-effects models is written as follows (Equations (3) and (4)):
where yi is the ni-dimensional vector of responses, β is the p-dimensional vector of fixed parameters, Xi and Zi are the ni × p and ni × (q + 1)-dimensional design matrices from unknown variables, bi is the (q + 1)-dimensional vector of Gaussian random effects, ei is the ni-dimensional vector of error terms, and Q is a positive semidefinite (q + 1) × (q + 1)-covariance matrix [30].
In model fitting, we used the carbon content (C) as a dependent variable. The fixed effects (predictors with interaction) of the model were the monthly climatic variables (Tmax, Tmin, PP) for each site or species. We selected the individual tree as the random effect and used a variance function to correct for heteroscedasticity. In this case, we used a power-type function to model the variance, expressed as follows (Equation (5)):
where σ2 and δ are the scale and shape parameters, respectively, and TRWij is a predictor (tree ring width) of the variance function [31] that could be assigned to the variance given by the fitted values [32]. All parameters of the mixed-effects models were estimated via restricted maximum likelihood (REML) with an nlme R-package, using the function lme [33].
3. Results
3.1. Growth and Carbon Accumulation Rates
The species with highest and lowest growth rates were T. mucronatum (7.67 mm) and P. caribaea (0.57 mm), respectively (Table 1). The mean growth rate of all species was 2.35 mm. The species with highest and lowest AR1 values were P. martinezii (0.70) and P. caribaea (0.31), respectively. The species with highest and lowest MS values were J. deppeana (0.59) and T. mucronatum (0.30), respectively. The interval common to all species, i.e., with well-replicated tree-ring width series, was 1987–2019. All species’ chronologies showed EPS values above the 0.85 threshold during this common timespan, indicating that they showed coherent growth signals. We found notable differences between species in C accumulation over time (Figure A1). For example, T. mucronatum stood out above the rest in this regard with a mean value of 19.64 kg yr−1, while P. cembroides presented the lowest value (1.58 kg yr−1).
3.2. Responses of Carbon Accumulation Rate to Climate Variability
The P. oocarpa C accumulation series positively correlated with PP in the previous winter and current summer, while P. engelmannii was notable for its positive relationship (r = 0.42) with PP in September (Figure 2). Rainfall in the previous winter negatively affected P. montezumae (e.g., February, r = −0.46), P. caribaea, T. mucrunatum, and A. hickelii mainly, while P. montezumae and A. hickelii negatively responded to April PP (r = −0.36 to −0.40).
The Tmax in the previous winter positively correlated with C capture in P. cembroides, P. engelmannii, Picea martinezii, P. montezumae (e.g., February, r = 0.45), P. maximartinezi, P. lumholtzii, and J. deppeana (Figure 2). The same response was found for spring and summer Tmax for P. engelmannii, P. montezumae, P. patula, P. cembroides, P. martinezii (April, r = 0.38) and, particularly, for T. mucrunatum (e.g., August, r = 0.44). The summer Tmax negatively affected J. deppeana and P. jeffreyi, while P. engelmannii (September, r = −0.41) and P. montezumae were influenced by early-autumn Tmax.
The Tmin during the previous winter played a positive role in C capture in species such as A. hickelii, J. deppeana, P. jeffreyii, and P. montezumae (February, r = 0.40), as well as in spring-summer for P. engelmannii, P. jeffreyii, and P. martinezii (Figure 2). Low summer Tmin negatively affected J. deppeana, T. mucrunatum (e.g., July, r = −0.38) and P. jeffreyi.
Finally, the calculation of the PCA summarizing C-climate relationships led to three principal components accounting for 27.9%, 16.7% and 12.3% of the total variance. The species’ loadings most important for the first principal component corresponded to P. montezumae and P. maximartinezii (Table 2). In the case of the second principal component, the highest loadings corresponded to T. mucrunatum and P. caribaea, while in the third principal component the highest loadings were found for P. jeffreyii and J. deppeana, with P. cembroides showing the lowest loadings.
3.3. Seasonal Influences on C Accumulation
The behavior of the model residuals was improved by incorporating the variance model (Figure A2). In general, it was found that the fixed effects with interaction had different results for species, seasons, and climate variables, which indicates that C accumulation responses to climate differ between tree species (Table A1).
In spring, precipitation had a significantly positive effect on C capture in species such as P. montezumae, A. religiosa, and P. engelmannii, while for T. mucronatum, P. maximartinezii, and P. lumhotlzii, the effect of precipitation was negative. The C capture in P. lumholtzii, T. mucronatum, and P. cembroides subs. lagunae was negatively affected by Tmax, while for A. religiosa, P. engelmannii, A. hickelii, and P. martinezii, C capture showed a positive relationship with Tmax. The Tmin had a positive effect on C capture in P. maximartinezii, P. hartwegii, P. cembroides subs. lagunae, and P. jeffreyi, while A. hickelii and P. patula were negatively affected.
In summer, PP had a positive influence on C capture for P. maximartinezii, P. lumholtzii, P. oocarpa, A. Religiosa, and T. mucronatum, while only P. hartwegii presented a negative influence on the accumulation of C. Regarding Tmax, P. jeffreyi, P. maximartinezii, T. mucronatum, P. lumholtzii, P. cembroides subs. lagunae, and P. montezumae had a significantly positive influence on C accumulation, while in the case of Tmin T. mucronatum, P. montezumae, P. lumholtzii, and P. jeffreyi were negatively affected in terms of C storage, while P. engelmannii showed a positive influence of Tmin on C accumulation.
During autumn, PP positively affected T. mucronatum, P. lumholtzii, P. engelmannii, P. martinezii, P. cembroides subs. lagunae, and P. patula, while P. maximartinezii and A. hickelii were negatively affected. The Tmax had a positive effect on T. mucronatum, P. hartwegii, A. hickelii, P. martinezii, and P. cembroides subs. lagunae, and only P. maximartinezii was negatively affected. On the other hand, Tmin showed a positive effect on P. hartwegii; however, T. mucronatum and P. martinezii were negatively impacted.
In winter, PP presented a significantly negative influence on the accumulation of C in P. hartwegii, A. hickelii, P. jeffreyi, P. oocarpa, and T. mucronatum. However, for P. martinezii, P. lumholtzii, P. cembroides subs. lagunae, and P. patula, the effect of PP was positive. The Tmax positively affected C capture in P. lumholtzii, P. martinezii, P. cembroides subs. lagunae, and P. montezumae, while the species that presented negative influences were P. hartwegii, A: hickelii, P. jeffreyi, and A. religiosa. Finally, C capture was also negatively affected by Tmin in P. martinezii, P. hartwegii, P. cembroides subs. lagunae, and P. oocarpa, whereas P. jeffreyi, P. lumholtzii, A. hickelii, T. mucronatum, and A. religiosa presented positive values.
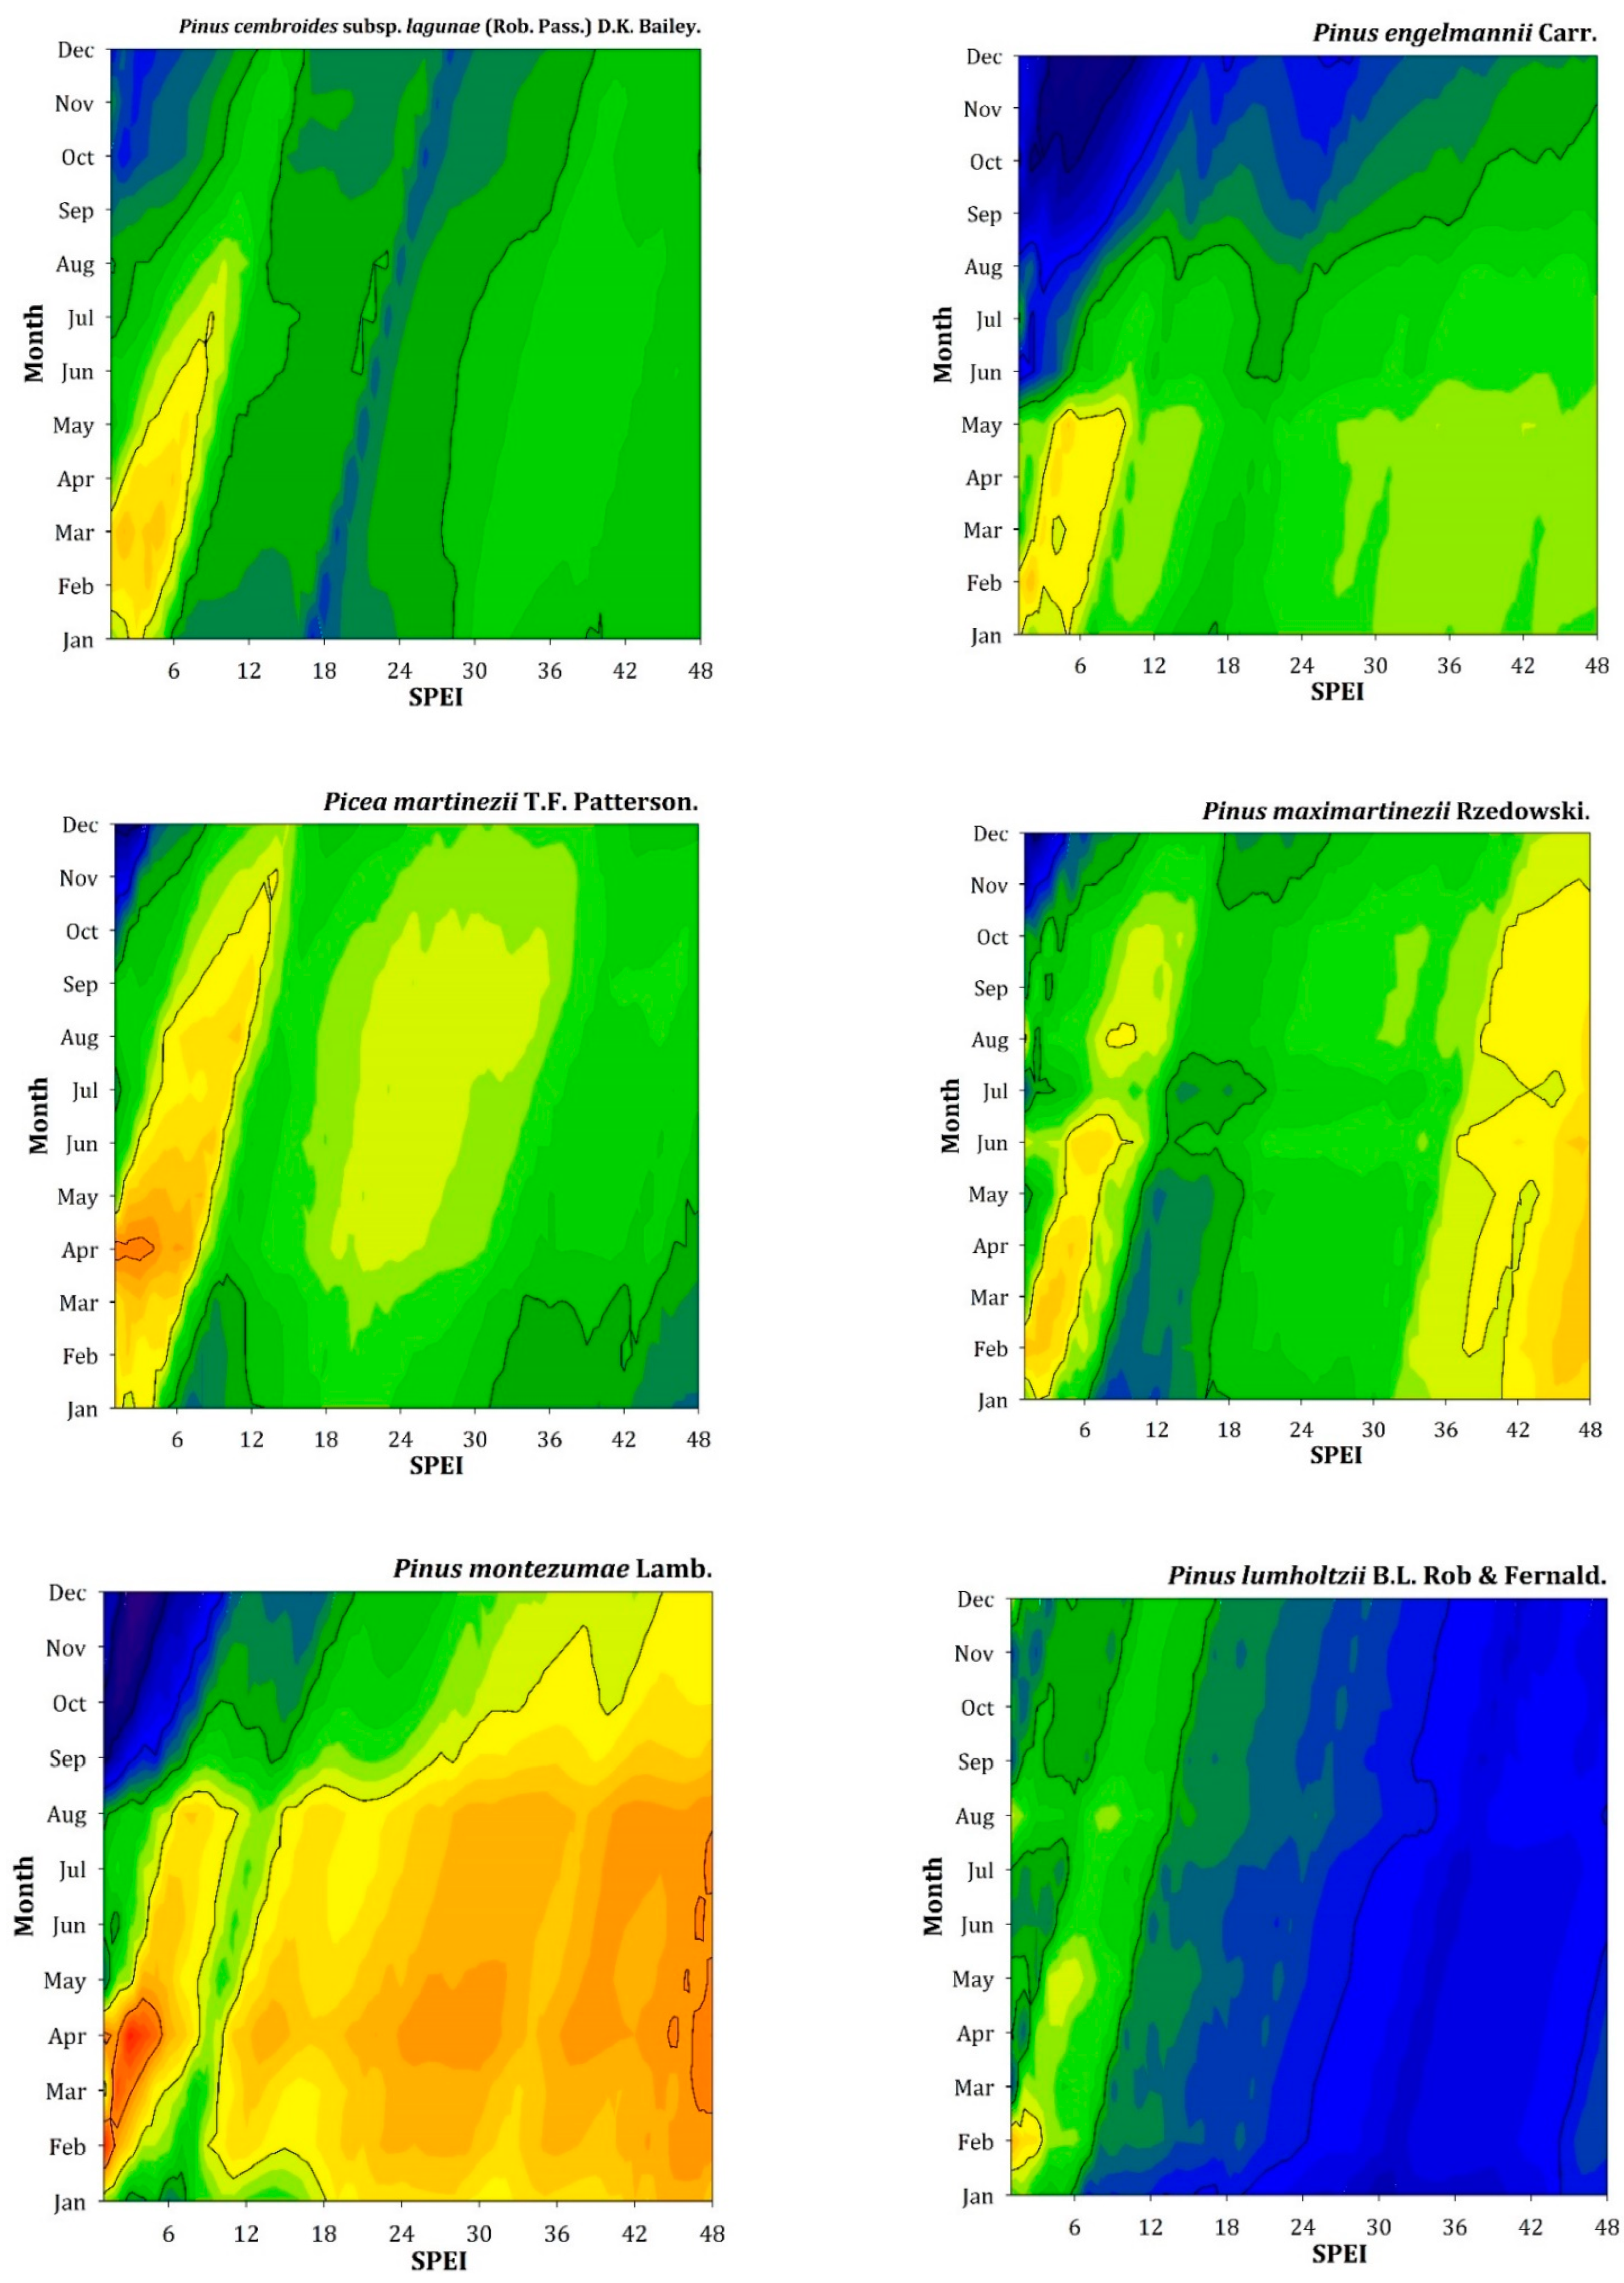
3.4. Carbon–SPEI Associations
Regarding associations between C accumulation rates and the SPEI drought index, we found positive relationships in some species (e.g., P. oocarpa, P. lumholtzii, P. hartwegii, A. religiosa) and negative relationships in other species (e.g., P. caribaea, T. mucronatum, P. martinezii, P. montezumae, A. hickelii, J. deppeana) (Figure A3). The two species with the highest and lowest C-SPEI correlations were P. hartwegii and P. montezumae at mid (6–9 months) to short (1–5 months) temporal scales, respectively. In both cases, these correlations were found from the previous winter to current spring.
4. Discussion
Our analyses improve the understanding of drought–growth relationships, in the context of forecasted climate warming, and how different impacts on radial growth and wood density would modify stemwood C accumulation rates under more arid conditions. The inter-annual ring width and wood density values were suitable proxies for modeling the temporal accumulation of C in Mexican conifers. The variability in C capture was influenced by the hydroclimate in this multi-species study, which is an unprecedented finding for Mexican forestry and tree-ring sciences.
Temporal rates of C capture among species differed, which is attributed to the adaptive discrepancies specific to their particular environments [16,34]. For example, the differences in C-accumulation rates between T. mucrunatum and P. cembroides could be directly related to the different soil moisture of the sites where they grow [35]. This highlights the importance of discerning the relevant role played by hydroclimatic variability as a driver of C accumulation, which is consistent with previous studies [36]. However, a greater radial growth does not necessarily imply C gain [37]. Environments with high moisture availability favor greater radial growth [38], whereas, in arid environments, water limitation reduced growth but may increase wood density and, potentially, C uptake [14,39].
The variable associations between monthly climate variables and C can be attributed to the adaptive conditions of each species, microsite conditions, plasticity, ontogenic trends, edaphic traits, topographic position, stand structure and forest type [36]. These findings are in line with those of previous studies such as [40], which argue that tree species develop specific response mechanisms to cope with hydroclimatic variability in drought-prone sites.
The combined influence of precipitation (PP) and mean maximum temperature (Tmax) in promoting C capture is evident. The effect of available soil water associated with high temperatures is reflected in the physiology of plants which show a more active cambium cell division and tracheid enlargement [41]. In spring and winter, the fitted models indicate positive influences on A. religiosa and P. engelmannii, whereas this occurs during summer in the case of P. maximartinezii, T. mucronatum, P. lumholtzii, P. martinezii, P. lumholtzii, and P. cembroides subs. lagunae. This concurs with other studies that reported seasonal humidity prior to the onset of growth as a driver of growth, perhaps by recharging soil moisture, while the summer climate influences the thickening of the tracheid cell walls being promoted by high temperatures [42]. In autumn, T. mucronatum, P. martinezii, and P. cembroides also benefitted from warm and wet conditions, which are related to the monsoon summer rains and delayed dormancy [43].
However, the humid and warm conditions also had a negative effect on C capture, as was the case in T. mucronatum and P. lumholtzii in spring, P. maximartinezii in autumn and P. hartwegii, A. hickelii, P. jeffreyi and P. oocarpa in winter. Previous studies have confirmed how hydroclimatic regimes have shifted and impacted tree growth [42]. Trees in neighboring sites have shown bimodality in growth [44], providing strong evidence of the extension of the growing season and changes in cambium phenology.
The minimum temperature (Tmin) plays a significant role in changes in wood density and tracheid maturation in latewood [45], which has implications for C accumulation rates. In contrast, Tmax reduces photosynthetic rates due to stress related to heatwaves and soil drying, which typically occur during drought events [46]. These dry conditions often reduce C uptake due to the decrease in available non-structural carbohydrates leading to carryover or legacy effects [47].
Regarding species behavior, T. mucronatum was very responsive throughout the year, which supports previous studies that report the species as highly sensitive to hydroclimate variability [48]. The summer and autumn PP and Tmax benefitted its C accumulation rate. Despite high summer evapotranspiration rates, this species seems to take advantage of its proximity to water bodies. In recent years, some tree species have been shown to present a bimodal growth pattern [49], which may also prolong their season of carbohydrate synthesis and wood formation (see [4]). Interestingly, spring PP and Tmax negatively affected C accumulation in this species, which can be attributed to cloudy conditions or increased evaporative demand [36].
The combined effect of rainfall and high temperatures at the beginning of the growing season may stress trees through the negative impact of elevated evapotranspiration rates [50,51]. The effects of increased temperatures with severe precipitation deficits have caused forest dieback and tree mortality due to high transpiration rates and hydraulic failure [1]. In this way, low biomass growth in drought-prone sites could reduce the competitive ability of some species to uptake C [14]. If this occurs, not only will net C gain be reduced, but carbon starvation may even occur and contribute to dieback. Interestingly, our findings are novel because drought-amplified stress may result in increased C pools [52]. In contrast, cold winter temperatures favor C accumulation by promoting the formation of more tracheids with thicker walls, whereas it negatively affects C accumulation by limiting tracheid expansion.
Three pines (P. maximartinezii, P. cembroides, and P. lumholtzii) were the species that showed significant relationships with seasonal climatic variation during three seasons. In all these seasons, the combination of PP and Tmax was the main driver of growth and its effect depended on the considered species. Overall, the magnitude of the statistical significance of the climatic influence was most notable during autumn, followed by summer (Figure 2). These results highlight the fact that the growing season may be extended after summer. According to [53], monsoon rains in conjunction with warm temperatures cause seasonal adjustments in the mechanisms of C synthesis and hydraulic functioning. Forecasted changes in the hydroclimate regimes will therefore have an impact on C fluxes, at least for these three species. Our results concur with those of previous studies that report the dependence of C production on thermal conditions and atmospheric demand in summer and autumn [36].
The capture of C in P. martinezii, P. engelmannii, A. religiosa, and P. jeffreyi was sensitive to summer and autumn hydroclimate conditions (combined influence of PP and Tmax, followed by Tmin). According to several authors, minimum temperatures regulate C allocation in tree organs (e.g., the stem, branches, shoots, leaves, and roots), which could explain this pattern [54].
The C accumulation in species such as J. deppeana and P. caribaea was less influenced by the hydroclimate (see Table A1). Under management scenarios, these species seem to be less affected by hydroclimate variability, although their resilience remains to be evaluated.
The mixed models improved the variance of climatic factors, but we must acknowledge that other variables should be incorporated into future studies, including genetic load, stand structure, site topography, soil features, disturbances, and xylogenesis data. A spatial analysis would refine the analyses of hydroclimate influences on C accumulation and allow identifying geographical patterns at the level of ecoregions and biomes [55]. Other limitations of our study are that we reconstructed the radial growth and aboveground woody biomass using general allometric equations, but we lacked detailed data on changes in belowground biomass and species-specific allometric relationships developed for the study sites. Our database nevertheless represents a solid input for adapting new algorithms relating changes in tree biomass and climate (see [16,56,57]) and, if necessary, replicating the analyses in other bioclimatic zones. Another important aspect would be to explore the use of other models such as generalized additive models, which would allow a better understanding of nonlinear influences of the hydroclimate on C capture.
5. Conclusions
There are differences in the C accumulation rate of the 15 conifer species studied across Mexico. Our findings reveal the critical role of the climate in the response of C accumulation. The combination of seasonal PP and Tmax is the main driver of C accumulation, suggesting a positive role in C capture of an extended growing season. The season to which most species respond is winter; however, the magnitude of the climatic influence of PP and Tmax on C capture is greatest during autumn, followed by summer. This means that the hydroclimate changes in autumn, and possibly late summer, are modulating stemwood C accumulation through changes in wood density and tracheid cell-wall thickness. Thus, droughts play a prominent role in the dynamics of C fluxes in the studied species. The modeling strategy allowed us to identify the seasonal climatic factors that affect the dynamics of C capture. This knowledge is crucial in the face of more frequent and severe climate extremes, such as hot droughts, to develop new strategies to improve forest resilience and C uptake.
Author Contributions
Conceptualization, M.P.-G.; methodology, E.D.V.-V. and E.A.R.-C.; software, M.P.-G., E.D.V.-V. and J.J.C.; validation, M.P.-G. and J.J.C.; formal analysis, M.P.-G., E.D.V.-V., E.A.R.-C. and J.J.C.; investigation, M.P.-G. and J.J.C.; writing—original draft preparation, M.P.-G., E.D.V.-V., E.A.R.-C. and J.J.C. All authors have read and agreed to the published version of the manuscript.
Funding
We thank CONACYT for the funding provided through project A1-S-21471, COCYTED, and DendroRed (http://dendrored.ujed.mx, accessed on 10 May 2023).
Data Availability Statement
Not applicable.
Acknowledgments
We thank Andrés Cruz Cruz (El Capy), Ciriaco Rangel Alonso, David Ezequiel Chávez Martínez, Emmanuel Cruz Canela, Esteban Casillas Núñez, Feliciano González Ávila, Gustavo Castañeda Rosales, Esaúl López Mendoza, Leonel Carmona Duarte, Mauro Ramírez Alavez, Sergio Ruíz Soto, José Alberto Ramos Caballero, José Antonio Álvaro Méndez, José Cruz Delgado Campos, Julio Godínez Rojo, Adrián Jesús Mendoza Herrera, Maximiliano García Flores, Miguel Hernández Espejel, Oscar Alfredo Díaz Carrillo, Roberto Carlos Valadez Castro, José Jesús García Cruz, José Remedios Hernández Hernández, Ramiro Martínez Acosta, Eduardo Pánuco Rivera, Rigoberto González Cubas, Humberto López Alejandro, Mariana García Flores, Alfredo Hernández Camacho, Sergio Hernández Sánchez, Joel Antonio Loya García, and Rubén Darío Appel Espinoza for the support provided in data collection. Additionally, we acknowledge the help of the Department of Forest Science of the University of São Paulo for the X-ray densitometry analysis.
Conflicts of Interest
The authors declare no conflict of interest.
Appendix A

Table A1.
Estimates of the fixed parameters and covariance parameters of the mixed linear models for tree-ring carbon accumulation in the fifteen species studied. Only significant models (p < 0.05) are presented.
Table A1.
Estimates of the fixed parameters and covariance parameters of the mixed linear models for tree-ring carbon accumulation in the fifteen species studied. Only significant models (p < 0.05) are presented.
| Season | Sign | Climate Variable | Species | Estimate | SE | t | p |
|---|---|---|---|---|---|---|---|
| Winter | Negative | Tmin | Pinus oocarpa | −1.5368 | 0.7296 | −2.1062 | 0.0352 |
| Picea martinezii | −0.1308 | 0.0323 | −4.0492 | 0.0001 | |||
| Pinus cembroides | −0.1228 | 0.0551 | −2.2277 | 0.0259 | |||
| Pinus hartwegii | −0.3016 | 0.1161 | −2.5969 | 0.0094 | |||
| Tmax | Abies hickelii | −0.6911 | 0.1883 | −3.6698 | 0.0002 | ||
| Pinus hartwegii | −0.5182 | 0.091 | −5.6959 | 0 | |||
| Pinus jeffreyi | −0.3339 | 0.1106 | −3.0193 | 0.0025 | |||
| Abies religiosa | −0.18 | 0.0843 | −2.135 | 0.0328 | |||
| PP | Taxodium mucronatum | −0.0343 | 0.0159 | −2.1612 | 0.0307 | ||
| Abies hickelii | −0.0171 | 0.0035 | −4.8889 | 0 | |||
| Pinus hartwegii | −0.0149 | 0.0037 | −4.065 | 0 | |||
| Pinus oocarpa | −0.0058 | 0.0025 | −2.3059 | 0.0211 | |||
| Pinus jeffreyi | −0.0032 | 0.0014 | −2.3868 | 0.017 | |||
| Positive | Tmin | Abies religiosa | 0.2212 | 0.1049 | 2.1075 | 0.0351 | |
| Pinus jeffreyi | 0.5046 | 0.1225 | 4.1211 | 0 | |||
| Pinus lumholtzii | 0.7868 | 0.1446 | 5.443 | 0 | |||
| Taxodium mucronatum | 1.0204 | 0.4261 | 2.3945 | 0.0167 | |||
| Abies hickelii | 1.6024 | 0.2587 | 6.1943 | 0 | |||
| Tmax | Pinus lumholtzii | 1.5527 | 0.108 | 14.3716 | 0 | ||
| Picea martinezii | 0.1705 | 0.0296 | 5.7669 | 0 | |||
| Pinus cembroides | 0.2214 | 0.061 | 3.632 | 0.0003 | |||
| Pinus montezumae | 0.4707 | 0.2022 | 2.3283 | 0.0199 | |||
| PP | Pinus cembroides | 0.0046 | 0.0016 | 2.8948 | 0.0038 | ||
| Picea martinezii | 0.0058 | 0.0012 | 4.9885 | 0 | |||
| Pinus patula | 0.0093 | 0.0034 | 2.7421 | 0.0061 | |||
| Pinus lumholtzii | 0.0145 | 0.0049 | 2.9258 | 0.0034 | |||
| Spring | Negative | Tmin | Pinus patula | −0.2487 | 0.1225 | −2.0313 | 0.0422 |
| Abies hickelii | −1.1976 | 0.2997 | −3.996 | 0.0001 | |||
| Tmax | Pinus lumholtzii | −1.1581 | 0.1263 | −9.1675 | 0 | ||
| Taxodium mucronatum | −1.6198 | 0.5184 | −3.1244 | 0.0018 | |||
| Pinus cembroides | −0.1741 | 0.0605 | −2.8753 | 0.004 | |||
| PP | Taxodium mucronatum | −0.059 | 0.0163 | −3.6169 | 0.0003 | ||
| Pinus lumholtzii | −0.0071 | 0.0033 | −2.149 | 0.0316 | |||
| Pinus maximartinezii | −0.0051 | 0.0023 | −2.2416 | 0.025 | |||
| Positive | Tmin | Pinus hartwegii | 0.6474 | 0.1621 | 3.9931 | 0.0001 | |
| Pinus maximartinezii | 0.4826 | 0.1116 | 4.3254 | 0 | |||
| Pinus cembroides | 0.2111 | 0.0734 | 2.8766 | 0.004 | |||
| Pinus jeffreyi | 0.3072 | 0.1461 | 2.1024 | 0.0355 | |||
| Tmax | Abies religiosa | 0.3252 | 0.1057 | 3.0769 | 0.0021 | ||
| Pinus engelmannii | 0.2203 | 0.0767 | 2.8719 | 0.0041 | |||
| Picea martinezii | 0.1044 | 0.0428 | 2.4421 | 0.0146 | |||
| Abies hickelii | 0.5974 | 0.2391 | 2.4985 | 0.0125 | |||
| PP | Abies religiosa | 0.0063 | 0.0025 | 2.5159 | 0.0119 | ||
| Pinus engelmannii | 0.0063 | 0.003 | 2.0743 | 0.0381 | |||
| Pinus montezumae | 0.0273 | 0.0099 | 2.7596 | 0.0058 | |||
| Summer | Negative | Tmin | Taxodium mucronatum | −4.4819 | 0.7411 | −6.0481 | 0 |
| Pinus montezumae | −1.791 | 0.4078 | −4.3919 | 0 | |||
| Pinus lumholtzii | −0.6931 | 0.236 | −2.9364 | 0.0033 | |||
| Pinus jeffreyi | −0.449 | 0.1686 | −2.6628 | 0.0078 | |||
| PP | Pinus hartwegii | −0.0017 | 0.0007 | −2.3339 | 0.0196 | ||
| Positive | Tmin | Pinus engelmannii | 0.7208 | 0.135 | 5.3374 | 0 | |
| Tmax | Pinus cembroides | 0.1858 | 0.0763 | 2.4353 | 0.0149 | ||
| Pinus lumholtzii | 0.3907 | 0.1519 | 2.5722 | 0.0101 | |||
| Pinus maximartinezii | 0.5895 | 0.1069 | 5.5144 | 0 | |||
| Pinus jeffreyi | 0.7097 | 0.1415 | 5.0162 | 0 | |||
| Taxodium mucronatum | 2.784 | 0.5612 | 4.9607 | 0 | |||
| Pinus montezumae | 0.8204 | 0.4037 | 2.0325 | 0.0421 | |||
| PP | Pinus oocarpa | 0.0022 | 0.0009 | 2.4589 | 0.0139 | ||
| Abies religiosa | 0.0027 | 0.0012 | 2.3231 | 0.0202 | |||
| Pinus engelmannii | 0.004 | 0.0008 | 5.1523 | 0 | |||
| Pinus lumholtzii | 0.0041 | 0.0011 | 3.6587 | 0.0003 | |||
| Taxodium mucronatum | 0.0119 | 0.0052 | 2.2956 | 0.0217 | |||
| Fall | Negative | Tmin | Picea martinezii | −0.1043 | 0.0435 | −2.3945 | 0.0167 |
| Taxodium mucronatum | −2.0539 | 0.487 | −4.2174 | 0 | |||
| Tmax | Pinus maximartinezii | −0.3713 | 0.0773 | −4.8055 | 0 | ||
| Positive | Tmin | Pinus hartwegii | 0.5715 | 0.1372 | 4.1665 | 0 | |
| Tmax | Picea martinezii | 0.0822 | 0.0389 | 2.1136 | 0.0346 | ||
| Pinus cembroides | 0.1456 | 0.0738 | 1.9738 | 0.0484 | |||
| Abies hickelii | 0.5509 | 0.2499 | 2.2049 | 0.0275 | |||
| Taxodium mucronatum | 2.0133 | 0.4782 | 4.21 | 0 | |||
| Pinus hartwegii | 0.8879 | 0.1062 | 8.3609 | 0 | |||
| PP | Pinus maximartinezii | −0.0034 | 0.001 | −3.3869 | 0.0007 | ||
| Abies hickelii | −0.0029 | 0.0012 | −2.4512 | 0.0142 | |||
| Picea martinezii | 0.0012 | 0.0003 | 4.0476 | 0.0001 | |||
| Pinus cembroides | 0.0013 | 0.0004 | 3.7593 | 0.0002 | |||
| Pinus patula | 0.0037 | 0.001 | 3.5108 | 0.0004 | |||
| Pinus engelmannii | 0.0051 | 0.0013 | 3.7902 | 0.0002 | |||
| Pinus lumholtzii | 0.0057 | 0.0015 | 3.833 | 0.0001 | |||
| Taxodium mucronatum | 0.0399 | 0.0063 | 6.3051 | 0 |
Figure A1.
Chronologies of C accumulation (kg yr−1) per species. Values are means ± SE.


Figure A2.
Residuals of the mixed models.

Figure A3.
Correlations between series of C accumulation rates and the SPEI drought index calculated from January to December (y axes) at 1- to 48-month long scales (x axes).
Figure A3.
Correlations between series of C accumulation rates and the SPEI drought index calculated from January to December (y axes) at 1- to 48-month long scales (x axes).


References
- Allen, C.D.; Breshears, D.D.; McDowell, N.G. On underestimation of global vulnerability to tree mortality and forest die-off from hotter drought in the Anthropocene. Ecosphere 2015, 6, 75–78. [Google Scholar] [CrossRef]
- Babst, F.; Wright, W.E.; Szejner, P.; Wells, L.; Belmecheri, S.; Monson, R.K. Blue intensity parameters derived from Ponderosa pine tree rings characterize intra-annual density fluctuations and reveal seasonally divergent water limitations. Trees 2016, 30, 1403–1415. [Google Scholar] [CrossRef]
- Sperlich, D.; Nadal-Sala, D.; Gracia, C.; Kreuzwieser, J.; Hanewinkel, M.; Yousefpour, R. Gains or Losses in Forest Productivity under Climate Change? The Uncertainty of CO2 Fertilization and Climate Effects. Climate 2020, 8, 141. [Google Scholar] [CrossRef]
- Pompa-García, M.; Altman, J.; Páez-Meráz, D.S.; Martínez-Rivas, J.A. Spatiotemporal Variability in Disturbance Frequency and Severity across Mexico: Evidence from Conifer Tree Rings. Forests 2023, 14, 900. [Google Scholar] [CrossRef]
- Vivar-Vivar, E.D.; Pompa-García, M.; Rodríguez-Trejo, D.A.; Leyva-Ovalle, A.; Wehenkel, C.; Carrillo-Parra, A.; García-Montiel, E.; Moreno-Anguiano, O. Drought responsiveness in two Mexican conifer species forming young stands at high elevations. For. Syst. 2021, 30, e012. [Google Scholar] [CrossRef]
- Su, H.; Axmacher, J.C.; Yang, B.; Sang, W. Differential radial growth response of three coexisting dominant tree species to local and large-scale climate variability in a subtropical evergreen broad-leaved forest of China. Ecol. Res. 2015, 30, 745–754. [Google Scholar] [CrossRef]
- Dulamsuren, C.; Hauck, M.; Kopp, G.; Ruff, M.; Leuschner, C. European beech responds to climate change with growth decline at lower, and growth increase at higher elevations in the center of its distribution range (SW Germany). Trees 2017, 31, 673–686. [Google Scholar] [CrossRef]
- Allen, C.D.; Macalady, A.K.; Chenchouni, H.; Bachelet, D.; McDowell, N.; Vennetier, M.; Kitzberger, T.; Rigling, A.; Breshears, D.D.; Hogg, E.H.; et al. A Global Overview of Drought and Heat-Induced Tree Mortality Reveals Emerging Climate Change Risks for Forests. For. Ecol. Manag. 2010, 259, 660–684. [Google Scholar] [CrossRef] [Green Version]
- Olson, D.M.; Dinerstein, E.; Wikramanayake, E.D.; Burgess, N.D.; Powell, G.V.N.; Underwood, E.C.; D’amico, J.A.; Itoua, I.; Strand, H.E.; Morrison, J.C.; et al. Terrestrial Ecoregions of the World: A New Map of Life on Earth: A new global map of terrestrial ecoregions provides an innovative tool for conserving biodiversity. BioScience 2001, 51, 933–938. [Google Scholar] [CrossRef]
- Farjon, A.; Styles, B.T. Pinus (Pinaceae) Flora Neotropica Monograph 75; The New York Botanical Garden: New York, NY, USA, 1997. [Google Scholar]
- Contreras-Medina, R.; Luna-Vega, I. Species richness, endemism and conservation of Mexican gymnosperms. Biodivers. Conserv. 2007, 16, 1803–1821. [Google Scholar] [CrossRef]
- Salinas-Rodríguez, M.M.; Hernández-Sandoval, L.; Carrillo-Reyes, P.; Castillo-Gómez, H.A.; Castro-Castro, A.; Estrada-Castillón, E.; Figueroa-Martínez, D.S.; Gómez-Escamilla, I.N.; González-Elizondo, M.; Gutiérrez-Ortega, J.S.; et al. Diversidad de Plantas Vasculares de la Provincia Fisiográfica de la Sierra Madre Oriental, México. Bot. Sci. 2022, 100, 469–492. [Google Scholar] [CrossRef]
- González-Elizondo, M.S.; González-Elizondo, M.; Tena-Flores, J.A.; Ruacho-González, L.; López-Enríquez, I.L. Vegetación de la Sierra Madre Occidental, México: Una síntesis. Acta Bot. Mex. 2012, 100, 351–403. [Google Scholar] [CrossRef] [Green Version]
- Babst, F.; Alexander, M.R.; Szejner, P.; Bouriaud, O.; Klesse, S.; Roden, J.; Ciais, P.; Poulter, B.; Frank, D.; Moore, D.J.; et al. A tree-ring perspective on the terrestrial carbon cycle. Oecologia 2014, 176, 307–322. [Google Scholar] [CrossRef] [Green Version]
- Lockwood, B.R.; Maxwell, J.T.; Robenson, S.M.; Au, T.F. Assessing bias in diameter at breast height estimated from tree rings and its effects on basal area increment and biomass. Dendrochronologia 2021, 67, 125844. [Google Scholar] [CrossRef]
- Lara, W.; Bravo, F.; Maguire, D.A. Modeling patterns between drought and tree biomass growth from dendrochronological data: A multilevel approach. Agric. For. Meteorol. 2013, 178–179, 140–151. [Google Scholar] [CrossRef]
- Brienen, R.J.W.; Caldwell, L.; Duchesne, L.; Voelker, S.; Barichivich, J.; Baliva, M.; Ceccantini, G.; Filippo, A.D.; Helama, S.; Locosselli, G.M.; et al. Forest carbon sink neutralized by pervasive growth-lifespan trade-offs. Nat. Commun. 2020, 11, 4241. [Google Scholar] [CrossRef] [PubMed]
- Morrone, J.J. Utilización y conservación de los ecosistemas terrestres de México: Pasado presente y futuro. Rev. Mex. Biodivers. 2019, 90, e902980. [Google Scholar] [CrossRef] [Green Version]
- Villanueva-Díaz, J.; Stahle, D.W.; Luckman, B.H.; Cerano-Paredes, J.; Therrell, M.D.; Cleaveland, M.K.; Cornejo-Oviedo, E. Winter-spring precipitation reconstructions from tree rings for northeast Mexico. Clim. Change 2007, 83, 117–131. [Google Scholar] [CrossRef]
- Fritts, H.C. Tree Ring and Climate; Academic Press: London, UK, 1976; 582p. [Google Scholar]
- Holmes, R.L. Computer-Assisted Quality Control in Tree-ring dating and Measurement. Tree-Ring Bull. 1983, 43, 51–67. [Google Scholar]
- Wigley, T.M.L.; Briffa, K.R.; Jones, P.D. On the Average Value of Correlated Time Series, with Applications in Dendroclimatology and Hydrometeorology. J. Appl. Meteorol. 1984, 23, 201–213. [Google Scholar] [CrossRef]
- Tomazello, M.; Brazolin, S.; Chagas, M.P.; Oliveira, J.T.S.; Ballarin, A.W.; Benjamin, C.A. Application of X-Ray technique in nondestructive evaluation of eucalypt wood. Maderas Cienc. Tecnol. 2008, 10, 139–149. [Google Scholar] [CrossRef] [Green Version]
- Quintilhan, M.T.; Santini, L., Jr.; Ortega Rodríguez, D.R.; Guillemot, J.; Marangom Cesilio, G.H.; Chambi-Legoas, R.; Nouvellon, Y.; Tomazello-Filho, M. Growth-ring boundaries of tropical tree species: Aiding delimitation by long histological sections and wood density profiles. Dendrochronologia 2021, 69, 125878. [Google Scholar] [CrossRef]
- Návar, J. Allometric equations for tree species and carbon stocks for forests of northwestern Mexico. For. Ecol. Manag. 2009, 257, 427–434. [Google Scholar] [CrossRef]
- Bouriaud, O.; Bréda, N.; Moguédec, G.L.; Nepveu, G. Modelling variability of wood density in beech as affected by ring age, radial growth and climate. Trees 2004, 18, 264–276. [Google Scholar] [CrossRef]
- Pompa-García, M.; Venegas-González, A.; Júnior, A.A.; Sigala-Rodríguez, J.A. Dendroecological Approach to Assessing Carbon Accumulation Dynamics in Two Pinus Species from Northern Mexico. Tree-Ring Res. 2018, 74, 196–209. [Google Scholar] [CrossRef]
- Pompa-García, M.; Sigala-Rodríguez, J.A.; Jurado, E.; Flores, J. Tissue carbon concentration of 175 Mexican forest species. iForest 2017, 10, 754–758. [Google Scholar] [CrossRef] [Green Version]
- Vicente-Serrano, S.M.; Beguería, S.; López-Moreno, J.I. A Multiscalar Drought Index Sensitive to Global Warming: The Standardized Precipitation Evapotranspiration Index. J. Clim. 2010, 23, 1696–1718. [Google Scholar] [CrossRef] [Green Version]
- Fahrmeir, L.; Kneib, T.; Lang, S.; Marx, B.D. Regression Models. In Regression, 2nd ed.; Fahrmeir, L., Kneib, T., Lang, S., Marx, B.D., Eds.; Springer: Berlin/Heidelberg, Germany, 2021; pp. 23–84. [Google Scholar] [CrossRef]
- Mehtätalo, L.; Lappi, J. Biometry for Forestry and Environmental Data with Examples in R, 1st ed.; CRC Press: Boca Raton, FL, USA, 2020; 426p. [Google Scholar]
- Pinheiro, J.; Bates, D. Mixed-Effects Models in S and S-PLUS; Springer: New York, NY, USA, 2000; 528p. [Google Scholar]
- Pinheiro, J.; Bates, D.; DebRoy, S.; Sarkar, D.; EISPACK; Heisterkamp, S.; Willigen, B.V.; Ranke, J.; R Core Team. NLME: Linear and Nonlinear Mixed Effects Models. R Package Version 3.1-162. 2023. Available online: https://CRAN.R-project.org/package=nlme (accessed on 10 April 2023).
- Bogino, S.; Bravo, F. Climate and intraannual density fluctuations in Pinus pinaster subsp. mesogeensis in Spanish woodlands. Can. J. For. Res. 2009, 39, 157–1565. [Google Scholar] [CrossRef]
- Grünzweig, J.M.; Lin, T.; Rotenberg, E.; Schwartz, A.; Yakir, D. Carbon sequestration in arid-land forest. Glob. Chang. Biol. 2003, 9, 791–799. [Google Scholar] [CrossRef]
- Acosta-Hernández, A.C.; Padilla-Martínez, J.R.; Hernández-Díaz, J.C.; Prieto-Ruíz, J.A.; Goche-Telles, J.R.; Nájera-Luna, J.A.; Pompa-García, M. Influence of Climate on Carbon Sequestration in Conifers Growing under Contrasting Hydro-Climatic Conditions. Forests 2020, 11, 1134. [Google Scholar] [CrossRef]
- Larysch, E.; Stangler, D.F.; Puhlmann, H.; Rathgeber, C.B.K.; Sifert, T.; Kahle, H.P. The 2018 hot drought pushed conifer wood formation to the limit of its plasticity: Consequences for woody biomass production and tree ring structure. Plant Biol. 2022, 24, 1171–1185. [Google Scholar] [CrossRef]
- Martin-Benito, D.; Beeckman, H.; Cañellas, I. Influence of drought on tree rings and tracheid features of Pinus nigra and Pinus sylvestris in a mesic Mediterranean forest. Eur. J. For. Res. 2013, 132, 33–45. [Google Scholar] [CrossRef]
- Lima, A.L.A.; Rodal, M.J.N. Phenology and wood density of plants growing in the semi-arid region of northeastern Brazil. J. Arid Environ. 2010, 74, 1363–1373. [Google Scholar] [CrossRef]
- Pacheco, A.; Camarero, J.J.; Pompa-García, M.; Battipaglia, G.; Voltas, J.; Carrer, M. Growth, wood anatomy and stable isotopes show species-specific couplings in three Mexican conifers inhabiting drought-prone areas. Sci. Total Environ. 2020, 698, 134055. [Google Scholar] [CrossRef]
- Chaves, M.M.; Maroco, J.P.; Pereira, J.S. Understanding plant responses to drought—From genes to the whole plant. Funct. Plant Biol. 2003, 30, 239–264. [Google Scholar] [CrossRef] [PubMed]
- González-Cásares, M.; Pompa-García, M.; Venegas-González, A.; Domínguez-Calleros, P.; Hernández-Díaz, J.; Carrillo-Parra, A.; Gozález-Tagle, M. Hydroclimatic variations reveal differences in carbon capture in two sympatric conifers in northern Mexico. PeerJ 2019, 7, e7085. [Google Scholar] [CrossRef] [PubMed]
- Pumijumnong, N.; Songtrirat, P.; Buajan, S.; Preechamart, S.; Chareonwong, U.; Muangsong, C. Climate control of cambial dynamics and tree-ring width in two tropical pines in Thailand. Agric. For. Meteorol. 2021, 303, 108394. [Google Scholar] [CrossRef]
- Pompa-García, M.; Camarero, J.J.; Colangelo, M.; Gallardo-Salazar, J.L. Xylogenesis is uncoupled from forest productivity. Trees 2021, 35, 1123–1134. [Google Scholar] [CrossRef]
- Pompa-García, M.; Camarero, J.J.; Colangelo, M. Different xylogenesis responses to atmospheric water demand contribute to species coexistence in a mixed pine–oak forest. J. For. Res. 2023, 34, 51–62. [Google Scholar] [CrossRef]
- Pompa-García, M.; Camarero, J.J.; Vivar-Vivar, E.D. Contrasting climate drivers of seasonal growth in western vs. eastern Mexican mountain conifer forests. For. Ecosys. 2023, 10, 100091. [Google Scholar] [CrossRef]
- Anderegg, W.R.L.; Schwalm, C.; Biondi, F.; Camarero, J.J.; Koch, G.; Litvak, M.; Ogle, K.; Shaw, J.D.; Shevliakova, E.; Williams, A.P.; et al. Pervasive drought legacies in forest ecosystems and their implications for carbon cycle models. Science 2015, 349, 528–532. [Google Scholar] [CrossRef] [Green Version]
- Villanueva-Díaz, J.; Stahle, D.W.; Therrell, M.D.; Beramendi-Orosco, L.; Estrada-Ávalos, J.; Martínez-Sifuentes, A.R.; Astudillo-Sánchez, C.C.; Cervantes-Martínez, R.; Cerano-Paredes, J. The climatic response of baldcypress (Taxodium mucronatum Ten.) in San Luis Potosi, Mexico. Trees 2020, 34, 623–635. [Google Scholar] [CrossRef]
- Camarero, J.J.; Olano, J.M.; Parras, A. Plastic bimodal xylogenesis in conifers from continental Mediterranean climates. New Phytol. 2009, 185, 471–480. [Google Scholar] [CrossRef]
- Pompa-García, M.; Vivar-Vivar, E.D.; Sigala-Rodríguez, J.A.; Padilla-Martínez, J.R. What Are Contemporary Mexican Conifers Telling Us? A Perspective Offered from Tree Rings Linked to Climate and the NDVI along a Spatial Gradient. Remote Sens. 2022, 14, 4506. [Google Scholar] [CrossRef]
- Zani, D.; Crowther, T.W.; Mo, L.; Renner, S.S.; Zohner, C.M. Increased growing-season productivity drives earlier autumn leaf senescence in temperate trees. Science 2020, 370, 1066–1071. [Google Scholar] [CrossRef]
- Zhang, C.; Stratopoulos, L.M.F.; Pretzsch, H.; Rötzer, T. How Do Tilia cordata Greenspire Trees Cope with Drought Stress Regarding Their Biomass Allocation and Ecosystem Services? Forests 2019, 10, 676. [Google Scholar] [CrossRef] [Green Version]
- Rasheed, A.; Koyro, H.W.; Hameed, A.; Gul, B. Physiological responses of the xero-halophyte Salsola drummondii to seasonal alterations of environmental conditions in a salt desert. Ecol. Res. 2022, 37, 738–752. [Google Scholar] [CrossRef]
- Dybzinski, R.; Farrior, C.; Wolf, A.; Reich, P.B.; Pacala, S.W. Evolutionarily stable strategy carbon allocation to foliage, wood, and fine roots in trees competing for light and nitrogen: An analytically tractable, individual-based model and quantitative comparisons to data. Am. Nat. 2011, 177, 153–166. [Google Scholar] [CrossRef] [Green Version]
- Harris, N.L.; Gibbs, D.A.; Baccini, A.; Birdsey, R.A.; Bruins, S.; Farina, M.; Fatoyinbo, L.; Hansen, M.C.; Herold, M.; Houghton, R.A.; et al. Global maps of twenty-first century forest carbon fluxes. Nat. Clim. Change 2021, 11, 234–240. [Google Scholar] [CrossRef]
- Collado, E.; Bonet, J.A.; Camarero, J.J.; Egli, S.; Peter, M.; Salo, K.; Martínez-Peña, F.; Ohenoja, E.; Martín-Pinto, P.; Primicia, I.; et al. Mushroom productivity trends in relation to tree growth and climate across different European forest biomes. Sci. Total Env. 2019, 689, 602–615. [Google Scholar] [CrossRef] [PubMed]
- Moreno-Fernández, D.; Camarero, J.J.; García, M.; Lines, E.R.; Sánchez-Dávila, J.; Tijerín, J.; Valeriano, C.; Viana-Soto, A.; Zavala, M.A.; Ruiz-Benito, P. The Interplay of the Tree and Stand-Level Processes Mediate Drought-Induced Forest Dieback: Evidence from Complementary Remote Sensing and Tree-Ring Approaches. Ecosystems 2022, 25, 1738–1753. [Google Scholar] [CrossRef]
Figure 1.
Distribution of the sampled sites and tree species in Mexico.

Figure 2.
Relationships (Pearson correlations) calculated between monthly climate variables (Tmax, mean maximum temperature; Tmin, mean minimum temperature; PP, precipitation) and C accumulation rates in the 15 study tree species. Correlations were calculated from prior September to current September with months of the current year abbreviated using capital letters. The dashed horizontal lines show the 0.05 significance levels.

Table 1.
Descriptive statistics of the sampled species. Values are means ± SE.
| Species (Code) | nc | Time Span | Tree-Ring Width (mm) | AR1 | MS | EPS |
|---|---|---|---|---|---|---|
| Pinus caribaea var. hondurendis (Sénécl.) W.H. Barrett and Golfari (Pincar) | 27 | 1982–2020 | 0.57 ± 0.05 | 0.31 ± 0.03 | 0.43 ± 0.01 | 0.88 |
| Pinus oocarpa Schiede ex Schltdl. (Pinooc) | 26 | 1986–2020 | 3.16 ± 0.20 | 0.47 ± 0.04 | 0.40 ± 0.01 | 0.89 |
| Taxodium mucronatum Ten. (Taxmuc) | 30 | 1987–2020 | 7.67 ± 0.25 | 0.63 ± 0.01 | 0.30 ± 0.01 | 0.98 |
| Pinus jeffreyi Grev. and Balf. (Pinjef) | 27 | 1975–2019 | 2.73 ± 0.16 | 0.51 ± 0.02 | 0.49 ± 0.01 | 0.95 |
| Pinus cembroides subsp. lagunae (Rob. Pass.) D.K. Bailey (Pincem) | 29 | 1970–2019 | 1.28 ± 0.07 | 0.36 ± 0.03 | 0.43 ± 0.01 | 0.86 |
| Pinus engelmannii Carr. (Pineng) | 30 | 1951–2019 | 2.13 ± 0.08 | 0.39 ± 0.03 | 0.45 ± 0.01 | 0.97 |
| Picea martinezii T.F. Patterson (Picmar) | 28 | 1862–2020 | 1.53 ± 0.10 | 0.70 ± 0.02 | 0.36 ± 0.01 | 0.92 |
| Pinus maximartinezii Rzedowski (Pinmax)) | 29 | 1976–2020 | 2.41 ± 0.14 | 0.34 ± 0.04 | 0.48 ± 0.02 | 0.93 |
| Pinus montezumae Lamb. (Pinmon) | 29 | 1985–2019 | 2.01 ± 0.11 | 0.63 ± 0.04 | 0.42 ± 0.01 | 0.95 |
| Pinus lumholtzii B.L. Rob and Fernald (Pinlum) | 23 | 1917–2020 | 1.03 ± 0.09 | 0.55 ± 0.04 | 0.39 ± 0.01 | 0.93 |
| Pinus patula Schltdl. et Cham. (Pinpat) | 30 | 1952–2020 | 2.46 ± 0.09 | 0.68 ± 0.02 | 0.36 ± 0.01 | 0.96 |
| Abies hickelii Flous and Gaussen. (Abihic) | 29 | 1956–2020 | 2.84 ± 0.14 | 0.66 ± 0.04 | 0.34 ± 0.01 | 0.94 |
| Juniperus deppeana Steud. (Jundep) | 27 | 1986–2020 | 2.16 ± 0.19 | 0.39 ± 0.04 | 0.59 ± 0.02 | 0.95 |
| Abies religiosa Kunth Schltdl. et Cham. (Abirel) | 23 | 1960–2019 | 1.63 ± 0.13 | 0.35 ± 0.04 | 0.46 ± 0.01 | 0.94 |
| Pinus hartwegii Lindl. (Pinhar) | 20 | 1975–2019 | 1.64 ± 0.11 | 0.53 ± 0.04 | 0.35 ± 0.02 | 0.86 |
Abbreviations: nc, number of cores; AR1, first-order autocorrelation; MS, mean sensitivity; EPS, expressed population signal for the common timespan (1987–2019).
Table 2.
PCA loadings in the first (PC1), second (PC2) and third (PC3) principal components summarizing the relationships between climatic variables and C accumulation rates in the 15 study tree species. See species’ codes in Table 1.
Table 2.
PCA loadings in the first (PC1), second (PC2) and third (PC3) principal components summarizing the relationships between climatic variables and C accumulation rates in the 15 study tree species. See species’ codes in Table 1.
| Species | PC1 | PC2 | PC3 |
|---|---|---|---|
| Pincar | −0.022 | 0.370 | −0.053 |
| Pinooc | 0.022 | −0.104 | −0.104 |
| Taxmuc | −0.010 | 0.788 | −0.192 |
| Pinjef | −0.124 | 0.083 | 0.552 |
| Pincem | 0.234 | 0.066 | −0.431 |
| Pineng | 0.347 | 0.073 | −0.087 |
| Picmar | 0.340 | 0.140 | −0.149 |
| Pinmax | 0.401 | −0.089 | −0.108 |
| Pinmon | 0.604 | −0.163 | 0.237 |
| Pinlum | 0.116 | −0.028 | 0.053 |
| Pinpat | 0.222 | −0.017 | 0.052 |
| Abihic | 0.095 | 0.296 | 0.337 |
| Jundep | 0.217 | 0.189 | 0.488 |
| Abirel | 0.199 | −0.027 | −0.053 |
| Pinhar | −0.093 | −0.188 | −0.046 |
Disclaimer/Publisher’s Note: The statements, opinions and data contained in all publications are solely those of the individual author(s) and contributor(s) and not of MDPI and/or the editor(s). MDPI and/or the editor(s) disclaim responsibility for any injury to people or property resulting from any ideas, methods, instructions or products referred to in the content. |
© 2023 by the authors. Licensee MDPI, Basel, Switzerland. This article is an open access article distributed under the terms and conditions of the Creative Commons Attribution (CC BY) license (https://creativecommons.org/licenses/by/4.0/).
Share and Cite
MDPI and ACS Style
Pompa-García, M.; Vivar-Vivar, E.D.; Rubio-Camacho, E.A.; Camarero, J.J. Rates of Stemwood Carbon Accumulation Are Linked to Hydroclimate Variability in Mexican Conifers. Forests 2023, 14, 1381. https://doi.org/10.3390/f14071381
AMA Style
Pompa-García M, Vivar-Vivar ED, Rubio-Camacho EA, Camarero JJ. Rates of Stemwood Carbon Accumulation Are Linked to Hydroclimate Variability in Mexican Conifers. Forests. 2023; 14(7):1381. https://doi.org/10.3390/f14071381
Chicago/Turabian StylePompa-García, Marín, Eduardo D. Vivar-Vivar, Ernesto A. Rubio-Camacho, and Jesús Julio Camarero. 2023. "Rates of Stemwood Carbon Accumulation Are Linked to Hydroclimate Variability in Mexican Conifers" Forests 14, no. 7: 1381. https://doi.org/10.3390/f14071381
Note that from the first issue of 2016, this journal uses article numbers instead of page numbers. See further details here.