
Effects of Tree Competition on Biomass Allocation of Stump and Coarse Roots of Larix olgensis of Different Site Classes

1
School of Forestry, Northeast Forestry University, Harbin 150040, China
2
Key Laboratory of Sustainable Forest Ecosystem Management Ministry of Education, Northeast Forestry University, Harbin 150040, China
*
Author to whom correspondence should be addressed.
Forests 2023, 14(7), 1431; https://doi.org/10.3390/f14071431
Submission received: 22 May 2023
/
Revised: 7 July 2023
/
Accepted: 10 July 2023
/
Published: 12 July 2023
(This article belongs to the Section Forest Ecology and Management)
Abstract
:Site class is a quantitative indicator used to evaluate site quality. It reflects site conditions, mainly climate, the suitability of soil for tree species and soil fertility. Despite the economic and ecological importance of tree competition and site class in sustainable forest management, there has been little research on its impact on the stump and coarse root biomass allocation within plantations. The stump and coarse roots were divided into five components ((stump disc (SD), stump knot (SK), coarse roots (>10 cm in diameter) (CR1), medium coarse roots (5–10 cm) (CR2) and fine coarse roots (2–5 cm) (CR3)), and the biomass of each component was obtained via the weighing method. It was found that the biomass of SD, CR1, CR2 and CR3 was mainly affected by competition (p ≤ 0.01). In the three site classes, the biomass of CR3 increased significantly with the increase in the competition index (CI) (p < 0.01); the biomass of CR1 decreased gradually. In site V, the biomass of SK, sapwood and heartwood increased significantly with the increase in CI. The results show that competition affects the allocation of stump and coarse root biomass mainly by changing the coarse root biomass. The development of stump knots is greatly influenced by site class. This study provides a reference for solving the competition mechanism underlying larch wood forest development, which will in turn promote more effective utilization of larch wood forests. This study also provides a scientific basis for accurately estimating the belowground biomass and carbon storage of artificial plantation forests.
1. Introduction
Coarse woody debris (CWD), such as logs, branches, stumps and coarse roots, maintains biodiversity, contributes to soil formation, provides an energy source for saprophyte communities and is a long-term carbon (C) as well as nutrient pool in forest ecosystems [1,2]. However, in traditionally managed boreal forests, CWD consists almost entirely of stump and coarse root material because other forms of CWD are removed during thinning and clearcutting [3]. The stumps and coarse roots are the parts of trees left after thinning or clearing according to technical regulations regarding the quality inspection of forests [4]. The stump and coarse roots include the aboveground part of the stump disc and underground part of the stump knot and lateral thick root [5], and these components account for 20%–28% of the total forest biomass [6] and are an important part of water absorption and mineral nutrient transport in trees. In addition, stumps and coarse roots play an important role in improving soil structure and maintaining forest nutrient cycling, serving as a long-term carbon and nutrient pool and an important part of the carbon balance in forest ecosystems [7,8].
Biomass is the main form of plant tissues and organs that obtain energy from the ecosystem and reflects the accumulation of plant matter and its ability to use environmental resources [9]. Recent studies on forest carbon sinks, which are a key link in atmospheric and soil carbon pool cycles [10], have found that part of the source of carbon sinks is due to increases in plant biomass [11]. Regarding the increase or decrease in total forest biomass carbon, measurement and estimation methods are problematic, especially since they ignore the differences in the carbon storage of different organs, which thus affect the rate and potential of forest carbon sinks [12]. Therefore, the distribution pattern of different organs is particularly important. Since the establishment of the Three-North Shelterbelt in 1978, the main goal of afforestation has changed from environmental restoration, windbreak and sand fixation to the general increase in forest carbon storage. In addition, the basic work of exploring global climate change and carbon balance is achieved by studying forest biomass allocation [13]. As the core research content of forest sustainable development and management, forest biomass research can promote the rational and sustainable use of biological resources [14]. Continuous measurement and collection of biomass indicators can better evaluate forest structure and forest productivity [15]. This is important in terms of understanding the impact of competition on the allocation of biomass, which has a significant impact on plant productivity [16].
There have been many studies of tree biomass, but most have focused on the aboveground portion. At present, the root system of forest trees at home and abroad mainly revolves around five directions: first, roots and root secretion; second, root growth and development, water physiology and root exudate; third, root configuration mechanics and soil consolidation; fourth, the spatial distribution of root morphological characteristics, the decomposition and turnover of fine roots and the relationship between environmental factors and root growth and development; fifth, studies on root architecture [17]. However, most of the above research subjects are fine roots of shrubs and trees. For research on larch biomass, the standard analytic wood method is used to establish a model to estimate the root biomass roughly at present, but in most cases, only an aboveground biomass model is established [18]. Because measuring underground biomass is difficult and time-consuming and requires a large amount of investment, research on root biomass is usually neglected [19,20]. Research on larch stumps and coarse roots has been conducted, but the focus has been on the dynamic process of stump and coarse root decomposition in natural forests [21]. Studies on the distribution pattern of tree root biomass mainly focus on different tree species [22], different growth periods [23,24], plant density [25], elevation gradient [26] and soil nutrients [27] in which fine roots are dominant, and there are few studies on the effects of tree competition.
Larix (Larix spp.) is a native tree species with a long planting history in northern China and is one of the three major coniferous timber trees in Northeast China. It is not only the main afforestation tree for fast-growing and high-yield timber forests, but also the first-choice tree for farmland shelterbelts in northern China [28,29]. It is a deciduous tree belonging to the larch of the Pinaceae family. The advantages of this tree species are its strong adaptability, cold resistance, easy renewal, fast growth rate and high economic value [30]. During forest management, after the larch has been cleared, the number of stumps and coarse roots under the artificial forest is greater. At present, tended thinning is determined according to stand productivity, and the competition index is relatively simple. In the process of implementation, due to the different differentiation degrees of trees, the cutting objects are determined based on different priorities, so in stands with the same initial planting density, tree competition should be different. The site class is an indicator of site conditions or the stand productivity of tree species and it is divided into I–V grades, ranging from high to low, which can be found in the site class table according to the average tree height and age of the stand [4]. Site class is widely used in forest resource surveys, forest harvest model establishment, management type organization and other forest management work.
Therefore, we hypothesize that (1) tree competition affected the allocation of stump and coarse root biomass, and (2) the biomass of each component of the stump and coarse roots was affected differently by competition at different site classes.
2. Materials and Methods
2.1. Study Sites and Sampling
Mengjiagang Forest Farm is located in Huannan County, in the northeast of the county, under the Heilongjiang Provincial Forestry Department. The forest farm was established in February 1956; the site is in the east of Mengjiagang town and is mainly an operated larch tree plantation base. The forest farm is located in the remnant of the west foot of Wanda Mountain. The terrain is high in the northeast and low in the southwest, with the altitude ranging from 168 to 575 m and the average altitude being 250 m. It mainly consists of low hills with gentle slopes, most of which range from 10° to 20°. It has an East Asian continental monsoon climate; winter is long, cold and dry; summers are short, warm and wet; early spring has less rain and wind and is prone to drought; the temperature drops rapidly in autumn, and frost damage often occurs. The average annual temperature is 2.7 °C, and the average annual precipitation is 550 mm. The forest farm soil is mainly dark brown soil, among which typical dark brown soil is the most widely distributed. In addition to dark brown soil, there are also small amounts of white slurry soil, meadow soil, swamp soil and peat soil. The vegetation of the forest farm is mainly secondary deciduous broad-leaved mixed forest and artificial coniferous forest with Mongolian oak (Quercus mongolica Fisch. ex Ledeb.), black birch (Rhamnus maximovicziana J. Vass.), aspen (Populus davidiana Dode) and white birch (Betula platyphylla Suk.) [29]. The average height of trees in the sample stands was investigated.
According to the professional standard of the People’s Republic of China (LY/T 1385-99) for fast-growing and high-yield plantations of Olga Bay Larch (Larix olgensis) and Dahurian Larch (Larix gmelini) [31], after screening the Larix olgensis plantations with detailed historical data in the forest farm, three plantations with similar stand structures and stand ages were selected, and their site classes were II, IV and V, respectively (Figure 1). The intermediate thinning dates of site class Ⅱ were 1996 and 2006; intermediate thinnings at site class Ⅳ were carried out in 1993 and 2003; and the intermediate thinnings at site class Ⅴ were 1978 and 1988. The intermediate intensity was 20% stocking. Dead and dying wood, suppressed trees, target tree species with poor trunk shapes and upper trees that inhibit the growth of target tree species were selected as the main thinning objects. Detailed information about site class, average tree height, initial planting density, average diameter at breast height, slope, soil type, pH and organic matter information can be found in Table 1 and Table 2.
The survey and sampling were conducted in June 2018. At least 30 stumps and coarse roots were obtained from each stand in the three site classes. Trees for biomass sampling were selected from across the full diameter range at each of the three sites [32]. Trees were divided into five diameter classes (using 6 cm bins), and a minimum of five trees were selected from each class at each site (Table 3). The stumps and coarse roots were removed via manual excavation, the soil was cleaned off, and then the stump and coarse roots were cut. The division of each component of the stump and coarse root is shown in Figure 2 (stump disc (SD), stump knot (SK), coarse root (CR1: >10 cm in diameter; CR2: 5–10 cm in diameter; CR3: 2–5 cm in diameter)).
The improved iterative Hegyi competition index was used to calculate the competition status between the object tree and the competing tree [33,34]. This competition index determines the competition range of the object tree based on the stand density within the object tree competition area. Circles centered on the stump and coarse roots and with a radius of 8 m formed a competition area. The diameter at breast height (DBH) of the competing tree and the relative position and distance between the competing tree and the stump and coarse roots were measured and recorded. Effective and ineffective competing trees were distinguished based on their relative position in the sample circle. The effective competition tree must have a certain DBH size to affect the growth of the object tree. Secondly, an effective competition tree is directly oriented to the object tree, and an ineffective competition tree is blocked by an effective competition tree [33]. The radius of the object tree subject to competition is determined by using the following equation:
where C represents the radius, N is the stand density in the competition area and k is equal to a constant 2. The iterative Hegyi competition index is calculated by
where CI represents the competition index; n is the number of effectively competing trees in the competition range; and are the DBHs of the object tree and the competing tree, respectively; and represents the distance between the object tree i and the competing tree j. The larger the CI value is, the more intense the competition.
2.2. Biomass Measurements
The stump disc diameter (10 cm above the root collar) of each stump and coarse root was measured and recorded [4]. For SD and SK components, discs with a thickness of 5 cm were cut as samples, and the discs were weighed and photographed. Sapwood and heartwood were divided according to area proportion in the photos taken in CAD. SDs and SKs were divided into SD sapwood (SD–S), SD heartwood (SD–H), SK sapwood (SK–S) and SK heartwood (SK–H) according to sapwood and heartwood.
Eighty-gram subsamples were taken from each component of the stump and coarse root. After the fresh weight was measured, each subsample was dried at a constant temperature of 85 °C, weighed again and recorded. The measured moisture content was used to calculate the dry biomass of the stump and coarse roots [35].
2.3. Data Analysis
All statistical analyses were performed in SPSS 21.0 (IBM, Chicago, IL, USA). pH was determined via the potentiometric method, where the ratio of water to soil was 2.5:1. The concentrations of organic matter were determined using an elemental combustion analyzer (The Elemental Combustion System 4024, Italy) [36]. Stump and coarse root biomass, site class and competition were tested with a one-way ANOVA, and the LSD method was used to test the difference significance (p = 0.05). Divisions of sapwood and heartwood were measured using CAD (AutoCAD 2008, Autodesk, America).
3. Results
3.1. Distribution of Stump and Coarse Root Biomass under Different Site Classes
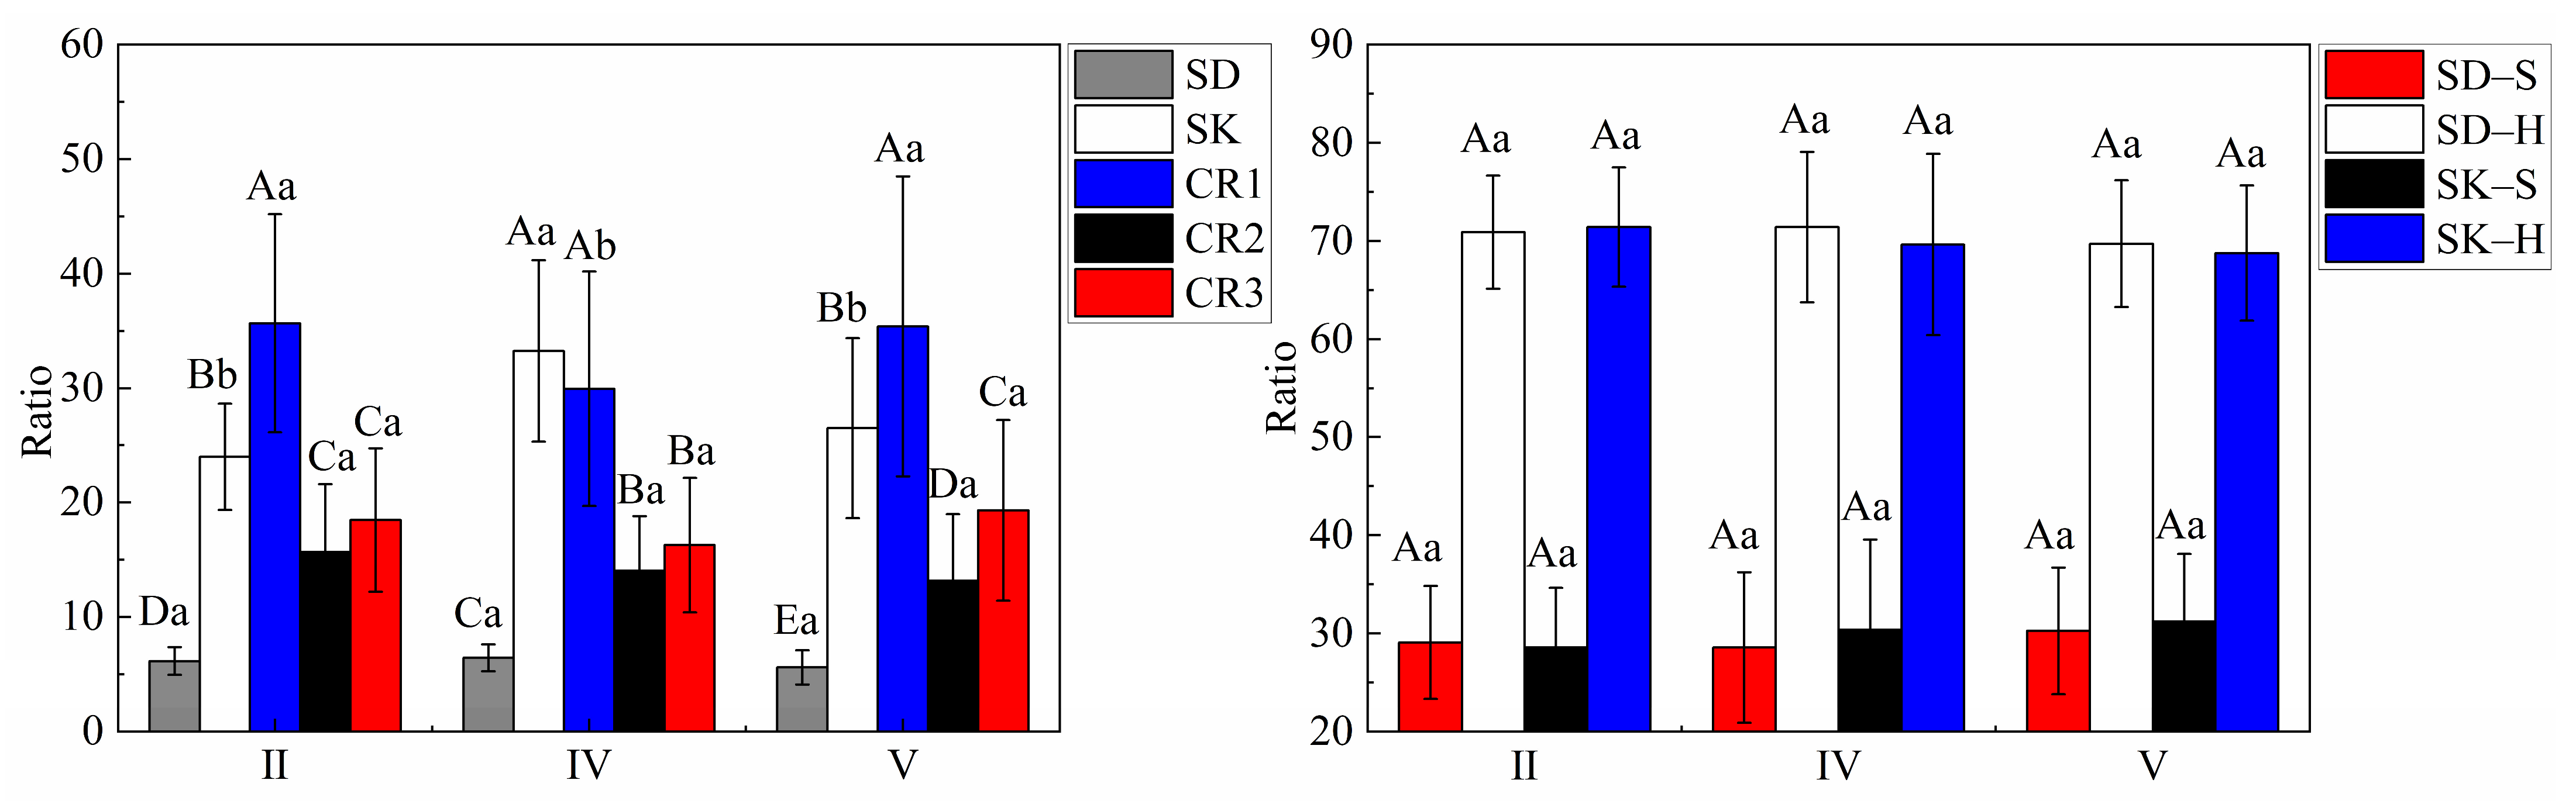
There was a significant difference in the SK and CR1 biomass amounts among the different site classes (Figure 3). The SK biomass amount in site class IV was significantly greater than that in site classes II and V, with the biomass amount in site class II being the lowest; however, there was no significant difference from that in site class V. The CR1 biomass amount in site class IV was the least, accounting for 29.95% of the total biomass, which was significantly less than that in site classes II and V.
In the early stage of stump and coarse root formation, the SK and CR1 biomass amounts were the greatest among all site classes, and there was a significant difference between them (Figure 3), with CR2 and CR3 having the next greatest biomass amounts. In addition, the SD biomass amount was the smallest and was significantly less than the other components. In site class Ⅱ, the relative percentage of the CR1 biomass amount was 35.67%, which was significantly greater than that of the other components, followed by SK biomass at a relative percentage of 24.01%, which was significantly different from that of the other components. In comparison to in the other site classes, in site class IV, the SK and CR1 biomass amounts were greater, and the relative percentages of their biomass were 33.25% and 29.95%, respectively. The next largest amount of biomass was for CR2 and CR3. In site class V, the CR1 biomass amount was significantly greater than that of other components, and the relative percentage of biomass was 35.39%, followed by that of SK (26.51%) and CR3 (19.32%), and there was a significant difference between them.
There was no significant difference in the change in sapwood and heartwood in the total biomass of the stump discs and stump knots within the site classes (Figure 3), and there was no significant difference in the stump disc and stump knot sapwood biomass amounts and the stump disc and stump knot heartwood biomass amounts within the same site class. The biomass of the stump disc and stump knot sapwood accounted for 28.58–31.23% of the total biomass amount, and the percentage of the total stump disc and stump knot heartwood biomass ranged from 68.77% to 71.42%.
3.2. Changes in Biomass Allocation with Competition Index
The variation trends of the stump and coarse root biomass were different in different site classes (Figure 4 and Figure 5). In the different site classes, the biomass of SD–H and CR3 had a strong promoting relationship with the CI (p < 0.01). In site classes Ⅱ and Ⅴ, SD and SD–S increased significantly with the increase in the competition index (p < 0.01) and were not significant in site class Ⅳ. In site class Ⅴ, SK, SK–S and SK–H increased significantly with the increase in the competition index (p < 0.05) and had no significant effect in the Ⅱ and Ⅳ site classes. In site class Ⅱ, CR1 significantly decreased with an increasing competition index (p < 0.01); in site class Ⅴ, the competition index decreased significantly with an increasing competition index (p < 0.05) but was not significant in site class Ⅳ. In site classes Ⅱ and Ⅳ, CR2 significantly increased with the increase in the competition index (p < 0.01) and had no significant effect in site class Ⅴ.
It can be seen from the figure that the total biomass gradually decreased with the increase in the competition index (Figure 5). Nonlinear (exponential function) fitting was carried out between the total stump and coarse root biomass and the competition index, and the R2 values of the three site classes (Ⅱ, Ⅳ and Ⅴ) were 0.874, 0.615 and 0.642, respectively.
The average DBHs of the competitive trees of site classes Ⅱ and Ⅴ were relatively close, at 26.40 and 25.25 cm (Table 4), respectively. The average DBH of the competitive trees of site class Ⅳ was smaller than 21.87 cm. The DBH distribution ranges of site classes Ⅱ, Ⅳ, and Ⅴ were 15.26–44.10 cm, 9.10–40.07 cm and 5.72–41.40 cm, respectively. The coefficients of variation of the DBHs of site classes Ⅱ and Ⅳ were 4.85 and 4.21, respectively, while that of site class V was relatively small, with a coefficient of variation of 2.95.
The average relative distances between the competitive trees of site classes II and Ⅴ and object trees were 4.45 and 4.36 m, respectively, and the average relative distance between site class Ⅳ competitive trees and object trees was 3.31 m, which was smaller than that of the trees of site classes II and Ⅴ. The relative distance between the competitive trees and object trees was 0.60–7.24 for site class V and close to that for site classes II and Ⅳ, which were 0.63–6.31 and 0.55–5.39, respectively. The coefficient of variation of the relative distance between the competitive trees of site classes II and Ⅴ and the object tree was 2.51 and 2.50, respectively; however, that of site class Ⅳ was smaller, and the coefficient of variation was 2.30. The average CI of site class IV was 2.10, which was higher than those of site classes Ⅱ and Ⅴ, and the average CIs of site classes II and Ⅴ were 1.36 and 1.57, respectively. The coefficient of variation of the CI of site class IV was 2.08, and those of site classes II and V were 1.85 and 1.61, respectively.
3.3. Statistical Results of Multivariate Analysis of Variance
Site class, competition and their interaction had significant effects on the biomass of the stump and coarse root components (Table 5). SD, SD–H, SK, SK–S, SK–H and CR1 were significantly affected by site class, especially SK, SK–S and SK–H (p < 0.01). Competition had significant effects on SD, SD–S, SD–H and lateral coarse roots (p ≤ 0.01) but had no significant effects on SK, SK–S and SK–H. CR2, SD–S and SK–S were significantly affected by the interaction between site class and competition, while the other components had no significant effect.
4. Discussion
As anticipated by our hypothesis, competition significantly affected belowground biomass allocation and had the greatest impact on the coarse root component. Plant hybrids with the same root structure will lead to intense competition; among these plants, the competition between shallow roots is the most intense, followed by that between two deep-rooted plants [37,38]. Larch is a shallow-rooted tree species, and the underground competition it generates will affect the biomass of each component of the stump and coarse root system; indeed, this effect was particularly pronounced in the coarse root fraction, which was consistent with the study by Yan Hui et al. and was found to be related to the large proportion of coarse root biomass [39]. Competition had a significant effect on the SD and its sapwood–heartwood biomass ratio, since the stump disc (SD) is exposed to the soil surface and is susceptible to aboveground competition [5], resulting in irregular morphological changes in trees and thus spatial variation in sapwood and heartwood [40,41]. If such variation exists for a long time in a stand, then trees will differentiate, and thus the growth efficiency of sapwood and heartwood will become limited [42].
Competition has an important impact on the aboveground and underground biomass allocation of plants and thus affects the individual growth, morphological structure and survival status of plants [43]. Wang Jinsong (Wang Jinsong et al., 2012) found that with the increase in the competition index, the proportion of branch and leaf biomass increased, and the proportion of coarse roots in the whole plant biomass tended to decrease, but the change range was small, and the whole root–shoot ratio was not affected by shoot competition. This indicates that the increase in the proportion of shoot and leaf biomass may be mainly at the expense of the decrease in trunk biomass [44]. On the basis of this study, we further determined that competition would reduce the proportion of coarse root biomass larger than 10 cm in diameter; this is related to the large proportion of coarse root biomass with a diameter greater than 10 cm [39]. However, these differences may be due to the different ecological characteristics of the provenances and the different study environments [45].
According to the theory of optimal allocation, plants preferentially allocate biomass to organs that can obtain more restrictive resources to promote growth [46], so the biomass proportion of organs usually reflects the predictable response of plants to abiotic stresses [47]. It was found that 2–5 cm of coarse root biomass increased significantly with the increase in the competition index in different site classes. This is because plants can adjust the distribution of the root system to respond to neighboring plants [48,49]. When there is competition among roots, the number of fine roots, root tip number and root surface area will increase to occupy more soil space to obtain limited resources. This resource is especially reflected in the rapid absorption of some nutrients and water. [50]. When the site class was poor, the stump knot and the biomass ratio of sapwood to heartwood increased as the competition intensified. When the root system is in a poor environment, in order to obtain environmental resources more effectively, the nutrient flow to the root system and the distribution of photosynthetic products increase, and the root length, root thickness and root hair development undergo obvious morphological changes [51]. On the other hand, the stump knot is located in the center of the stump and coarse roots and has a regulatory effect on the nutrient flow of the whole stump and coarse root structure. Root regulation and distribution will make it plastic, which can be used to bypass blockage or move to more abundant nutrients, thus increasing root biomass [52].
Because the experiment was designed in a productive forest farm with a long stand period, the study only analyzed the current existing stand status without purposefully controlling competition at different growth stages, which is a deficiency of the study.
In forest management, the stand is the basic unit of investigation, and the study of the relationship between tree individuals is the basis for understanding forest ecosystem and community composition [53]. The competition law among trees can mean that management and care measures must be closely considered with the process of forest development and succession [54], so as to achieve the purpose of improving the function of the forest ecosystem and achieve sustainable management [55]. The effects of competition on the distribution of stump and coarse root fractions in different site classes were investigated. The results showed that competition adjusted the allocation mainly through its effects on SD, CR1 and CR3 biomass. Increasing the competition index promoted the biomass ratio of 2–5 cm roots and inhibited the diameter > 10 cm coarse root biomass ratio. In conclusion, this study could provide further insights into the effects of competition on biomass distribution in stumps and coarse roots, which could provide a reference for the management and care measures of Larix olgensis plantations and lay the foundation for more sophisticated prediction of belowground carbon storage and the sustainable management of plantations. In addition to the genetic characteristics of the trees, there are many environmental factors that affect the biomass allocation of stumps and coarse roots. The specific mechanism of stump and coarse root action on stump and coarse root biomass allocation is still unclear [26,56]. Therefore, in a follow-up study, research on climate factors and interactions between soil and stump and coarse root effects should be strengthened. In addition, a quantitative analysis of stump and coarse root chemical compositions and the change in the nutrient characteristics and their physiological ecology should be conducted. In addition, an in-depth analysis of the environmental factors affecting stump and coarse root interaction effects should be performed to explore the physical and chemical properties of climate factors and soil influences on the differences in the mechanisms behind stump and coarse root configurations and development.
5. Conclusions
In this study, tree competition affected biomass allocation mainly by regulating the SD, CR1, CR2 and CR3 of stumps and coarse roots. Competition increased the biomass ratio of fine roots (2–5 cm in diameter) and decreased the biomass ratio of coarse roots (>10 cm in diameter). Biomass ratios of stump knots and stump knot sapwood and heartwood increased in poor site environments. In conclusion, we suggest that when estimating belowground biomass, the competition effect and site class should be considered. Controlling the intensity of competition is conducive to accurately estimating carbon stock and informing the stand management of forest stocking in the face of disturbance stresses like climate change.
Author Contributions
Conceptualization, X.M., X.C. and X.W.; investigation, X.M., Y.Y. and H.G.; methodology, X.M., Y.Y. and X.C.; data curation and formal analysis, X.M. and X.W.; software and visualization, X.M.; writing—original draft, X.M. and X.W.; writing—review and editing, X.C. and H.G.; funding acquisition, X.C. All authors have read and agreed to the published version of the manuscript.
Funding
This work was supported by the National Natural Science Foundation of China (NSFC, grant number 31870612).
Data Availability Statement
The data are available on reasonable request.
Acknowledgments
We gratefully acknowledge the assistance of numerous staff members from Meng Jia Gang Forest Farm with the field investigation and sample processing.
Conflicts of Interest
The authors declare no conflict of interest.
References
- Harmon, M.E.; Franklin, J.F.; Swanson, F.J.; Sollins, P.; Gregory, S.V.; Lattin, J.D.; Anderson, N.H.; Cline, S.P.; Aumen, N.G.; Sedell, J.R.; et al. Ecology of coarse woody debris in temperate ecosystems. Adv. Ecol. Res. 1986, 15, 133–302. [Google Scholar]
- Janisch, J.E.; Harmon, M.E.; Chen, H.; Fasth, B.; Sexton, J. Decomposition of coarse woody debris originating by clearcutting of an old-growth conifer forest. Ecoscience 2005, 12, 151–160. [Google Scholar]
- Huang, Z.Q.; Liao, L.P.; Gao, H.; Yu, X. Decomposition process of Chinese fir stump roots and changes of nutrient concentration. Chin. J. Appl. Ecol. 2000, 1, 41–43. [Google Scholar] [CrossRef]
- LY/T 2101-2013; Technical Regulations on Quality Inspection of Cutting Area Operations Key State-Owned Forests of Inner Mongolia and Northeast China. the State Forestry Administration of the People’s Republic of China, Standards Press of China: Beijing, China, 2013.
- Hellsten, S.; Helmisaari, H.S.; Melin, Y.; Skovsgaard, J.P.; Kaakinen, S.; Kukkola, M.; Akselsson, C. Nutrient concentrations in stumps and coarse roots of Norway spruce, Scots pine and silver birch in Sweden, Finland and Denmark. For. Ecol. Manag. 2013, 290, 40–48. [Google Scholar] [CrossRef]
- Kimmins, P. Above- and below-ground biomass and production of lodgepole pine on sites with differing soil moisture regimes. Can. J. For. Res. 1989, 19, 447–454. [Google Scholar] [CrossRef]
- Olajuyigbe, S.O.; Tobin, B.; Gardiner, P.; Nieuwenhuis, M. Stocks and decay dynamics of above- and belowground coarse woody debris in managed sitka spruce forests in ireland. For. Ecol. Manag. 2011, 262, 1109–1118. [Google Scholar] [CrossRef]
- Harmon, M.E.; Sexton, J.G. Guidelines for Measurement S of Woody Detritus in Forest Ecosystems; Us Publication No. 20; Us Lter Network Office University of Washington: Seattle, WA, USA, 1996. [Google Scholar]
- Hovenden, M.J.; Newton, P.C.D.; Wills, K.E. Seasonal not annual rainfall determines grassland biomass response to carbon dioxide. Nature 2014, 511, 583–586. [Google Scholar] [CrossRef]
- Schimel, D.S. Terrestrial ecosystems and the carbon cycle. Glob. Change Biol. 1995, 1, 77–91. [Google Scholar] [CrossRef]
- Aguirre, A.; Río, M.D.; Ruiz-Peinado, R.; Condés, S. Stand-level biomass models for predicting c stock for the main spanish pine species. For. Ecosyst. 2021, 8, 29. [Google Scholar] [CrossRef]
- Yin, Q.; Tian, T.; Han, X.; Xu, J.; Chai, Y.; Mo, J. The relationships between biomass allocation and plant functional trait. Ecol. Indic. 2019, 102, 302–308. [Google Scholar] [CrossRef]
- Rizvi, R.H.; Dhyani, S.K.; Yadav, R.S.; Singh, R. Biomass production and carbon stock of poplar agroforestry systems in Yamunanagar and Saharanpur districts of northwestern India. Curr. Sci. 2011, 100, 736–742. [Google Scholar]
- De-Miguel, S.; Pukkala, T.; Assaf, N.; Shater, Z. Intra-specific differences in allometric equations for aboveground biomass of eastern Mediterranean Pinus brutia. Ann. For. Sci. 2014, 71, 101–112. [Google Scholar] [CrossRef] [Green Version]
- Chave, J.; Condit, R.; Lao, S.; Caspersen, J.P.; Foster, R.B.; Hubbell, S.P. Spatial and temporal variation of biomass in a tropical forest: Results from a large census plot in Panama. J. Ecol. 2003, 91, 240–252. [Google Scholar] [CrossRef]
- Agathokleous, E.; Belz, R.G.; Kitao, M.; Koike, T.; Calabrese, E.J. Does the root to shoot ratio show a hormetic response to stress? An ecological and environmental perspective. J. For. Res. 2019, 30, 1569–1580. [Google Scholar] [CrossRef] [Green Version]
- Jing, J.L. Research on the Root System Distribution and Architecture of Populus euphratica in the Extremely Arid Region Beijing. Master’s Thesis, Beijing Forestry University, Beijing, China, 2014. [Google Scholar]
- Cairns, M.A.; Brown, S.; Helmer, E.H.; Baumgardner, G.A. Root biomass allocation in the world’s upland forests. Oecologia 1997, 111, 1–11. [Google Scholar] [CrossRef]
- Wang, Z.Q.; Guo, D.L.; Wang, X.R.; Mei, L. Fine root architecture, morphology, and biomass of different branch orders of two chinese temperate tree species. Plant. Soil. 2006, 288, 155–171. [Google Scholar] [CrossRef]
- Li, F.F.; Pei, N.C.; Shi, Z.W.; Luo, S.; Tang, Y.; Liu, X.; Chen, Z.; Sun, B. Relationships between Soil Nutrients and Root Biomass, Morphological Traits and Nutrients for Secondary Forests and Plantations. Ecol. Environ. Sci. 2019, 28, 2349–2355. [Google Scholar] [CrossRef]
- Heal, O.W.; Cheng, B.R.; Xu, G.S. Stump decomposition of Larch and red pine in the Changbai Mountains. For. Eco. Res. 1983, 3, 225–234. [Google Scholar]
- Li, S.F.; Jia, C.X.; Yang, L.H.; Zhong, H.; Huang, X.; Lang, X.; Liu, W.; Su, J. Effect of Stand Age on Root Biomass in Pinus kesiya var. langbianensis Plantation. For. Res. 2018, 31, 26–33. [Google Scholar] [CrossRef]
- Sun, N.; Zhang, Y.C.; Zhao, M.F. Root Biomass and Vertical Distribution Characteristics of Larch Plantation. For. Eng. 2021, 37, 6. [Google Scholar] [CrossRef]
- Zhang, Y.J.; Wen, Z.W. Root Biomass of Pinus massoniana Plantations under Different Planting Densities. For. Res. 2011, 47, 75–81. [Google Scholar]
- Wang, G.; Ran, F.; Chang, R.; Yang, Y.; Luo, J.; Jianrong, F. Variations in the live biomass and carbon pools of abies georgei along an elevation gradient on the Tibetan Plateau, China. For. Ecol. Manag. 2014, 329, 255–263. [Google Scholar] [CrossRef]
- Cui, Q.F.; Feng, Z.P.; Yang, X.T. Distributions of fine and coarse tree roots in a semi-arid mountain region and their relationships with soil properties. Trees 2017, 31, 607–616. [Google Scholar] [CrossRef]
- Liao, Y.C.; Duan, H.L.; Shi, X.X.; Meng, Q.; Liu, W.; Shen, F.; Fan, H.; Zhu, T. The Relationship between the Stand Growth and Root Biomass of Cunninghamia lanceolate Plantations. Ecol. Environ. Sci. 2021, 30, 1121–1128. [Google Scholar] [CrossRef]
- National Forestry and Grassland Administration. Report on Forest Resources Inventory for Key State-Owned Forest in Inner Mongolia & Northeast China; China Forestry Publishing House: Beijing, China, 2020; ISBN 978-7-5219-0679-0. (In Chinese) [Google Scholar]
- Cui, J.Y.; Sun, Z.H.; Wang, Z.K.; Gong, L.F. Effects of the Application of Nutrients on Soil Bacterial Community Composition and Diversity in a Larix olgensis Plantation, Northeast China. Sustainability 2022, 14, 16759. [Google Scholar] [CrossRef]
- Liu, Q. Study on Photosynthetic Characteristics of Larix olgensis Henry Plantation; Northeast Forestry University: Harbin, China, 2015. [Google Scholar]
- LY/T 1385-99; The Professional Standard of the People’s Republic of China for Fast-Growing and High-Yield Plantation of Olga Bay Larch (Larix olgensis) and Dahurian Larch (Larix gmelini). The State Forestry Administration of the People’s Republic of China, Standards Press of China: Beijing, China, 1986.
- Trinh, H.; David, J.L.; Grahame, A.; Tom, L. Field methods for above and belowground biomass estimation in plantation forests. MethodsX 2021, 8, 101192. [Google Scholar] [CrossRef]
- Britton, T.G.; Richards, S.A.; Hovenden, M.J. Quantifying neighbour effects on tree growth: Are common ‘competition’ indices biased? J. Ecol. 2023, 111, 1270–1280. [Google Scholar] [CrossRef]
- Hegyi, F. A simulation model for managing jack-pine stands. In Growth Models for Tree and Stand Simulation; Fries, J., Ed.; Royal College of Forestry: Stockholm, Sweden, 1974; pp. 74–90. [Google Scholar]
- Wang, X.; Zhao, D.; Liu, G.; Yang, C.; Teskey, R.O. Additive tree biomass equations for Betula platyphylla Suk. plantations in northeast china. Ann. For. Sci. 2018, 75, 60. [Google Scholar] [CrossRef] [Green Version]
- Halonen, O.; Tulkki, H.; Derome, J. Nutrient analysis methods. Finn. For. Res. Inst. Res. 1983, 121, 28. Available online: http://urn.fi/URN:ISBN:951-40-0988-6 (accessed on 28 March 2023).
- Rubio, G.; Walk, T.; Ge, Z.; Yan, X.; Liao, H.; Lynch, J.P. Root gravitropism and below-ground competition among neighbouring plants: A modelling approach. Ann. Bot. 2001, 88, 929–940. [Google Scholar] [CrossRef] [Green Version]
- Wilson, J.B. Shoot competition and root competition. J. Appl. Ecol. 1988, 25, 279–296. [Google Scholar] [CrossRef]
- Yan, H.; Dong, X.; Feng, G.; Zhang, S.; Mucciardi, A. Coarse root spatial distribution determined using a ground-penetrating radar technique in a subtropical evergreen broad-leaved forest. Sci. China Life Sci. 2013, 43, 788–798. [Google Scholar] [CrossRef] [PubMed] [Green Version]
- Morais, M.C.; Pereira, H. Heartwood and sapwood variation in Eucalyptus globulus Labill. trees at the end of rotation for pulpwood production. Ann. Forest Sci. 2007, 64, 665–671. [Google Scholar] [CrossRef] [Green Version]
- Nawrot, M.; Pazdrowski, W.; Szymański, M. Dynamics of heartwood formation and axial and radial distribution of sapwood and heartwood in stems of european larch (Larix decidua Mill.). J. For. Sci. 2008, 54, 409–417. [Google Scholar] [CrossRef] [Green Version]
- Martinez-Vilalta, J.; Vanderklein, D.; Mencuccini, M. Tree height and age-related decline in growth in scots pine (Pinus sylvestris L.). Oecologia 2007, 150, 529–544. [Google Scholar] [CrossRef] [PubMed]
- Liu, F.; Li, K.; Liao, S.; Cui, Y. Interspecific Competition, Population Structure and Growth Dynamics of Endangered Calocedrus macrolepis. For. Res. 2010, 46, 23–26. [Google Scholar]
- Wang, J.; Fan, X.; Fan, J.; Zhang, C.; Xia, F. Effect of aboveground competition on biomass partitioning of understory Korean pine (Pinus koraiensis). Acta Ecol. Sin. 2012, 32, 2447–2457. [Google Scholar] [CrossRef]
- Wang, X.W.; Weng, Y.H.; Liu, G.F.; Krasowski, M.J.; Yang, C.P. Variations in carbon concentration, sequestration and partitioning among Betula platyphylla provenances. For. Ecol. Manag. 2015, 358, 344–352. [Google Scholar] [CrossRef]
- Bloom, A.J.; Chapin, F.S.; Mooney, H.A. Resource limitation in plants-an economic analogy. Annu. Rev. Ecol. Syst. 1985, 16, 363–392. [Google Scholar] [CrossRef]
- Poorter, H.; Niklas, K.J.; Reich, P.B.; Oleksyn, J.; Poot, P.; Mommer, L. Biomass allocateion to leaves, stems and roots: Meta-analyses of interspecific variation and environmental control. New Phytol. 2012, 193, 30–50. [Google Scholar]
- Wilson, S.D.; Tilman, D. Plant competition and resource availability in response to disturbance and fertilization. Ecology 1993, 74, 599–611. [Google Scholar] [CrossRef]
- Callaway, R.M. The detection of neighbors by plants. Trends. Ecol. Evol. 2002, 17, 104–106. [Google Scholar] [CrossRef]
- Arndal, M.F.; Merrild, M.P.; Michelsen, A.; Schmidt, I.K.; Mikkelsen, T.N.; Beier, C. Net root growth and nutrient acquisition in response to predicted climate change in two contrasting heathland species. Plant Soil. 2013, 369, 615–629. [Google Scholar] [CrossRef]
- De Boeck, H.J.; Lemmens, C.M.; Vicca, S.; Van den Berge, J.; Van Dongen, S.; Janssens, I.A.; Nijs, I. How do climate warming and species richness affect CO2 fluxes in experimental grasslands? New Phytol. 2007, 175, 512–522. [Google Scholar] [CrossRef]
- Shahzad, Z.; Amtmann, A. Food for thought: How nutrients regulate root system architecture. Curr. Opin. Plant Biol. 2017, 39, 80–87. [Google Scholar] [CrossRef]
- Zhang, S.Y.; Zheng, S.Q. Quantitive study on intraspecific and interspecific competition for dominant population of evergreen broad-leaved forest in Bijia mountain. Sci. Silvae Sin. 2001, 37, 185–188. [Google Scholar]
- Lv, F.Z. Study on the Forest Competition and Classification of Quercus mongolica Based on CSI. Master’s Thesis, Central South University of Forestry Technology, Changsha, China, 2016. Available online: https://kns.cnki.net/KCMS/detail/detail.aspx?dbname=CMFD201701&filename=1016296763.nh (accessed on 4 March 2023).
- Jin, Z.X.; Zhang, W.B. The quantitative relation of intraspecific and interspecific competition in endangered plant Heptacodium miconioides. Bull. Bot. Res. 2004, 24, 53–58. Available online: https://kns.cnki.net/kcms2/article/abstract?v=3uoqIhG8C44YLTlOAiTRKgchrJ08w1e7eeyE9jLkqq8eq2Cy3zSAdPaAvwSqCmHOJ6hdpJIu_zWY9px-KmxMjAhJ6xk5kGJe&uniplatform=NZKPT&src=copy (accessed on 4 March 2023).
- Dumroese, R.K.; Terzaghi, M.; Chiatante, D.; Scippa, G.S.; Lasserre, B.; Montagnoli, A. Functional Traits of Pinus ponderosa Coarse Roots in Response to Slope Conditions. Front. Plant. Sci. 2019, 10, 947. [Google Scholar] [CrossRef] [Green Version]
Figure 1.
The Larix olgensis stump and coarse root sampling site distribution.

Figure 2.
Division diagram of each component of the stump and coarse root.

Figure 3.
Percentage of each component in terms of total biomass. Note: Capital letters indicate significant differences among different components in the same site class. Lowercase letters indicate significant differences among different site classes with the same component. p < 0.05.
Figure 3.
Percentage of each component in terms of total biomass. Note: Capital letters indicate significant differences among different components in the same site class. Lowercase letters indicate significant differences among different site classes with the same component. p < 0.05.

Figure 4.
Relationship between SD, SK, CR1, CR2 and CR3 biomass and competition index.

Figure 5.
Relationship between SD–S, SD–H, SK–S, SK–H and total biomass and competition index.


Table 1.
Planting time, initial planting density, stand density, canopy density, average tree height, average diameter at breast height and intermediate thinning times in the Larix olgensis plantation prior to sampling.
Table 1.
Planting time, initial planting density, stand density, canopy density, average tree height, average diameter at breast height and intermediate thinning times in the Larix olgensis plantation prior to sampling.
| Site Class | Planting Time | Initial Planting Density (Trees·ha−1) | Canopy Density | Tree Numbers of Sample | Average Tree Height (m) | Average Diameter at Breast Height (cm) | Intermediate Thinning Times | Stand Density (Trees·ha−1) |
|---|---|---|---|---|---|---|---|---|
| Ⅱ | 1976 | 3330 | 0.7 | 33 | 25.70 | 23.10 | 2 | 676 |
| Ⅳ | 1973 | 3330 | 0.8 | 31 | 24.30 | 24.60 | 2 | 661 |
| Ⅴ | 1958 | 3330 | 0.7 | 30 | 23.27 | 31.90 | 2 | 548 |
Table 2.
Soil type, altitude, slope, slope position, exposure, pH and organic matter in the Larix olgensis plantation prior to sampling.
Table 2.
Soil type, altitude, slope, slope position, exposure, pH and organic matter in the Larix olgensis plantation prior to sampling.
| Site Class | Slope (°) | Exposure | Slope Position | Soil Type | pH (1:2.5 H2O) | Altitude (m) | Soil Organic Matter (g·kg−1) |
|---|---|---|---|---|---|---|---|
| Ⅱ | 8 | southwest | mid-slope | dark brown soil | 5.41 | 230 | 65.08 |
| Ⅳ | 13 | east | mid-slope | dark brown soil | 5.32 | 260 | 57.21 |
| Ⅴ | 10 | west | mid-slope | albic soil | 5.51 | 240 | 72.03 |
Table 3.
Sampled information of Larix olgensis.: average diameter at stump disc; : maximum stump disc diameter; : minimum stump disc diameter.
Table 3.
Sampled information of Larix olgensis.: average diameter at stump disc; : maximum stump disc diameter; : minimum stump disc diameter.
| Site Class | Sampled Trees | |||
|---|---|---|---|---|
| Ⅱ | 33 | 34.42 | 58.7 | 18.1 |
| Ⅳ | 31 | 27.97 | 47.1 | 12.3 |
| Ⅴ | 30 | 31.38 | 53.2 | 12.0 |
Table 4.
Details of competitive wood.
| Site Class | Ⅱ | Ⅳ | Ⅴ | |||||||||
|---|---|---|---|---|---|---|---|---|---|---|---|---|
| Max | Min | CV | Max | Min | CV | Max | Min | CV | ||||
| D (cm) | 26.40 | 44.10 | 15.26 | 4.85 | 21.87 | 40.07 | 9.10 | 4.21 | 25.25 | 41.40 | 5.72 | 2.95 |
| Dw (m) | 4.45 | 6.31 | 0.63 | 2.51 | 3.31 | 5.39 | 0.55 | 2.30 | 4.36 | 7.24 | 0.60 | 2.50 |
| CI | 1.36 | 3.47 | 0.28 | 1.85 | 2.10 | 5.65 | 0.66 | 2.08 | 1.57 | 4.08 | 0.13 | 1.61 |
Note: D: competitive wood for DBH. Dw: relative distance between competitive wood and object wood. CI: competition index. : average. Max: maximum value. Min: minimum value. CV: coefficient of variation.
Table 5.
The site class and competitive index mean square error, as well as the significance levels from the analysis of variance on the component biomass.
Table 5.
The site class and competitive index mean square error, as well as the significance levels from the analysis of variance on the component biomass.
| Compartments | MSE | Significance | |||
|---|---|---|---|---|---|
| Site Class | Competitive Index | Site Class | Competitive | Site * Competitive | |
| SD | 10.845 | 89.751 | * | *** | ns |
| SK | 811.8 | 51.5 | *** | ns | ns |
| CR1 | 459.6 | 3088.1 | * | *** | ns |
| CR2 | 28.1 | 288.59 | ns | ** | * |
| CR3 | 57.4 | 1316.8 | ns | *** | ns |
| SD–S | 0.669 | 8.598 | ns | *** | ** |
| SD–H | 6.17 | 42.79 | ** | *** | ns |
| SK–S | 113.81 | 22.51 | *** | ns | * |
| SK–H | 321.6 | 5.9 | *** | ns | ns |
Note: ns, not significant at p = 0.05; * significant at p = 0.05; ** significant at p = 0.01; *** significant at p < 0.01. SD: stump disc. SD–S: stump disc sapwood. SD–H: stump disc heartwood. SK: stump knot. SK–S: stump knot sapwood. SK–H: stump knot heartwood. CR1: coarse root diameter >10 cm. CR2: coarse root diameter 5–10 cm. CR3: coarse root diameter 2–5 cm.
Disclaimer/Publisher’s Note: The statements, opinions and data contained in all publications are solely those of the individual author(s) and contributor(s) and not of MDPI and/or the editor(s). MDPI and/or the editor(s) disclaim responsibility for any injury to people or property resulting from any ideas, methods, instructions or products referred to in the content. |
© 2023 by the authors. Licensee MDPI, Basel, Switzerland. This article is an open access article distributed under the terms and conditions of the Creative Commons Attribution (CC BY) license (https://creativecommons.org/licenses/by/4.0/).
Share and Cite
MDPI and ACS Style
Men, X.; Yue, Y.; Gu, H.; Wang, X.; Chen, X. Effects of Tree Competition on Biomass Allocation of Stump and Coarse Roots of Larix olgensis of Different Site Classes. Forests 2023, 14, 1431. https://doi.org/10.3390/f14071431
AMA Style
Men X, Yue Y, Gu H, Wang X, Chen X. Effects of Tree Competition on Biomass Allocation of Stump and Coarse Roots of Larix olgensis of Different Site Classes. Forests. 2023; 14(7):1431. https://doi.org/10.3390/f14071431
Chicago/Turabian StyleMen, Xiuli, Yang Yue, Huiyan Gu, Xiuwei Wang, and Xiangwei Chen. 2023. "Effects of Tree Competition on Biomass Allocation of Stump and Coarse Roots of Larix olgensis of Different Site Classes" Forests 14, no. 7: 1431. https://doi.org/10.3390/f14071431
Note that from the first issue of 2016, this journal uses article numbers instead of page numbers. See further details here.