Spatial and Seasonal Variations of Standardized Photosynthetic Parameters under Different Environmental Conditions for Young Planted Larix olgensis Henry Trees


Department of Forest Management, School of Forestry, Northeast Forestry University, Harbin 150040, China
*
Author to whom correspondence should be addressed.
Forests 2018, 9(9), 522; https://doi.org/10.3390/f9090522
Submission received: 4 July 2018
/
Revised: 23 August 2018
/
Accepted: 27 August 2018
/
Published: 29 August 2018
(This article belongs to the Section Forest Ecology and Management)
Abstract
:Understanding the spatial and seasonal variations in leaf physiology is critical for accurately modeling the carbon uptake, physiological processes and growth of entire canopies and stands. For a 17-year-old Larix olgensis Henry plantation, vertical whorl-by-whorl sampling and analyses of seasonally repeated measurements of major photosynthetic parameters were conducted, and the correlations between photosynthetic parameters and environmental conditions, leaf morphological traits and spatial position within the crown were analyzed. According to the correlations, the photosynthetic parameters were standardized based on the environmental conditions to avoid the influence of the changing environment on the patterns of spatial and seasonal variations of photosynthetic parameters. The results showed that the standardized light-saturated net photosynthetic rate (SPmax), standardized dark respiration (SRd) and standardized stomatal conductance under saturated light (Sgs-sat) were all negatively related to the relative depth into the crown (RDINC) throughout the growing season. However, their vertical patterns were different during the development of the phenological phase. In addition, different gradients of environmental conditions also influenced the values and the range of the vertical variation in photosynthesis. High temperature and low humidity usually resulted in smaller values and weaker vertical variations of SPmax and Sgs-sat, but larger values and more obvious vertical variations in SRd. SPmax and Sgs-sat usually exhibited a parabolic seasonal pattern in different vertical positions within the crown; however, SRd generally followed a concave pattern. These seasonal patterns were all weaker with increasing RDINC. Different environments also exhibited a significant influence on the seasonal patterns of photosynthesis. We suggested that standardization is necessary before analyzing spatial and seasonal variations. A single environmental condition could not represent the spatial and seasonal patterns under all gradients of the environment. Spatial and seasonal variations should be simultaneously analyzed because they are related to each other.
1. Introduction
Light-saturated net photosynthetic rate (Pmax), dark respiration (Rd) and stomatal conductance (gs) are representative photosynthetic parameters that generally exhibit significant spatial variations, especially in the vertical direction [1,2,3,4]. Detailed information about the vertical variations of photosynthesis largely affects the accuracy of carbon uptake estimations, which promotes the evolution of eco-physiological models from big-leaf models to multilayer models [5]. Multilayer estimations of carbon uptake contribute to the determination of the functional crown range of a tree crown or canopy [6,7], which can provide guidance in artificial pruning and, consequently, improve the economic value of timber [8,9]. For short trees, Pmax and Rd generally decrease with increasing depth into the crown [1,4,10] because the light environment is the core factor determining leaf development [10,11,12,13,14]. This behavior is more obvious in dense stands. However, it has been suggested that the dominant mechanism restricting leaf photosynthesis is water potential or hydraulic constraints, which increase with tree height [2,15,16,17,18,19], and this phenomenon is more obvious in tall tree species [17,18,19]. To adapt to vertical variations of environmental conditions, leaves usually express a significant vertical variation of morphological characteristics. Leaf mass per area (LMA) is one of the most important morphological characteristics [20,21,22,23,24]. The vertical LMA patterns are the result of the adaptation of leaves to both the light environment [11,14,20] and hydraulic constraints [25]. Moreover, LMA is closely associated with mesophyll conductivity to carbon dioxide [3,26] and consequently usually exhibits strong correlations with photosynthetic indicators [24,27,28].
The vertical patterns of leaf photosynthesis markedly change with phenological phases [19]. During the growing period, leaf functional traits vary as a result of the dynamic performance of leaf ontogeny and the environmental conditions [19,29]. For example, Pmax generally demonstrates a parabolic seasonal pattern, which is widely attributed to the phenological phase changes in mean leaf temperature, solar irradiance and soil moisture [30,31,32,33]. LMA usually increases rapidly during the leaf-expanding phase [32,34,35], which is caused by the accumulation of secondary metabolites [16,27,34,36] and is followed by the flattening or declining of the varied climatic conditions, e.g., light conditions [31,37] or soil water content [35,38,39]. In addition, other factors that have been suggested to affect photosynthesis to a certain extent include leaf age [10,15,33], distance to branch base [16] and sex [32,40], but these factors are more applicable to evergreen tree species and dioecious tree species.
The spatial and seasonal variations of leaf photosynthetic traits play important roles in the attempt to understand the constraints on carbon uptake [19,34,41,42,43] and in models of physiological processes [44,45] and the growth [46,47,48,49] of entire canopies and stands. Incorrect simulations occur when modeling the long-term carbon uptake if the spatial and seasonal variations in photosynthesis [19,29,41,42,43] or morphology [35,50] are neglected.
Most previous investigations on the spatial variations of photosynthesis-related leaf traits indicated that environmental conditions such as leaf temperature (Tleaf) and vapor pressure deficit (VPD) were always controlled within a similar range during measurements [3,11,27,50,51,52], which was usually a result of slight weather variations during the measurement process. However, environmental effects should be considered when studying the seasonal patterns of photosynthesis because seasonal fluctuations of the environment can be pronounced [34,39,53]. However, other studies have declared that environmental conditions could also maintain relatively stable values [33,54], or these studies have simply eliminated the “outliers” that markedly deviated from the average levels [34] or even directly overlooked the impacts of environmental changes [26,32,38,55,56].
Tleaf can be controlled with a photosynthetic apparatus but is limited by the difference between the ambient temperature and target temperature (acceptable range is ±5 °C), while VPD is almost impossible to control during measurements, especially when measuring light or CO2 response curves. It is unclear how the effects of environmental conditions should be treated when analyzing the vertical and seasonal patterns of photosynthesis, particularly in areas with sharply fluctuating environmental conditions. Moreover, it is unclear whether the spatial and seasonal patterns under a certain environmental condition could represent the effects of all gradients of environmental conditions, even if the environment can be controlled.
Larix olgensis Henry is an apparently light-demanding, cold-resistant but shade-intolerant tree species that has the advantages of fast growth, strong adaptability and high economic value [57,58]. Larix olgensis is one of the main afforestation tree species and accounts for 36% of the planted area and 37% of the planted volume in northeastern China. Larix olgensis has been identified as a major fast-growing and high-yielding tree species in northeastern China [59]. Research on the photosynthetic characteristics of larch has been reported [60,61,62,63,64,65,66,67], but only a few studies have examined the photosynthetic characteristics of Larix olgensis [65,66,67]. Most previous studies have focused on diurnal changes or the response of photosynthetic characteristics to different concentrations of nitrogen or phosphorus rather than their spatial and seasonal variations. Liu et al. [65] analyzed spatial differences in crown photosynthesis in Larix olgensis but did not explain the reason for these spatial differences. Wang et al. [62] proved that the seasonal changes in the photosynthetic capacity of Larix kaempferi Sarg. depend on chlorophyll content. Galvagno et al. [63] and Kurachi et al. [64] proved that air temperature was the main factor influencing the seasonal variations of photosynthesis. However, they did not consider the comprehensive influence of all possible factors.
In this study, we hypothesize that the photosynthetic indicators mainly depend on the environmental conditions, needle morphology and vertical position within the crown. The objectives of this study are (i) to analyze the correlations between Tleaf, VPD, LMA and relative depth into crown (RDINC) and Pmax, Rd and gs-sat (light-saturated stomatal conductance); (ii) to standardize Pmax, Rd and gs-sat depending on the above correlations; and (iii) to analyze the spatial and seasonal patterns of standardized photosynthetic parameters under different gradients of environmental conditions.
2. Materials and Methods
2.1. Site Description
The experiments were conducted in 2017 at the experimental forest farm of Northeast Forestry University in Maoershan, which is 80 km southeast of Harbin, China (45°23′21″ N, 127°37′56″ E; altitude: 370 m above sea level). The site is characterized by a midlatitude monsoon climate, with warm, wet summers and cold, dry winters. The growing season for deciduous tree species is approximately five months, i.e., from early May (the end of the frost period) to the middle of September (the first frost). The average temperature throughout the growing season at the site is 17.0 °C (with a range from −1.3 °C to 39.4 °C), the average precipitation through the growing season is 944 mm, and the majority of the precipitation in the study period fell from June to August. The type of soil is typic Eutroboralfs [68], and the total forest coverage is approximately 83.3%, including 14.7% plantation.
2.2. Sample Selection
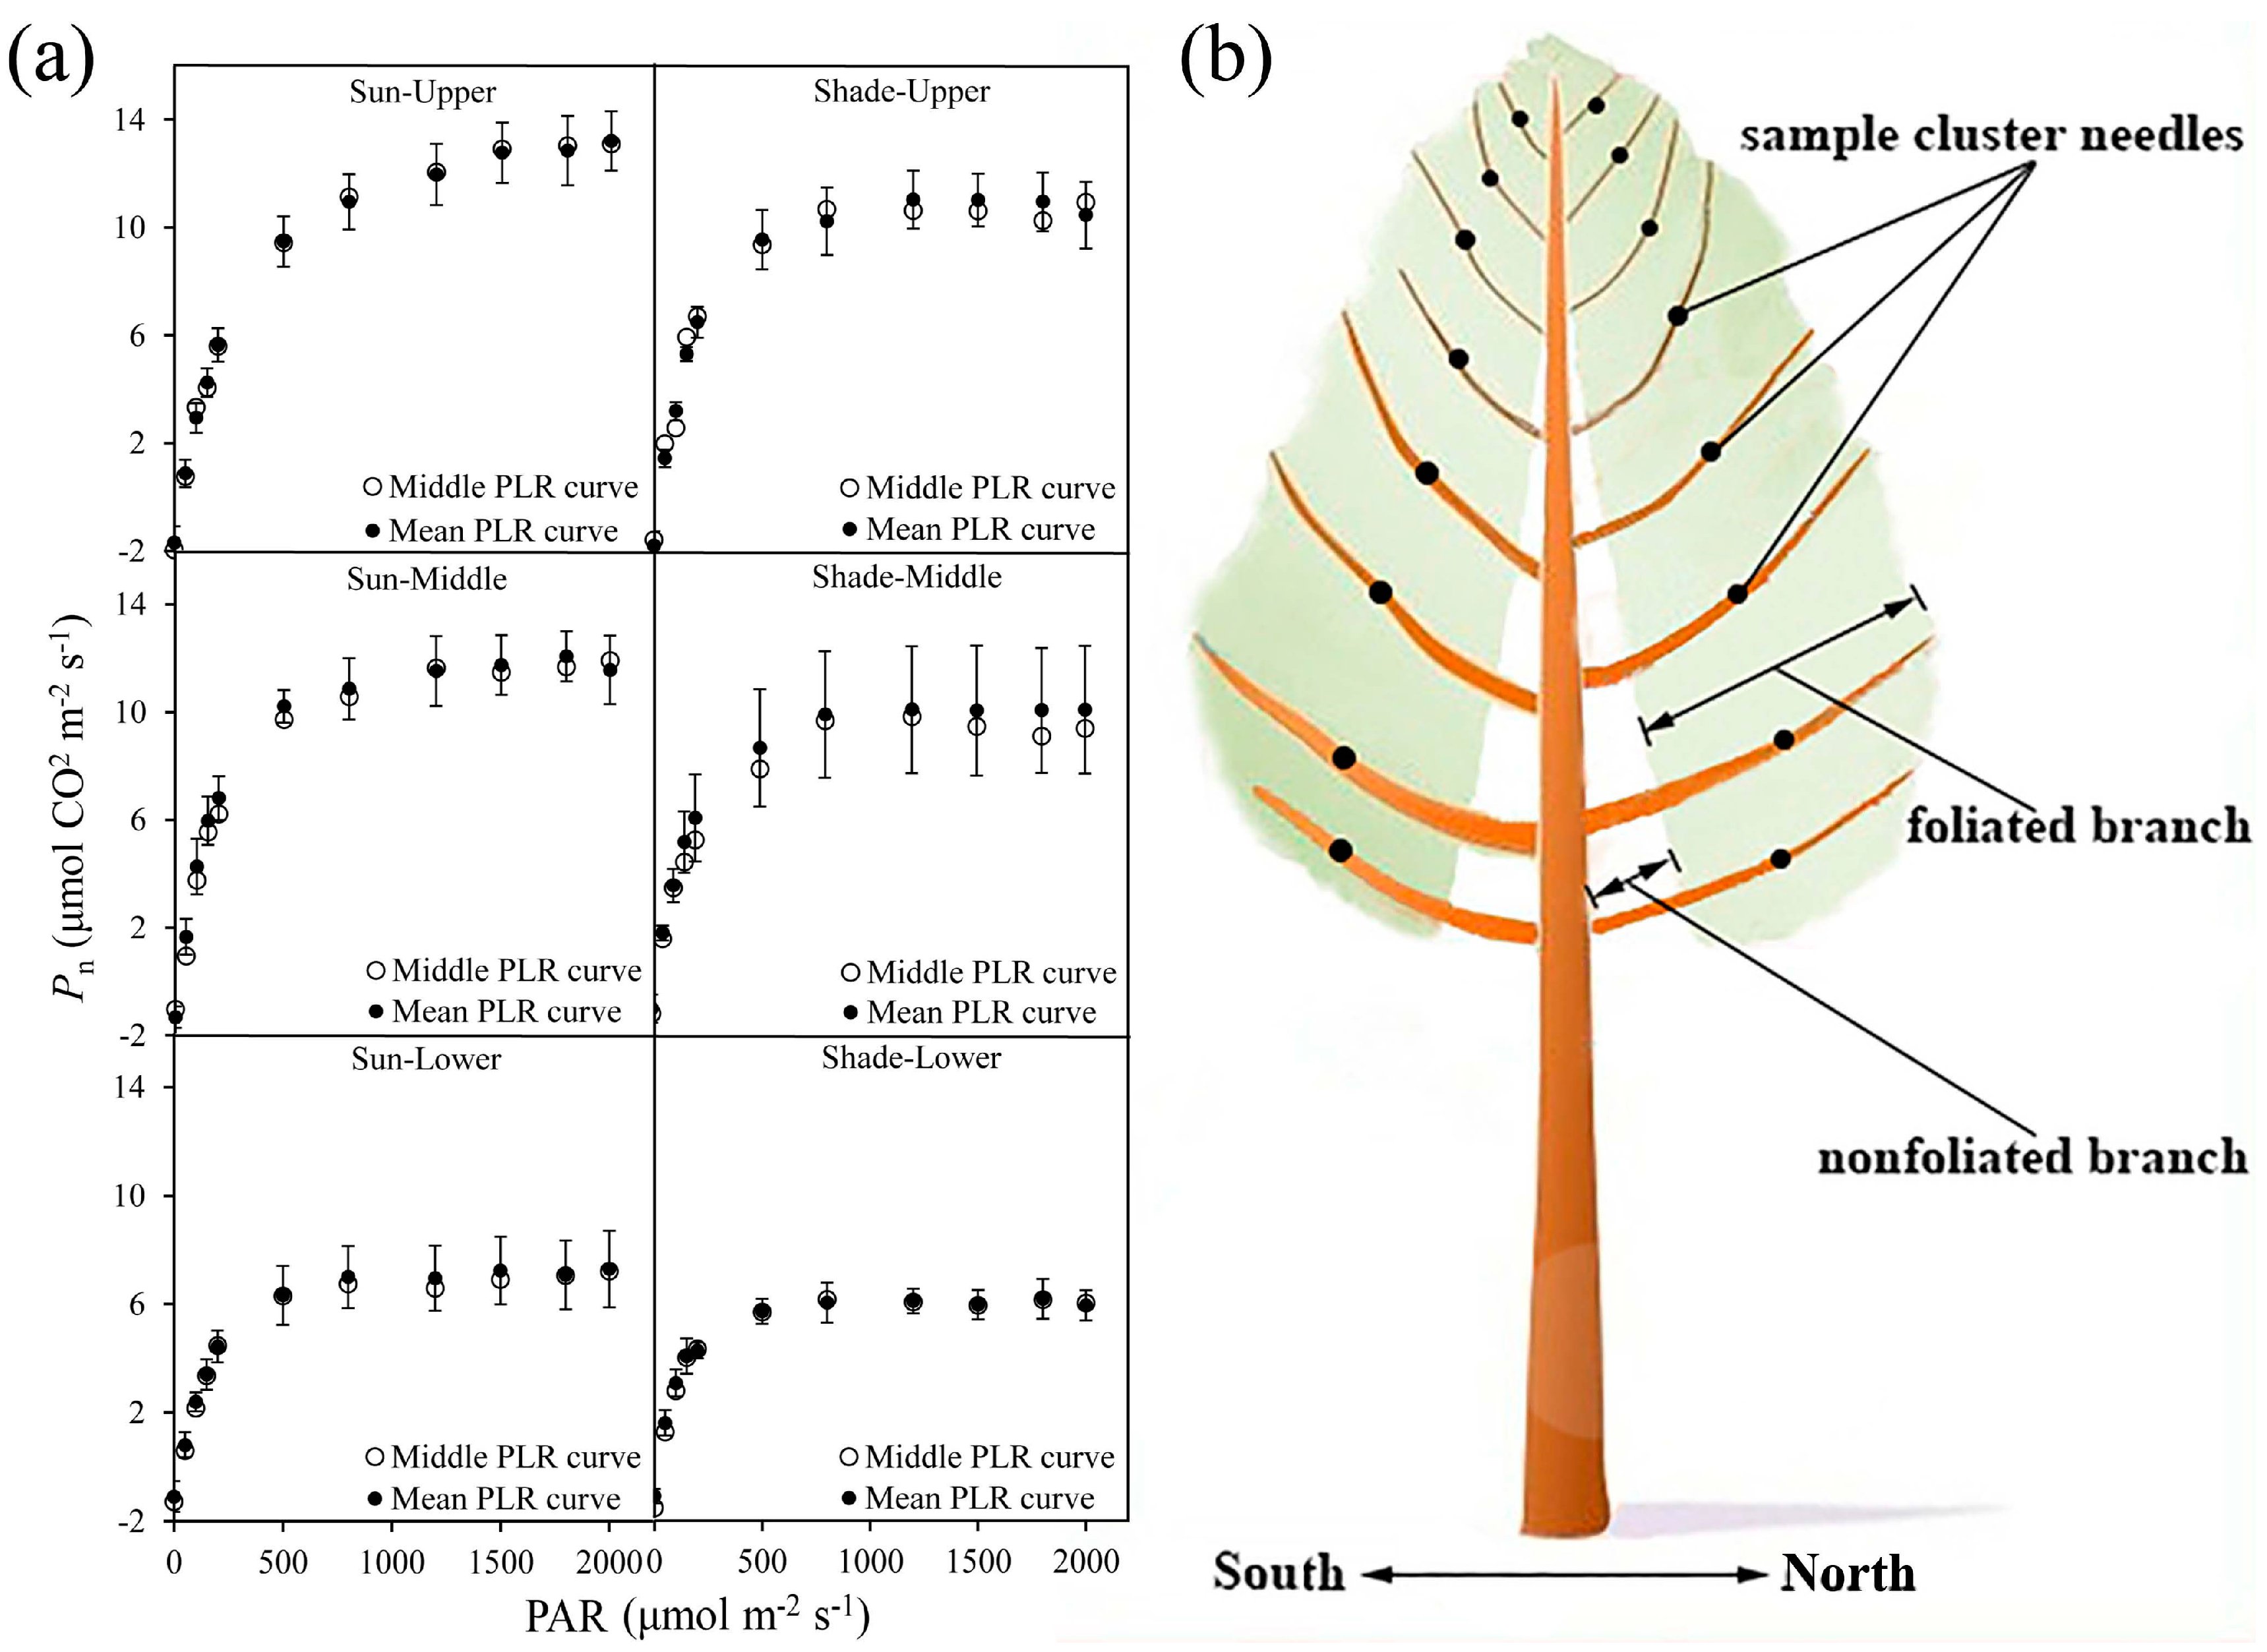
In this study, five sample plots (20 m × 30 m) were established within 17-year-old pure Larix olgensis plantations of the same habitat. The diameter at breast height (DBH) and tree height (H) were measured for each tree whose DBH was greater than 5 cm in each plot, and the quadratic mean diameters (Dg) for five plots were calculated independently. Then, five sample trees with DBH values respectively similar to the Dg of the five plots were selected to represent the average state of each plot. The attributes of the sampling plots and corresponding sampled trees are listed in Table 1. Scaffoldings were built around each sample tree to ensure that measurements could be performed at every crown position. The crown depths of the sample trees were divided into several vertical segments based on the pseudowhorls [69] from top to bottom within the crown. Previous work was conducted to analyze the horizontal differences in the photosynthetic light response (PLR) curves of the branches before the photosynthetic needle samples were selected (unpublished data), and the results showed that the PLR curves of the needles from the middle of a foliated branch adequately represented the average PLR curves of the entire branch (Figure 1a). Thus, three healthy and fully expanded needle clusters located within each segment in the middle of the foliated branches in sunny, semisunny and shaded crowns were selected (Figure 1b only presents the needle samples in sunny crowns and shaded crowns).
2.3. Photosynthetic Gas Exchange Measurements
Photosynthetic gas exchange measurements were conducted every half-month during the 2017 growing season in eight measurement campaigns (P, from 1 to 8): 15–25 May (P1), 1–10 June (P2), 15–25 June (P3I), 1–10 July (P4), 15–25 July (P5), 1–10 August (P6), 15–25 August (P7) and 1–10 September (P8). All photosynthetic properties were measured using a portable steady-state photosynthesis system (LI-6400XT, LI-COR, Inc., Lincoln, NE, USA) equipped with a standard LED light source (6400-02B, LI-COR, Inc., Lincoln, NE, USA). The system was calibrated at the beginning and end of the season. The needle cluster samples were acclimated for 20 min at a CO2 concentration of 370 ppm, which is close to the actual CO2 concentration within the crown. A CO2 mixer (6400-01, LI-COR, Inc., Lincoln, NE, USA) was used to maintain a stable CO2 supply in the chamber, and a PAR (photosynthetically active radiation) of 1400 μmol m−2 s−1 was used to induce the needles for at least 10 min. This value was preliminarily confirmed to ensure saturating light conditions for all needle cluster samples (Figure 1a). PLR curves were measured at 17 PAR intensities in the following order: 2200; 2000; 1800; 1600; 1400; 1200; 1000; 800; 600; 400; 200; 150; 100; 60; 40; 15; and 0 μmol m−2 s−1. The needle cluster samples were allowed to equilibrate for a minimum of 2 min at each step before the data were logged. The RDINC of each needle cluster sample was recorded when measuring the PLR curves. All measurements were conducted under ambient conditions with no control except for the CO2 concentration in the chamber (stabilized at 370 ppm). The environmental variables (i.e., air temperature, Tair and VPD) outside the chamber were measured using a dynamic weather station (DL16, Adolf Thies GmbH & Co., KG, Göttingen, Germany) at 30-min intervals.
2.4. Photosynthetically Active Radiation Measurements
The crowns of the sample trees were equally divided into four directions horizontally based on the azimuth: eastern (45–135°), southern (135–225°), western (225–315°) and northern (<45° and >315°). In each vertical segment within the crown, PAR values evenly distributed in each direction were measured. The measurements were conducted from 8:00 a.m. to 16:00 p.m. at 2-h intervals on a clear day by using the LI-190s (LI-COR, Inc., Lincoln, NE, USA) quantum sensor, which was mounted on the sensor head of a portable steady-state photosynthesis system (LI-6400XT). We hypothesized that the vertical distribution of PAR within the crown would not significantly vary after the needle fully expanded, and thus the measurements of PAR were conducted only once, in August.
2.5. Leaf Morphology Measurements
Once the photosynthetic gas exchange measurements were completed, the photosynthetic needle cluster samples were taken immediately to measure the LMA (g m−2). All samples were scanned immediately after collection and then surveyed with an image editor (Image-Pro Plus 6.0, Media Cybernetics, Bethesda, MD, USA) in the laboratory, resulting in a projected leaf area. The corresponding needles were then directly dried at 105 °C to a constant weight and weighed. The LMA was calculated by dividing needle dry mass by the corresponding projected leaf area.
2.6. Photosynthetic Parameters
The Pmax (μmol m−2 s−1) and Rd (μmol m−2 s−1) were estimated from the PLR curves using the modified Mitscherlich model [70].
where Pn is the net photosynthetic rate (μmol m−2 s−1), Pmax is the light-saturated net photosynthetic rate (μmol m−2 s−1), α is the apparent quantum yield, PAR is the photosynthetically active radiation (μmol m−2 s−1), and Rd is the dark respiration rate (μmol m−2 s−1).
The light-saturated gs (gs-sat) was determined as the corresponding gs value of Pmax. The statistics of the sample trees and branches are listed in Table 2.
2.7. Statistical Analysis
As the environmental conditions, except for CO2 concentrations (stabilized at 370 ppm), were not maintained at a certain value during the PLR curve measurements, the correlations between the photosynthetic parameters and environmental conditions (Tleaf and VPD) were analyzed using correlation analysis. In addition, the relationships between the photosynthetic parameters and leaf morphology (LMA) and vertical position within the crown (RDINC) were analyzed. Then, the regression equations between the photosynthetic parameters and the combinations of Tleaf, VPD, LMA and RDINC were established based on their relationships. Afterward, the photosynthetic parameters were standardized to any given environmental condition according to the regression equations to avoid the influence of pronounced fluctuations of environmental conditions during the whole phenological phase. The coefficient of determination (R2) and root mean square error (RMSE) were used to evaluate the performance of the regression equations. All statistical analyses were carried out using SAS 9.3 (SAS Institute Inc., Cary, NC, USA).
3. Results
3.1. Environmental Conditions
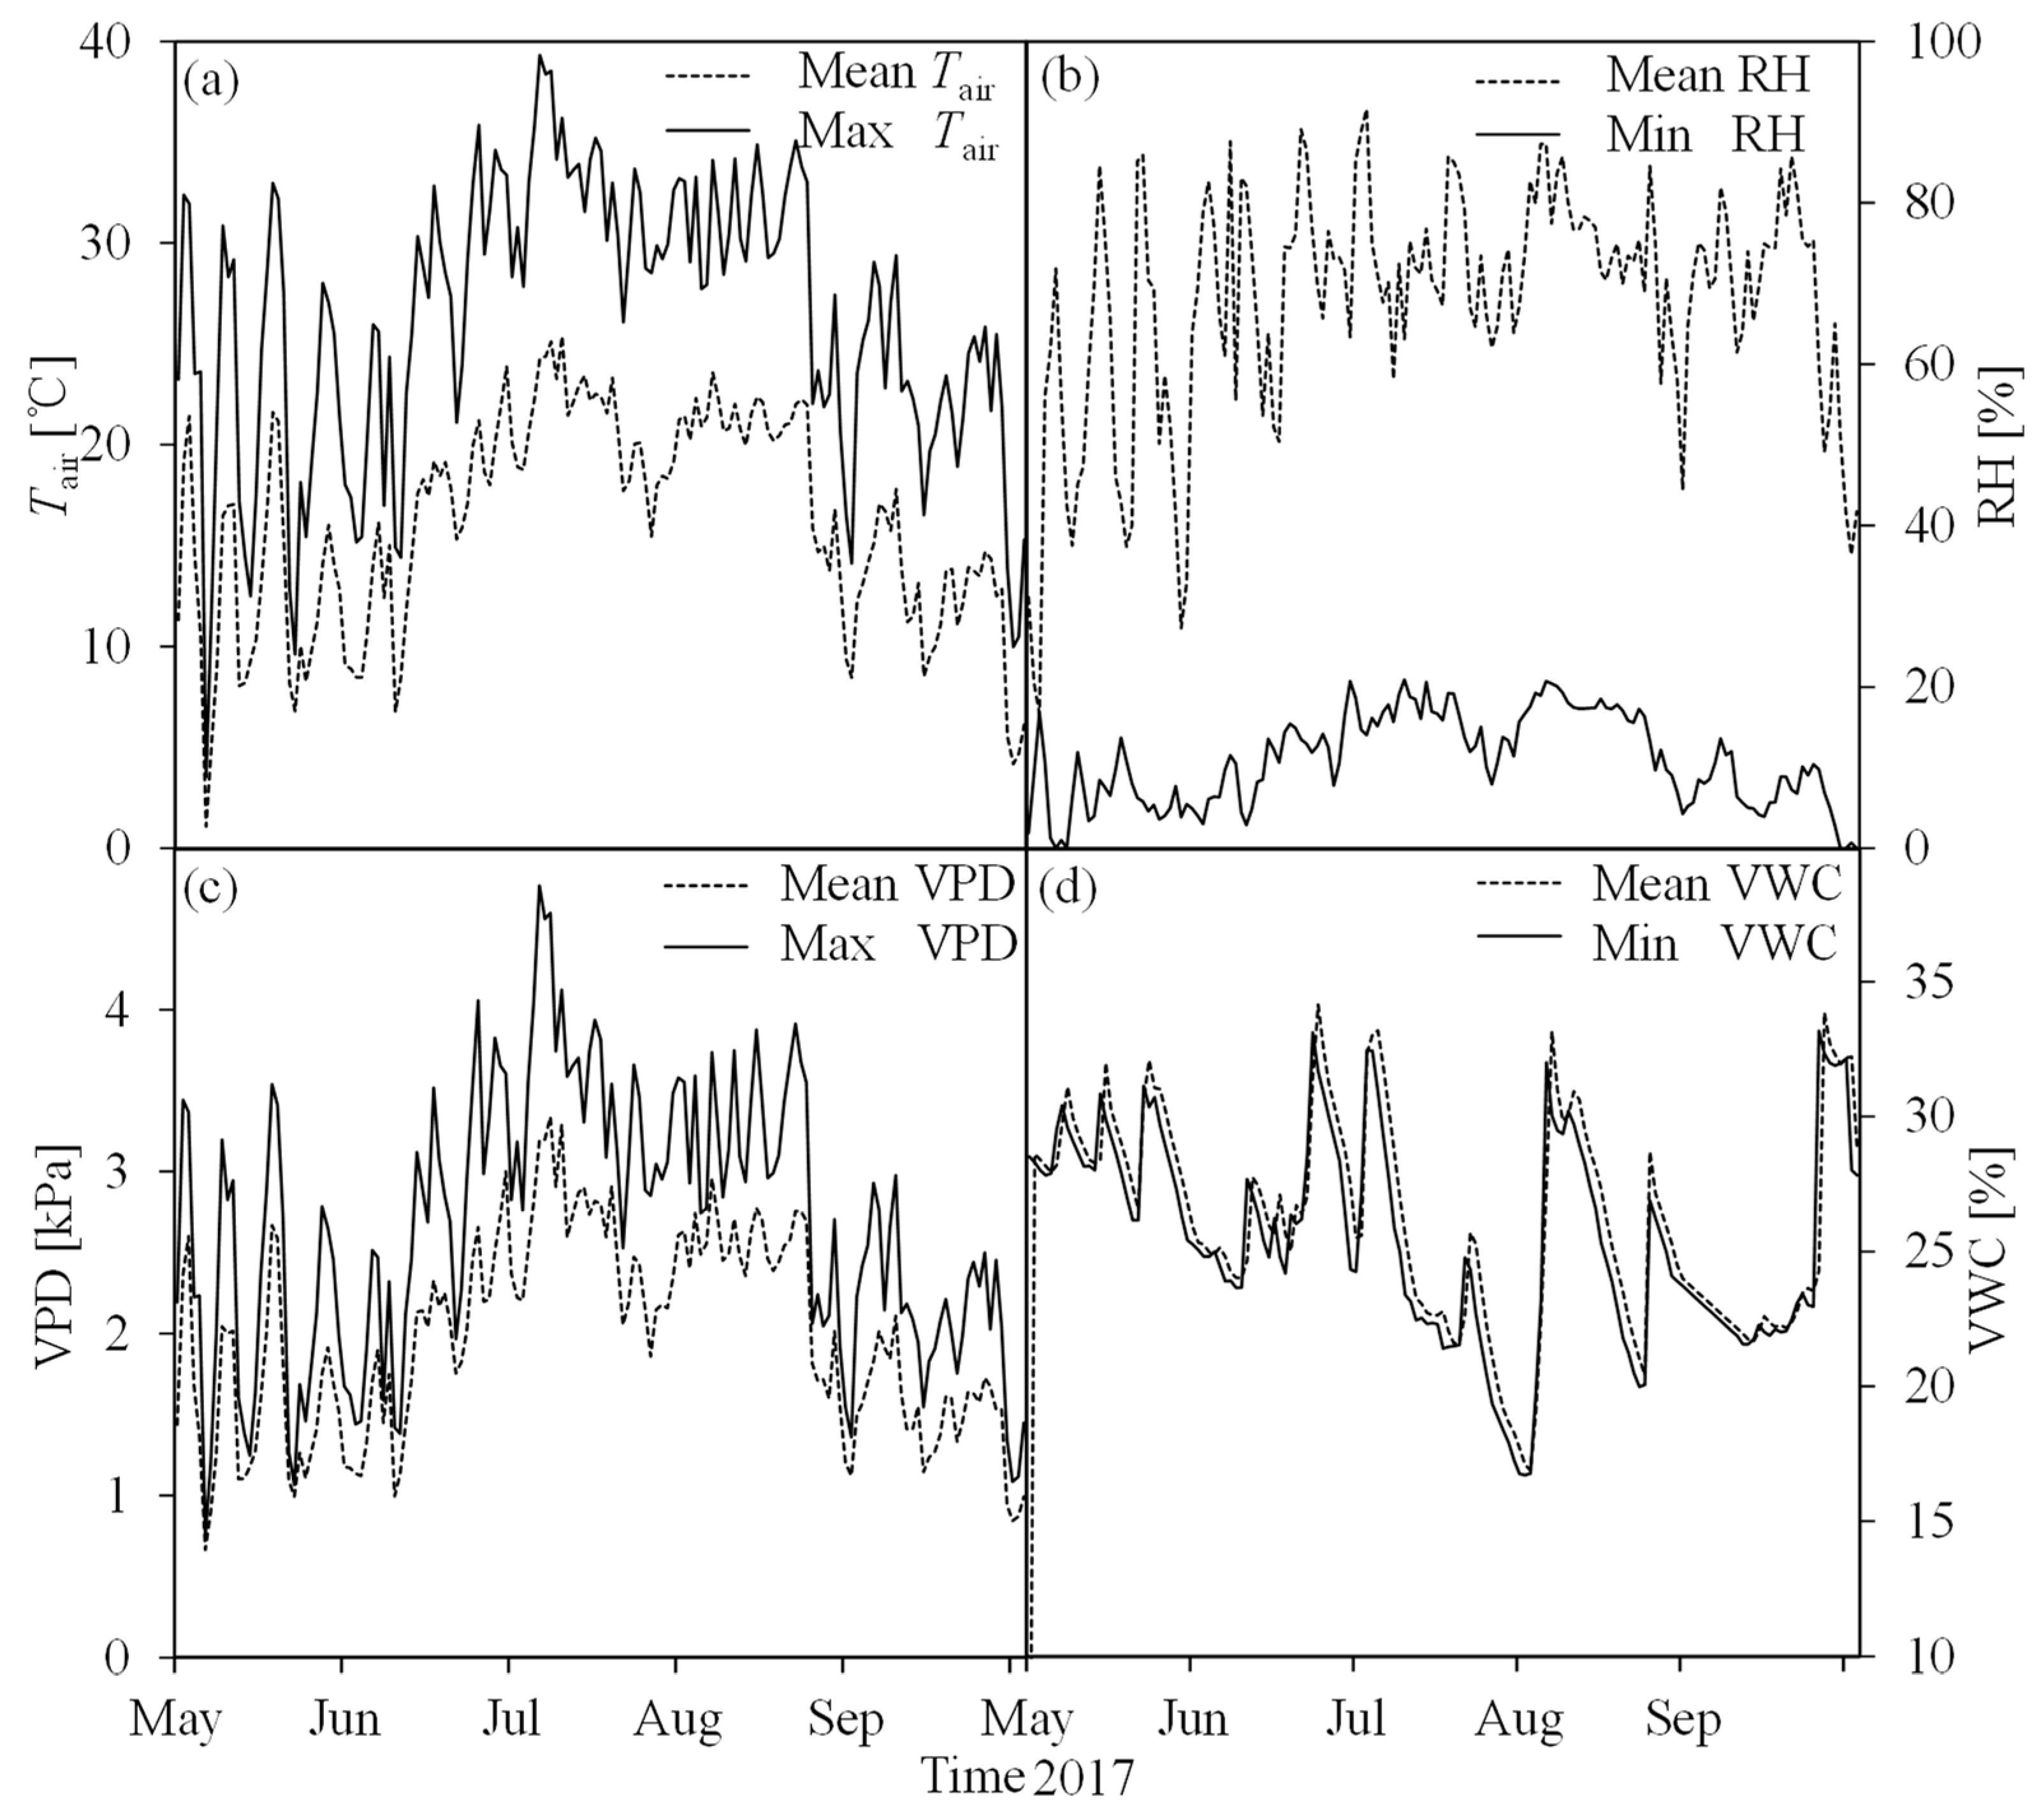
The main climate type of the study area is midlatitude monsoon with a volatile seasonal pattern (Figure 2). Tair and VPD demonstrated similar changes and were higher in July and August but lower in the other months of the growing season. The diurnal maximum/mean Tair and maximum/mean VPD changes were abrupt during the seasonal transitions. The maximum values of daily Tair and VPD reached 39.3 °C (Figure 2a) and 4.77 kPa (Figure 2c), respectively, at midday and appeared on the same day (5th July), while the minimum daily maximum Tair and VPD were 3.5 °C and 0.75 kPa (both on 6th May), respectively. The daily RH (relative humidity) and soil moisture (volumetric water content (VWC), %) also frequently and evidently varied during the study period. The daily mean RH was obviously higher than the daily minimum RH (Figure 2b), but there was not a marked difference between the daily mean VWC and minimum VWC (Figure 2d). Although the growing season showed a relatively high daily mean RH value, dry conditions still appeared at the beginning of August. The sharply diurnal fluctuations of weather make it almost impossible to maintain stable environmental conditions during the measurements of photosynthesis, especially among different seasons. Thus, it is necessary to eliminate the influence of changing environments before analyzing the spatial and seasonal variations in the photosynthetic parameters.
3.2. Relationships between Photosynthetic Parameters Versus Tleaf, VPD, LMA and RDINC
Tleaf and VPD represent the main environmental factors, and LMA and RDINC represent the main morphological characteristic and vertical position within the crown of leaves, respectively. The relationships between the photosynthetic parameters and the above factors are exhibited in Figure 3. Pmax was significantly related to Tleaf and VPD (Figure 3a,b), in which Pmax was positively correlated with Tleaf but negatively correlated with VPD. The correlation between Pmax and VPD (r = −0.31) was stronger than that between Pmax and Tleaf (r = 0.22). The correlations between LMA and RDINC with Pmax (r = 0.77 and r = 0.70 respectively) were stronger than those between Tleaf and VPD with Pmax. LMA was positively correlated with Pmax (Figure 3c), and, in contrast, RDINC was negatively correlated with Pmax (Figure 3d). Rd was positively correlated with Tleaf, VPD and LMA (Figure 3e–g), but the correlation between Rd and Tleaf was the most significant (r = 0.69). In contrast, Rd was negatively correlated with RDINC (Figure 3h), which was similar to the correlation of Pmax. gs-sat exhibited almost the same correlation patterns with the above factors (Tleaf, VPD, LMA and RDINC) (Figure 3i–l) as those of Pmax, which indicated that gs-sat was closely associated with Pmax.
3.3. Standardization of Photosynthetic Parameters
According to the relationships between Pmax and Tleaf, VPD, LMA and RDINC (Figure 3a–d), regression analysis was conducted among Pmax and Tleaf, VPD, LMA, RDINC and their combinations. Hence, the combination of LMA, VPD and RDINC was selected as the best variable for estimating Pmax. Thus, the Pmax was converted to a standard Pmax (SPmax) using following the equation:
where a0 and a1 are estimable parameters.
Similarly, regression analysis among gs-sat and Tleaf, VPD, LMA, RDINC and their combinations was also conducted. The results showed that was also the best combination for estimating gs-sat. Thus, gs-sat was converted to a standard gs-sat (Sgs-sat) using following equation:
where b0, b1 and b2 are estimable parameters.
Previous studies showed that Rd could be estimated by the exponential function [71,72,73,74,75] based on the exponential correlation between Rd and Tleaf. In this study, Rd demonstrates a similar exponential correlation with Tleaf; thus, the exponential function was applied for estimating Rd, which is described as follows:
where c0 and c1 are estimable parameters.
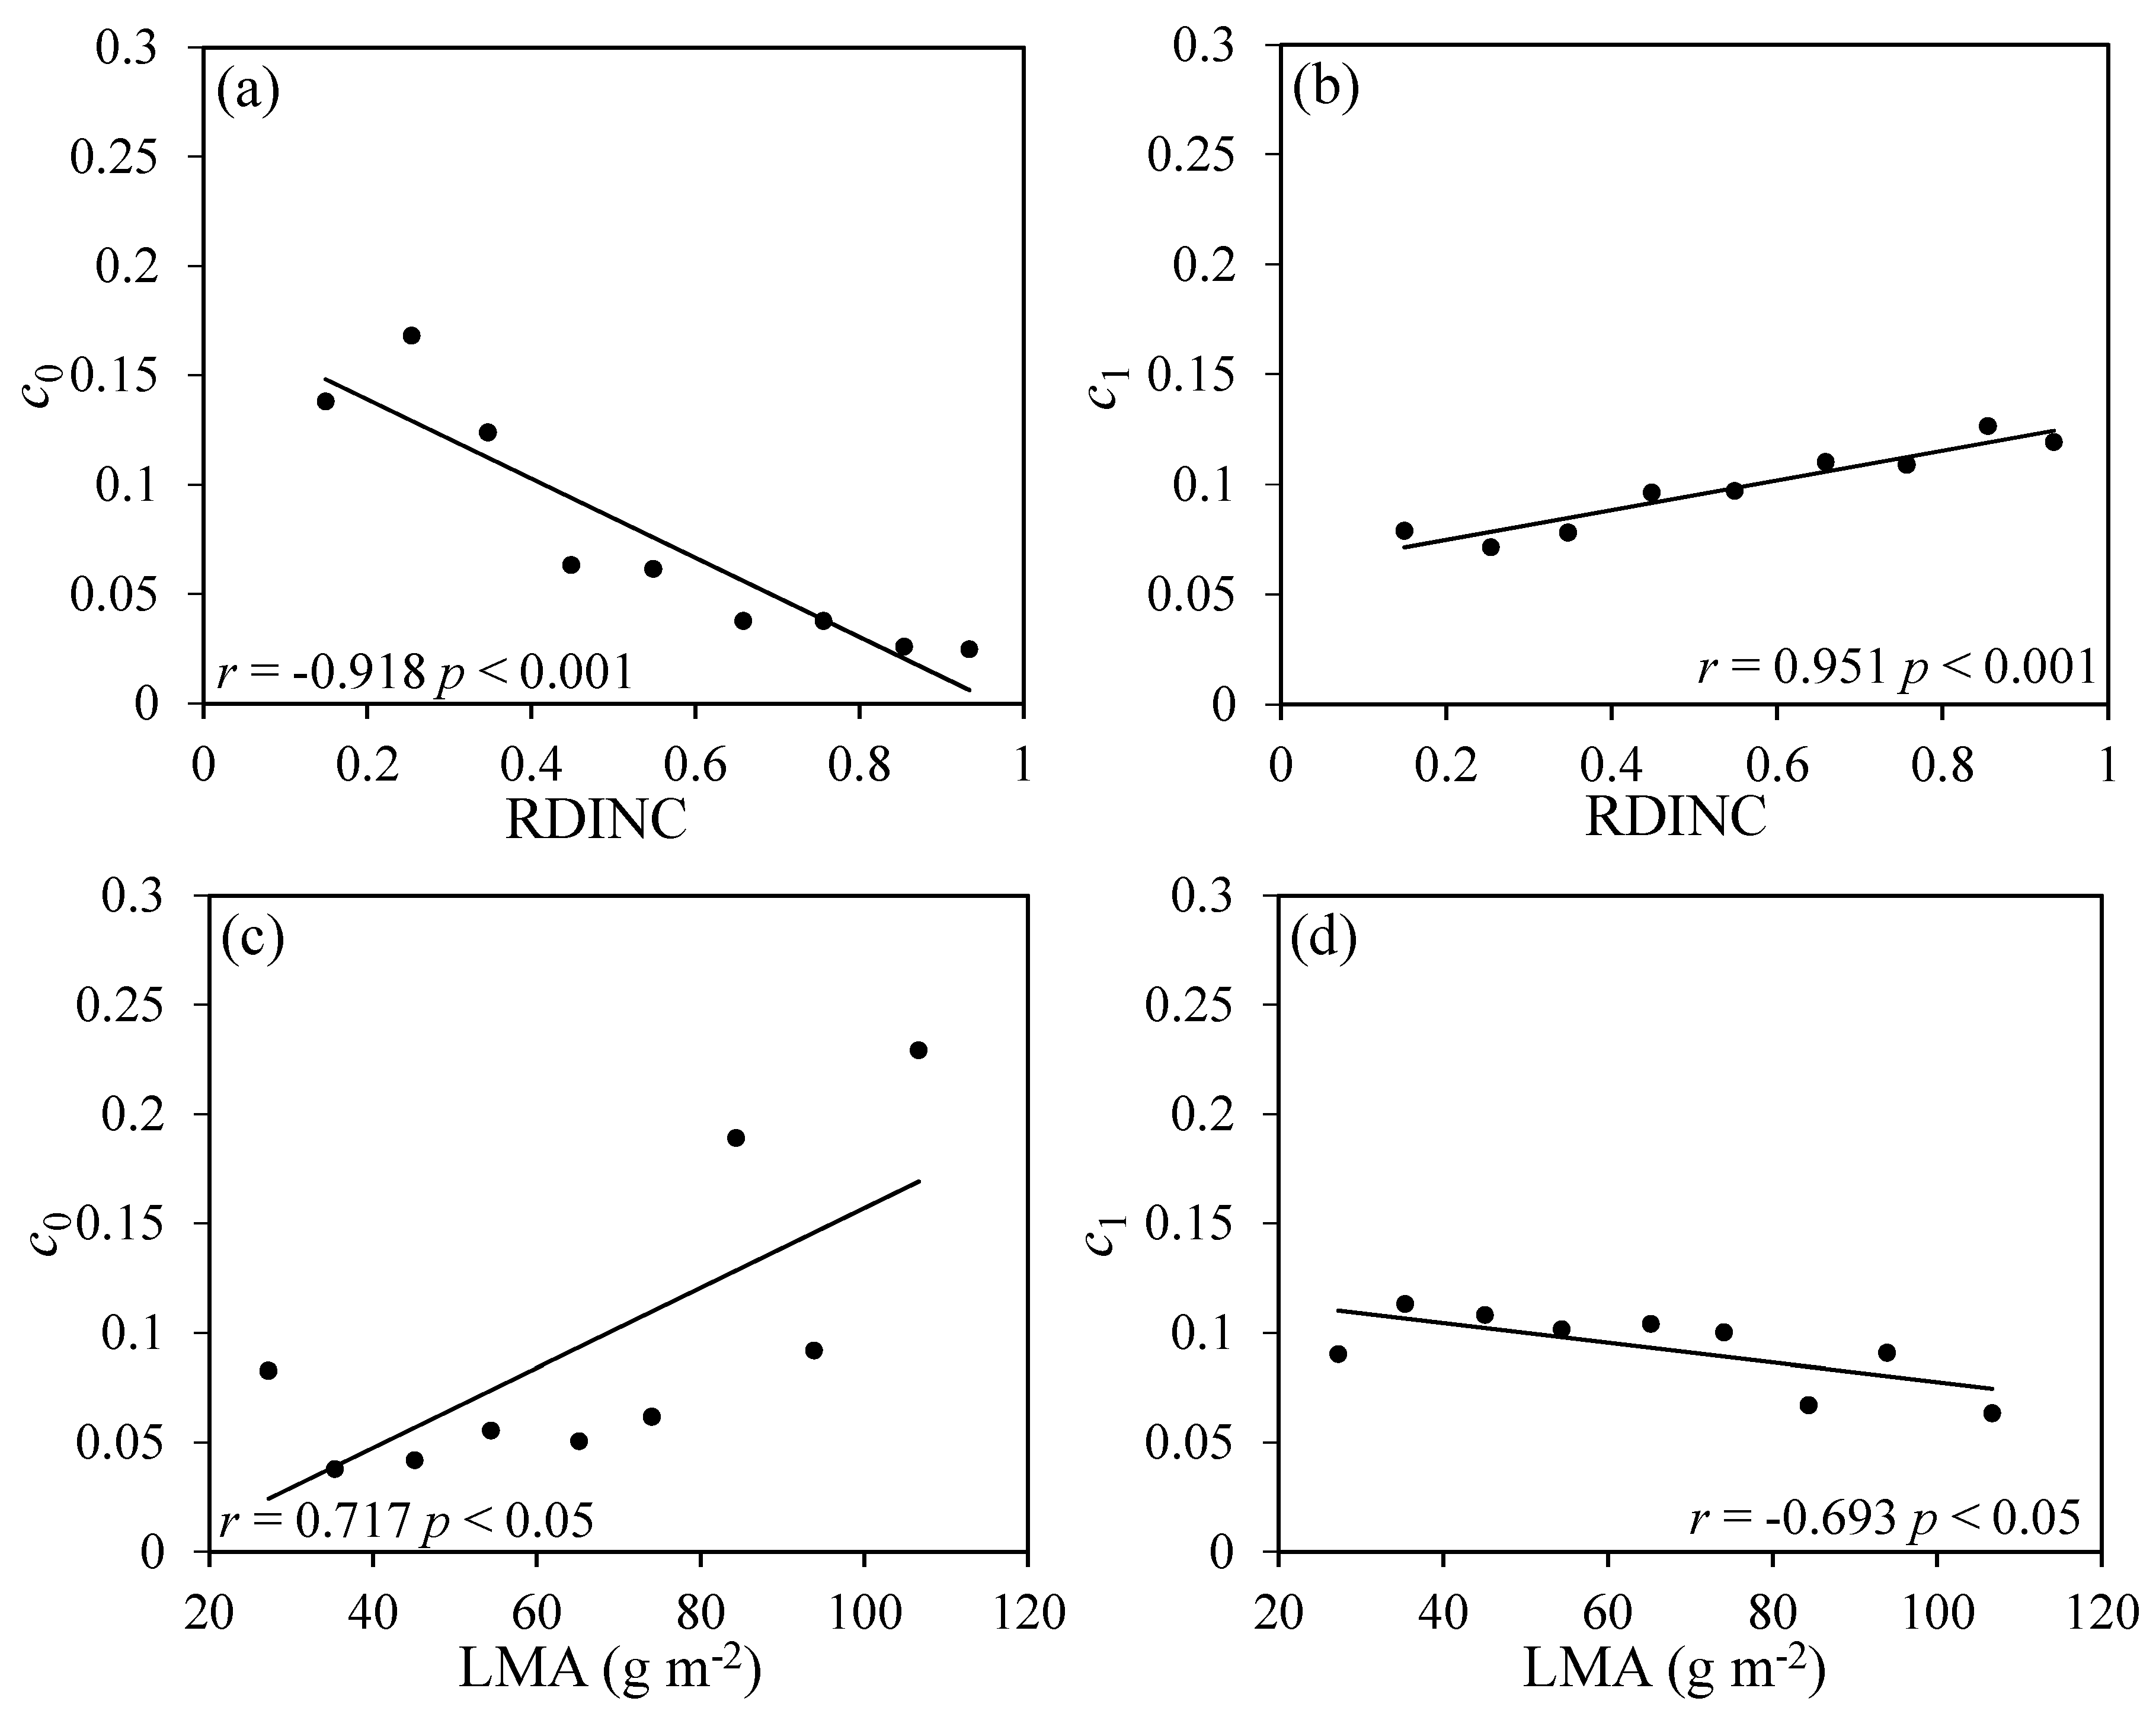
As Rd was also significantly related to LMA (Figure 3g) and RDINC (Figure 3h), we divided all the Rd values into nine groups according to RDINC at intervals of 0.1 and fitted Equation (4) to each group to obtain the parameters c0 and c1. Then, the relationships between c0 and c1 and the mean values of RDINC were analyzed (Figure 4a,b). Similarly, the Rd was also divided into 10 groups according to the LMA at intervals of 10 g m−2, and the relationships between c0 and c1 and the mean values of LMA were analyzed (Figure 4c,d). The results showed that c0 and c1 were both strongly correlated with RDINC and LMA. Thus, Equation (4) was further modified by reparameterizing c0 and c1 using RDINC and LMA, and the modified equations were determined according to R2 and RMSE. Then, the final Rd estimated equation was described as follows:
where d0, d1, d2 and d3 are estimable parameters.
The evaluation results of the above regression Equations (2), (3) and (5) are listed in Table 3. The R2 values of the three regression equations were above 0.5, indicating that the above regression equations could estimate the photosynthetic parameters well. According to the regression equations, SPmax, SRd and Sgs-sat could be obtained under any unified environmental conditions across the whole phenological phase. This could resolve the influence of the changing environment on photosynthesis, which makes analyzing the spatial and seasonal variations in the photosynthetic parameters more reasonable.
3.4. Vertical Profiles of Standardized and Non-Standardized Photosynthetic Parameters during the Growing Season
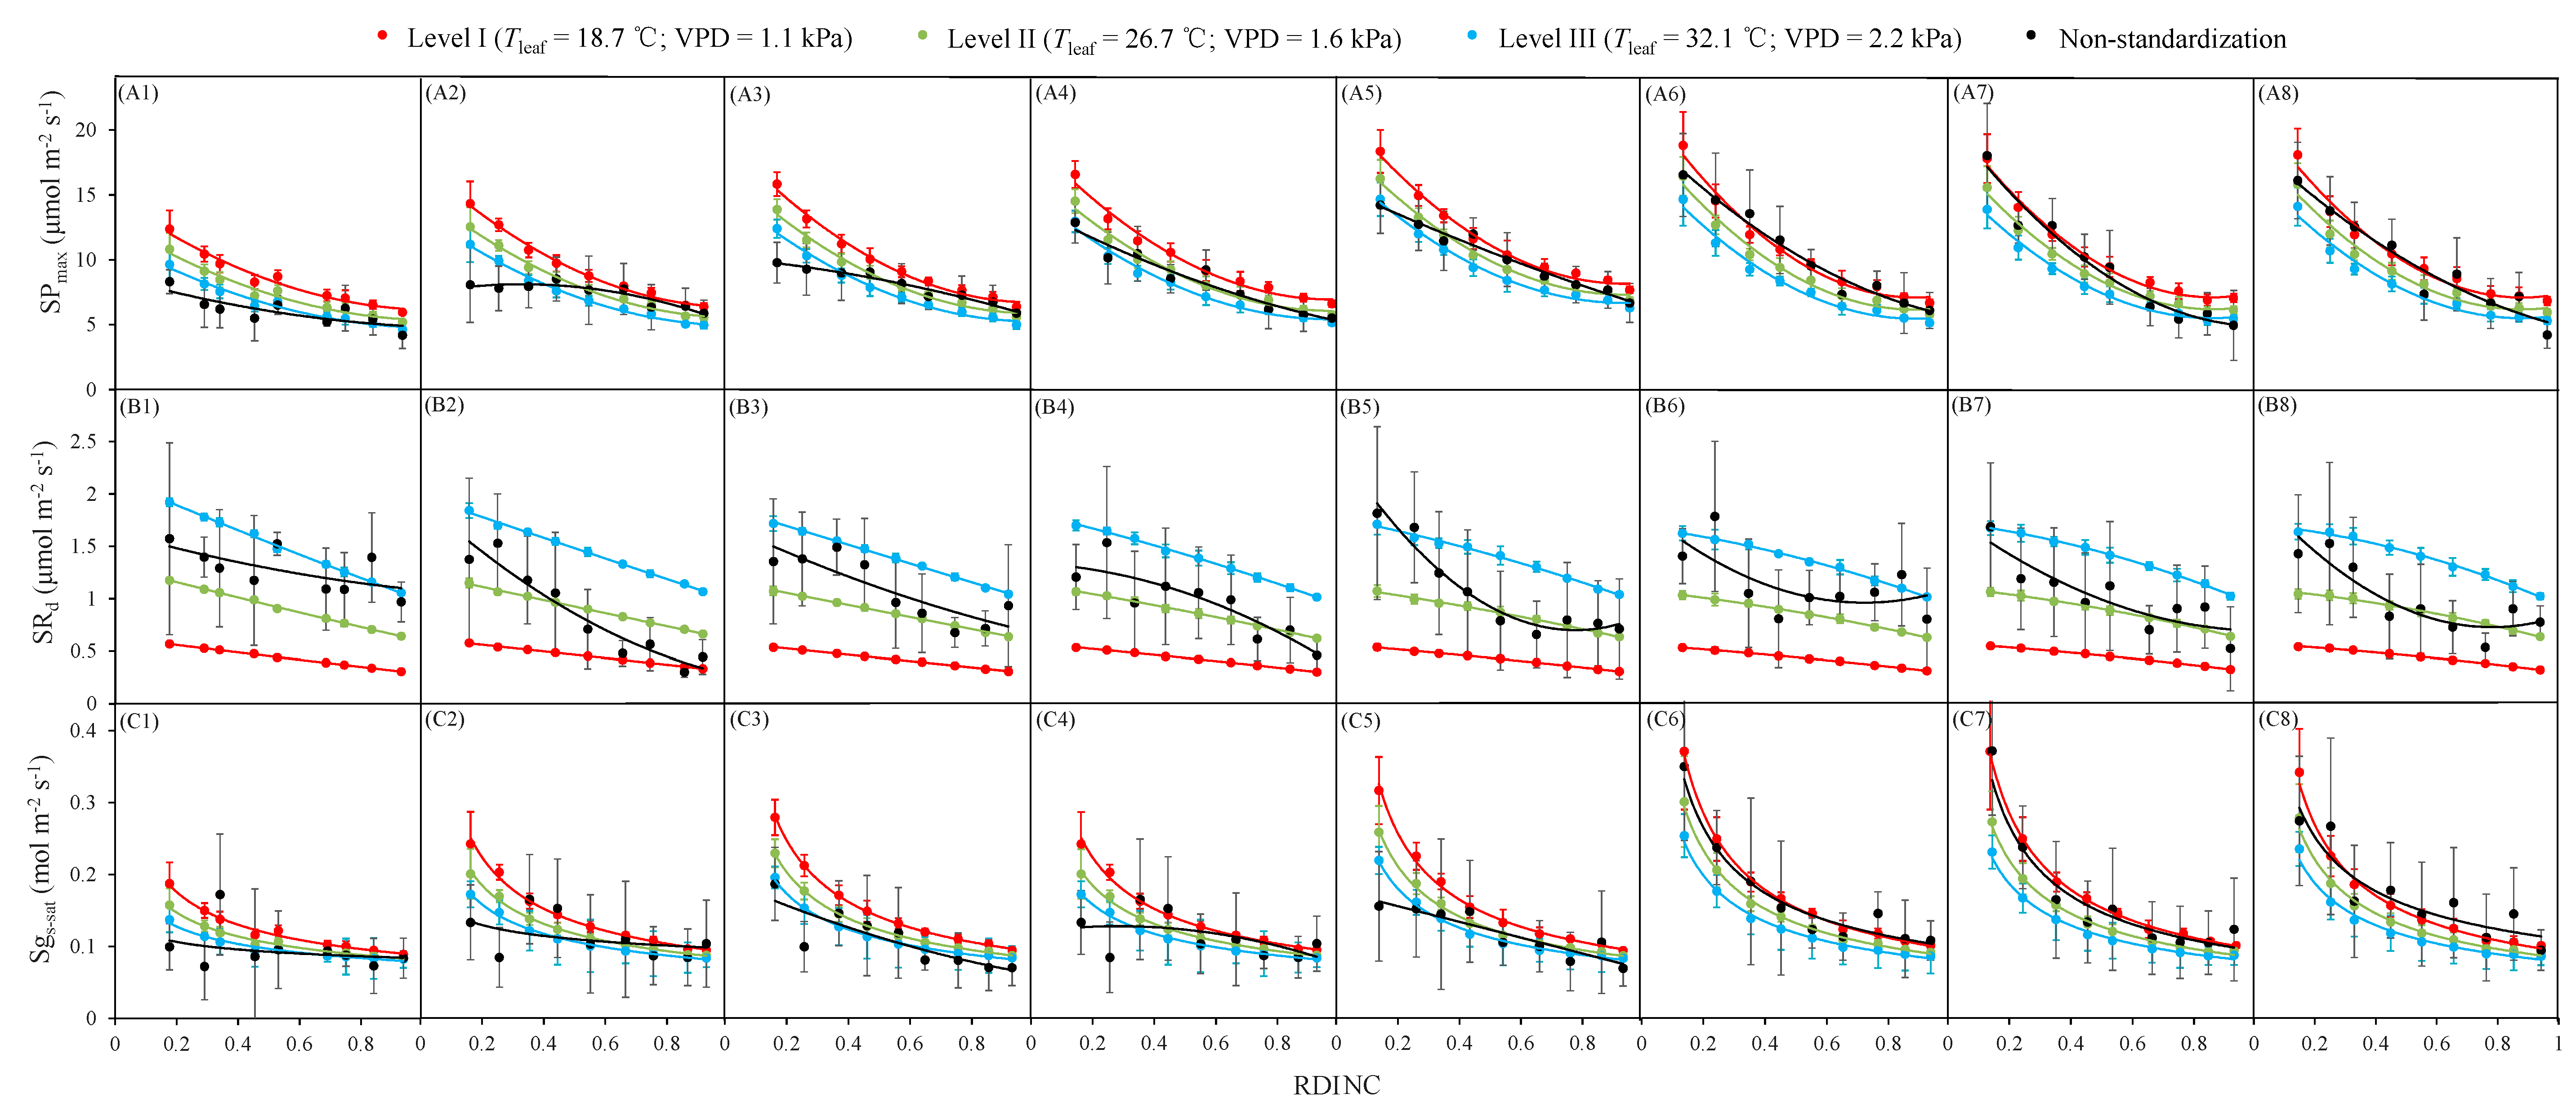
All three photosynthetic parameters exhibited a similar phenomenon of decreasing with the increasing RDINC throughout the growth season (Figure 5). SPmax showed a similar nonlinear declining tendency with RDINC in each measured period, and the slope gradually reduced with the increase in RDINC. However, the vertical patterns of SPmax still varied among the different phenological phases. The difference in SPmax from treetop to bottom (DTB) was small during the early leaf-expanding phase (Figure 5(A1)) but then increased as days progressed (Figure 5(A2–A4)), finally tending to be stable until the leaf fully expanded (Figure 5(A5–A8)). The vertical pattern of non-standardized Pmax was different from that of SPmax, especially during the leaf-expanding phase. Although SRd reduced with the increasing RDINC across the whole growing season (Figure 5(B1–B4)), the downtrend was weaker than that of SPmax. The vertical variations in the non-standardized Rd were more obvious than those of SRd during the growing season. Sgs-sat exhibited a similar vertical pattern to that of SPmax, but the pattern of Sgs-sat was more significant. Non-standardized gs-sat exhibited different vertical patterns (Figure 5C) in contrast to Sgs-sat during the growing season, with the exception of August (Figure 5(C6,C7)). The obvious seasonal variation in the vertical patterns also displayed that the DTBs increased as days went on until August.
3.5. The Response of Vertical Patterns of Standardized Photosynthetic Parameters to the Different Gradients of Environmental Conditions
According to the range of Tleaf during the growing season, the environmental conditions were divided into three gradients from 10 °C to 40 °C at 10 °C intervals. Then, the mean value of each gradient of Tleaf was taken as the representative. In addition, the corresponding VPD values of Tleaf were also averaged in each gradient of Tleaf. Finally, the environmental conditions were divided into three levels as I (Tleaf = 18.7 °C and VPD = 1.1 kPa), II (Tleaf = 26.7 °C and VPD = 1.6 kPa) and III (Tleaf = 32.1 °C and VPD = 2.2 kPa). The vertical patterns of the three standardized photosynthetic parameters (SPmax, SRd and Sgs-sat) at the above three levels of environmental conditions (I, II and III) and the non-standardized values were compared in each measured period (Figure 5).
Different gradients of environmental conditions usually showed a significant influence on the SPmax. The SPmax values at level I were, on average, 14.4% and 28.4% greater than those at levels II and III, respectively. The DTBs of Pmax were, on average, 36.7% smaller than those of SPmax under the three environmental conditions (I, II and III) before August (Figure 5(A1–A5)), but then the DTBs of Pmax were, on average, 29.6% greater than those of SPmax under the three environmental conditions (I, II and III) after August (Figure 5(A6–A8)). The mean SRd across the growing seasons at level III was, on average, 3.3 times and 2.0 times greater than those at level I and level II, respectively. The mean DTBs of SRd during the growing season were only 0.23 μmol m−2 s−1, 0.45 μmol m−2 s−1 and 0.70 μmol m−2 s−1 under the three environmental conditions (I, II and III), respectively. Different environmental conditions also had an obvious influence on vertical variations in Sgs-sat. The mean values of Sgs-sat at level I were, on average, 15.3% and 28.2% greater than those at levels II and III, respectively, and the mean DTBs at level I were 30.0% and 65.1% greater than those at levels II and III, respectively, during the growing season.
3.6. Seasonal Evolution of Standardized and Non-Standardized Photosynthetic Parameters during the Growing Season
The seasonal variations in SPmax generally demonstrated a parabolic trend during the growing season at the different RDINC values (Figure 6(A1–A9)), and this seasonal pattern of SPmax became increasingly obvious with the decrease in RDINC, which indicated that the responses of the leaves to phenological phases were usually more sensitive in the upper crown than in the lower crown. Obvious peaks of SPmax were found in early August in the upper crown (RDINC ≤ 0.3), but there was no obvious seasonal variation in the middle and lower crown (RDINC ≥ 0.4). Similar to the analysis of the vertical profiles of SPmax, the seasonal variations in SPmax were also analyzed. The range of SPmax was large in the top of the crown, but the phenomenon weakened with the increase in RDINC. The seasonal patterns of non-standardized Pmax were significantly different from those of SPmax, especially in the upper part of the crown (RDINC ≤ 0.5), e.g., the ranges of Pmax were, on average, 2.4 times greater than those of SPmax, but the seasonal variations in Pmax in the lower part of the crown (RDINC ≤ 0.5) were not much different from those of SPmax, which was probably associated with the small values and weak variations in SPmax among the different phenological phases (Figure 6(A6–A9)). SRd also exhibited a concave seasonal variation in contrast with SPmax, but the range of variation was obviously smaller than that of SPmax (Figure 6(B1–B9)). The seasonal variations in Rd were irregular, though there were weak negative correlations with the date of the year (DOY), which appeared when the RDINC was 0.4 (Figure 6(B4)). Sgs-sat also exhibited a parabolic seasonal pattern similar to that of SPmax, but the phenomenon weakened with the increase in RDINC. At the bottom of the crown, the Sgs-sat was almost invariable during the growing season (Figure 6(C9)). Non-standardized gs-sat exhibited a positive linear correlation with DOY during the growing season, which was different from Sgs-sat.
3.7. The Response of Seasonal Evolutions of Standardized Photosynthetic Parameters to the Different Gradients of Environmental Conditions
Different gradients of environmental conditions usually showed a significant influence on the seasonal patterns of photosynthetic parameters. For example, the range of SPmax was 7.15 μmol m−2 s−1, 6.27 μmol m−2 s−1 and 5.61 μmol m−2 s−1 at levels I, II and III, respectively, at the top of the crown (Figure 6(A1)), but then these values dropped to 1.37 μmol m−2 s−1, 1.21 μmol m−2 s−1 and 1.08 μmol m−2 s−1, respectively, at the bottom of the crown (Figure 6(A9)). The range of SPmax at level I fluctuated more than those at level II and level III. Similarly, different gradients of environmental conditions also significantly influenced the seasonal patterns of SRd. The average range of SRd in the top of the crown was 0.05 μmol m−2 s−1, 0.15 μmol m−2 s−1 and 0.31 μmol m−2 s−1 at levels I, II and III, respectively, which declined with the increasing RDINC to reach 0.01 μmol m−2 s−1, 0.03 μmol m−2 s−1 and 0.60 μmol m−2 s−1, respectively, at the bottom of the crown. The three gradients of environmental conditions strongly influenced the values of Sgs-sat, especially in the upper crown, where the lower temperature and higher humidity were more favorable for gas exchange. However, in the lower crown, the difference in Sgs-sat among levels I, II and III could be ignored.
4. Discussion
4.1. Relationships between Photosynthetic Parameters and Environmental Factors
In our study, the Tleaf demonstrated a parabolic correlation with Pmax (Figure 3a), which was also found in many other studies that focused on different tree species, e.g., Quercus crispula Blume [68], Picea mariana Mill. [76], Pinus cembra L. [77], Eucalyptus crebra F.Muell. [47], Pinus pinea L. [78], Quercus ilex L. and Juniperus oxycedrus L. [79]. The optimal temperature for Pmax was approximately 30 °C (Figure 3a), which was slightly higher than that indicated in other studies [78,80]. This was probably because the highest Pmax values appeared in July and August, whose mean temperatures were significantly higher than those of the other months (Figure 2a). Hikosaka et al. [81] obtained a similar result and found that the optimal temperature of Pmax increased with increasing ambient temperature. VPD exhibited a significant negative correlation with Pmax (Figure 3b), which was associated with the response of gs to the high VPD [81]. This phenomenon was more obvious in the upper crown (not shown), which was presumably because the leaves in the upper crown are more frequently exposed to environmental stresses, and the variations in VPD in the upper crown are more sensitive and larger [51]. Rd exhibited a typical exponential relationship with Tleaf, and the correlation coefficient was as high as 0.69 (Figure 3e), which indicated that Tleaf was the main environmental factor affecting the Rd, though VPD also demonstrated a significant correlation with Rd (Figure 3f). This is in line with other studies [72,73,77,80,82,83,84,85]. gs-sat has been reported to be highly related to Pmax [28], especially in drier periods. The gs-sat was actually the most limiting process to photosynthesis [54]; thus, it generally exhibited a high correlation with Pmax. In our study, the correlation coefficient between gs-sat and Pmax reached 0.76, and gs-sat exhibited similar relationships with Tleaf and VPD to those of Pmax (Figure 3i,j). Higher temperature and VPD usually reduced the gs-sat, which was also the main reason causing the decline of Pmax at high temperatures and VPD values [81,86].
4.2. Relationships between Photosynthetic Parameters and LMA
Our results showed that Pmax demonstrated a significant and positive correlation with LMA (Figure 3d), which is in accordance with previous research [21,22,87]. Bond et al. [11] even simulated the Pmax by a linear regression between Pmax and LMA. In contrast, Han [3] found a negative relationship between Pmax and LMA for Pinus densiflora Seib. et Zuce., which was probably associated with the higher LMA values (greater than 200 g m−2) than those in our study (less than 130 g m−2). Similar results have been reported previously, but most of these reports concerned tall tree species [17,54,80,81], and all of them demonstrated negative relationships between Pmax and LMA. Previous investigations suggested that LMA was closely associated with mesophyll conductivity to carbon dioxide [3,26], which consequently influences leaf photosynthesis [24,27,28]. Therefore, we speculated that the relatively low LMA in our study might not sufficiently limit the mesophyll conductivity to carbon dioxide and further restrict Pmax. In other studies of larch species, the LMA values were similar to our results. Mitamura et al. [88] suggested that the mean LMA of young (16–20 years old) Larix decidua Mill. was approximately 134 g m−2. Fellner et al. [49] and Kurachi et al. [64] also obtained low LMA values (less than 100 g m−2) in studies of young Larix decidua and Larix leptolepis Siebold & Zucc., respectively. Rd has been reported to be positively related to LMA in other studies [72,83,85], but their correlation was usually weaker. Our result also showed a slightly positive correlation between Rd and LMA (r = 0.37, Figure 3g). However, we speculated that the significant correlation between Rd and LMA was not real. This result was probably associated with the stronger correlation between LMA and RDINC (Figure 7a). gs-sat also exhibited a high positive correlation with LMA (Figure 3k) to that of Pmax. In our opinion, stomatal movement is a sensitive response of leaves to changes in the external environment. Thus, the significant correlation between gs-sat and LMA was an indirect relationship that depended on the plasticity of LMA to the environment [89,90,91].
4.3. Standardization of Photosynthetic Parameters
In our study, the high forest density (averagely 2800 trees hm−2) led to an obvious spatial variation in the microenvironment within the crown. In addition, the typical midlatitude continental monsoon climate and mountainous landforms of the experimental area resulted in abrupt and frequent weather variations at diurnal and monthly scales throughout the entire growing seasons (Figure 2). Both of the above conditions made it more difficult to control the environmental conditions at consistent levels among all measurements. Thus, we analyzed the relationships between the major photosynthetic parameters (Pmax, Rd and gs-sat) and environmental factors (Tleaf and VPD), a morphological factor (LMA), the vertical position within the crown (RDINC) and their combinations to determine the rules of leaf photosynthesis response to the above factors. According to the high correlation between Pmax and LMA, VPD and RDINC, the Pmax was estimated by their combinations (Equation (2)), and the R2 value was as high as 0.77 (Table 3), which indicated that the equation fitted Pmax well. Bond et al. [11] suggested that Pmax could be estimated well only by LMA. Similar to the procedure for Pmax, we also established a regression equation for Rd according to the relationships between this value and other factors. As confirmed by many reports, Rd could be estimated well by the exponential function [71,72,73,74]. Some previous studies even reported that Rd could be well estimated only by LMA [84,85]. In our study, Rd exhibited a similar exponential correlation with Tleaf (Figure 3e). Furthermore, we found that Rd also exhibited significant correlations with RDINC and LMA (Figure 3h,g). Thus, further reparameterization was conducted by incorporating RDINC and LMA into the exponential function. Finally, Rd was well estimated (R2 = 0.58, Table 3) by the modified exponential function (Equation (5)). As gs-sat was highly correlated with Pmax, gs-sat also exhibited a strong correlation with the combination of LMA, VPD and RDINC (LMA/VPD/RDINC), but their relationship was closer to nonlinear rather than linear. Thus, gs-sat was estimated by a nonlinear form (Equation (3)), and the R2 value was also greater than 0.5 (Table 3). Finally, Pmax, Rd and gs-sat were standardized into SPmax, SRd and Sgs-sat, respectively, when the spatial and seasonal variations were analyzed to avoid the influence of the changeable environment.
4.4. Spatial Variation in Standardized Leaf Photosynthetic Parameters
Our results reported above illustrated that SPmax decreased obviously from treetop to bottom (Figure 5(A1–A9)), which is consistent with other studies [1,4,11,65,73]. The SRd was also negatively correlated with RDINC (Figure 5(B1–B8)), as already documented for different species [1,27,52,65,83,92]. The vertical patterns of both SPmax and SRd indicated that the metabolic capacity was higher in the upper crown than in the lower crown [72]. The vertical patterns of SPmax and SRd were similar to the vertical distribution of PAR (Figure 7b), which further indicated that light acclimation plays an important role in the vertical variation of photosynthesis in short trees. Different gradients of environmental conditions obviously influenced the vertical patterns of SPmax and SRd. The DTBs of SPmax and Sgs-sat were respectively reduced by 21.6% and 38.9% on average when the environmental conditions varied from level I (Tleaf = 18.7 °C and VPD = 1.1 kPa) to level III (Tleaf = 32.1 °C and VPD = 2.2 kPa) (Figure 5A), but the DTB of SRd increased by 1.6-fold on average with the same change in environmental conditions (Figure 5B). The pronounced differences in the vertical patterns of SPmax and SRd among the different gradients of environmental conditions implied that focusing on only a single environmental condition could not accurately reveal the vertical rules of SPmax, SRd and Sgs-sat in all environmental gradients. The vertical patterns of SPmax also exhibited obvious seasonal variations under the same environmental conditions. The DTB was smaller in the early leaf-expansion period (Figure 5(A1)), then increased during the leaf-expanding period (Figure 5(A1–A5)), and finally tended to remain stable. This reflected that the photosynthetic capacity in the upper crown usually increased faster than that in the lower crown during the growing season. The vertical patterns of SRd also demonstrated obvious differences among the different periods, and the DTB declined as the growth season progressed. The difference in SRd among different environmental conditions was 0.58 μmol m−2 s−1 on average across the growing seasons, which was slightly greater than that among different vertical positions (0.46 μmol m−2 s−1 on average). This implied that environmental conditions and vertical position within the crown were both main factors influencing the SRd. The seasonal difference of the vertical patterns of Sgs-sat was similar to that of SPmax, but the difference among different environmental conditions was much smaller in the bottom of the crown than in the top of the crown. In summary, the vertical patterns of the unstandardized photosynthetic indicators were significantly different from the standardized photosynthetic indicators, which indicated that standardization is important before analyzing the vertical variation in photosynthesis. In addition, the obvious difference in the vertical patterns of standardized photosynthetic indicators among different growing periods implied that the phenological phase should also be considered when analyzing the vertical variation in photosynthesis.
4.5. Seasonal Variations in Standardized Leaf Photosynthetic Parameters
In this study, the seasonal variation in SPmax generally demonstrated a similar parabolic profile during the growing season (Figure 6(A1–A9)), in accordance with previous reports [26,31,32,33,56,72,76,87,93]. At the leaf-spreading phase, the increasing SPmax was the result of a gradual increase in photosynthetic capacity [32]. However, during the leaf senescence phase, the decreasing SPmax was associated with the decrease in mesophyll conductivity to carbon dioxide caused by increasing sizes of chloroplasts, starch granules and plastoglobuli [26] and the resorption of nitrogen [93]. The highest SPmax value appeared in early August, which was accompanied by a recovery of soil moisture (VWC) from very low values (16.7%, Figure 2d). Thus, we speculate that a short-term drought may cause a sharp rebound of leaf physiological properties when the drought disappears. Similar results have also been reported in other studies [32,38,80]. The changes in seasonal patterns with RDINC indicated that the response of SPmax to the growing period was more sensitive in the upper crown than in the lower crown. Different gradients of VPD also led to different responses of SPmax to growing periods, and lower VPD usually caused more abrupt seasonal variations in SPmax than did high VPD.
Previous research has suggested that the seasonal variation in Rd is mainly driven by the seasonal patterns of temperature and LMA [72,83,84]. It is well known that starch and soluble sugars are the main reactants of the respiratory process; thus, their contents directly impact respiration. At the same time, temperature also indirectly limited respiration by affecting the activities of enzymes that participate in respiration. However, in the early period of leaf expansion, Rd generally exhibited the highest value across the entire growing season, which was not mainly dependent on temperature and LMA [94]. It has been confirmed that the reduction of the leaf-expansion phase is due to the decrease in cytochrome mediation [95]. The seasonal patterns of SRd were close to a concave curve in the upper crown when the environmental condition was at level I (Figure 6(B1–B4)), which followed a similar trajectory to those found in other investigations [92,94,96]. However, in the middle and lower crown, the seasonal variations in SRd were not significant (Figure 6(B5–B9)), which indicated that the response of SRd to the growing period was more sensitive in the upper crown than in the lower crown. When the environmental condition was at level II and level III, the seasonal variations in SRd were weaker than that at level I. The different seasonal variations of SRd under different environments further reflected that a single environmental condition could not accurately reveal the seasonal rules of SRd across all environmental gradients. Sgs-sat usually exhibited similar seasonal patterns to those of SPmax [8] because they were highly correlated. However, Sgs-sat demonstrated a more sensitive response to the different environmental conditions in the top of the crown but was very insensitive in the lower crown. This result was probably caused by the acclimatization of needles in the different microenvironments [51]. The seasonal patterns of all of the photosynthetic indicators gradually weakened with the increase in RDINC, which indicated that the vertical difference should also be considered when analyzing the seasonal variations in photosynthesis.
5. Conclusions
In our study, Pmax, Rd and gs-sat were standardized to SPmax, SRd and Sgs-sat according to the relationships between them and with representative environmental factors (Tleaf and VPD), a morphological characteristic (LMA) and the spatial index (RDINC). For Larix olgensis, SPmax, SRd and Sgs-sat exhibited a similar vertical pattern that decreased with the increase in RDINC. The vertical differences in SPmax and Sgs-sat became more obvious after the needles fully expanded, but the vertical differences in SRd did not vary significantly with the growing phases. The seasonal patterns of SPmax and Sgs-sat tended to be parabolic, and this tendency was more obvious in the upper crown. By contrast, the seasonal pattern of SRd was a concave curve. Both of the spatial and seasonal variations exhibited significant differences among different gradients of environmental conditions. Under the condition of high temperature and low humidity, the photosynthesis of needles was generally inhibited; however, the condition of high temperature is usually beneficial to the respiration. This may explain the common phenomenon of midday depression of photosynthesis. In addition, this phenomenon was more obvious in the top of the crown. These results implied that a single environmental condition could not accurately reveal the spatial or seasonal rules of all gradients of environmental conditions. Thus, standardization was necessary before analyzing the spatial and seasonal variations in photosynthesis. Neither the spatial pattern nor the seasonal pattern of the photosynthetic indicators was static, and they were closely related to each other. Thus, we suggest that the spatial and seasonal variations in photosynthetic indicators should be analyzed at the same time.
Author Contributions
Q.L. undertook data analysis and wrote most of the paper. F.L. supervised and coordinated the research paper, designed and installed the experiment, made some measurements, and contributed to the writing of the paper.
Funding
This research was financially supported by the National Key R & D Program of China (No. 2017YFD0600402).
Acknowledgments
The authors would like to thank Xiankui Quan for valuable advice and Xingchang Wang, Longfei Xie, Xiang Li, Fanlin Kong and Yibo Sun who provided and collected the data for this study. We would like to express our appreciation to three anonymous reviewers for their constructive comments on the manuscript.
Conflicts of Interest
The authors declare no conflict of interest.
References
- O’Grady, A.P.; Worledge, D.; Wilkinson, A.; Battaglia, M. Photosynthesis and respiration decline with light intensity in dominant and suppressed Eucalyptus globulus canopies. Funct. Plant Biol. 2008, 35, 439–447. [Google Scholar] [CrossRef]
- Cavaleri, M.A.; Oberbauer, S.F.; Clark, D.B.; Clark, D.A.; Ryan, M.G. Height is more important than light in determining leaf morphology in a tropical forest. Ecology 2010, 91, 1730–1739. [Google Scholar] [CrossRef] [PubMed]
- Han, Q.M. Height-related decreases in mesophyll conductance, leaf photosynthesis and compensating adjustments associated with leaf nitrogen concentrations in Pinus densiflora. Tree Physiol. 2011, 31, 976–984. [Google Scholar] [CrossRef] [PubMed]
- Kosugi, Y.; Takanashi, S.; Yokoyama, N.; Kamakura, M. Vertical variation in leaf gas exchange parameters for a Southeast Asian tropical rainforest in Peninsular Malaysia. J. Plant Res. 2012, 125, 735–748. [Google Scholar] [CrossRef] [PubMed]
- Leuning, R.; Kelliher, F.M.; De Pury, D.G.G.; Schulze, E.D. Leaf nitrogen, photosynthesis, conductance and transpiration: Scaling from leaves to canopies. Plant Cell Environ. 1995, 18, 1183–1200. [Google Scholar] [CrossRef]
- Oliver, C.D.; Larson, B.C. Forest Stand Dynamics; John Wiley & sons, Inc.: New York, NY, USA, 1996. [Google Scholar]
- Li, F.R.; Wang, Z.F.; Wang, B.S. Studies on the effective crown development of Larix olgensis (I)—determination of the effective crown. J. Northeast For. Univ. 1996, 24, 1–8. (In Chinese) [Google Scholar]
- Xu, L.; Baldocchi, D.D. Seasonal trends in photosynthetic parameters and stomatal conductance of blue oak (Quercus douglasii) under prolonged summer drought and high temperature. Tree Physiol. 2003, 23, 865–877. [Google Scholar] [CrossRef] [PubMed]
- Lam, F.; Barrett, J.D.; Nakajima, S. Influence of knot area ratio on the bending strength of Canadian Douglas fir timber used in Japanese post and beam housing. J. Wood Sci. 2005, 51, 18–25. [Google Scholar] [CrossRef]
- Bond, B.J.; Farnsworth, B.T.; Coulombe, R.A.; Winner, W.E. Foliage physiology and biochemistry in response to light gradients in conifers with varying shade tolerance. Oecologia 1999, 120, 183–192. [Google Scholar] [CrossRef] [PubMed]
- Borghetti, M.; Vendramin, G.G.; Giannini, R. Specific leaf area and leaf area index distribution in a young Douglas. Can. J. For. Res. 1986, 16, 1283–1288. [Google Scholar] [CrossRef]
- Cescatti, A.; Zorer, R. Structural acclimation and radiation regime of silver fir (Abies alba Mill.) shoots along a light gradient. Plant Cell Environ. 2003, 26, 429–442. [Google Scholar] [CrossRef]
- Wyka, T.P.; Oleksyn, J.; Żytkowiak, R.; Karolewski, P.; Jagodziński, A.M.; Reich, P.B. Responses of leaf structure and photosynthetic properties to intra-canopy light gradients: A common garden test with four broadleaf deciduous angiosperm and seven evergreen conifer tree species. Oecologia 2012, 170, 11–24. [Google Scholar] [CrossRef] [PubMed]
- Coble, A.P.; Cavaleri, M.A. Light drives vertical gradients of leaf morphology in a sugar maple (Acer saccharum) forest. Tree Physiol. 2014, 34, 146–158. [Google Scholar] [CrossRef] [PubMed]
- Bond, B.J. Age-related changes in photosynthesis of woody plants. Trends Plant Sci. 2000, 5, 349–353. [Google Scholar] [CrossRef]
- Ishii, H.; Ford, E.D.; Boscolo, M.E.; Manriquez, A.C.; Wilson, M.E.; Hinckley, T.M. Variation in specific needle area of old-growth Douglas-fir in relation to needle age, within-crown position and epicormic shoot production. Tree Physiol. 2002, 22, 31–40. [Google Scholar] [CrossRef] [PubMed] [Green Version]
- Koch, G.W.; Sillett, S.C.; Jennings, G.M.; Davis, S.D. The limits to tree height. Nature 2004, 428, 851–854. [Google Scholar] [CrossRef] [PubMed] [Green Version]
- Oldham, A.R.; Sillett, S.C.; Tomescu, A.M.F.; Koch, G. The hydrostatic gradient, not light availability, drives height-related variation in Sequoia sempervirens (Cupressaceae) leaf anatomy. Am. J. Bot. 2010, 97, 1087–1097. [Google Scholar] [CrossRef] [PubMed]
- Coble, A.P.; Vanderwall, B.; Mau, A.; Cavaleri, M. How vertical patterns in leaf traits shift seasonally and the implications for modeling canopy photosynthesis in a temperate deciduous forest. Tree Physiol. 2016, 36, 1077–1091. [Google Scholar] [CrossRef] [PubMed]
- Field, C. Allocating leaf nitrogen for the maximization of carbon gain: Leaf age as a control on the allocation program. Oecologia 1983, 56, 341–347. [Google Scholar] [CrossRef] [PubMed]
- Kenzo, T.; Ichie, T.; Watanabe, Y.; Yoneda, R.; Ninomiya, I.; Koike, T. Changes in photosynthesis and leaf characteristics with tree height in five dipterocarp species in a tropical rain forest. Tree Physiol. 2006, 26, 865–873. [Google Scholar] [CrossRef] [PubMed] [Green Version]
- Meinzer, F.C.; Bond, B.J.; Karanian, J.A. Biophysical constraints on leaf expansion in a tall conifer. Tree Physiol. 2008, 28, 197–206. [Google Scholar] [CrossRef] [PubMed] [Green Version]
- Woodruff, D.R.; Meinzer, F.C.; Lachenbruch, B.; Johnson, D.M. Coordination of leaf structure and gas exchange along a height gradient in a tall conifer. Tree Physiol. 2009, 29, 261–272. [Google Scholar] [CrossRef] [PubMed]
- Woodruff, D.R. The impacts of water stress on phloem transport in Douglas-fir trees. Tree Physiol. 2014, 34, 5–14. [Google Scholar] [CrossRef] [PubMed]
- Benomar, L.; DesRochers, A.; Larocque, G.R. Changes in specific leaf area and photosynthetic nitrogen-use efficiency associated with physiological acclimation of two hybrid poplar clones to intraclonal competition. Can. J. For. Res. 2011, 41, 1465–1476. [Google Scholar] [CrossRef]
- Riikonen, J.; Oksanen, E.; Peltonen, P.; Holopainen, T.; Vapaavuori, E. Seasonal variation in physiological characteristics of two silver birch clones in the field. Can. J. For. Res. 2003, 33, 2164–2176. [Google Scholar] [CrossRef]
- Mullin, L.P.; Sillett, S.C.; Koch, G.; Tu, K.; Antoine, M.E. Physiological consequences of height-related morphological variation in Sequoia sempervirens foliage. Tree Physiol. 2009, 29, 1–12. [Google Scholar] [CrossRef] [PubMed]
- Flexas, J.; Barbour, M.M.; Brendel, O.; Cabrera, H.M.; Carriquí, M.; Díaz-Espejo, A.; Douthe, C.; Dreyer, E.; Ferrio, J.P.; Gago, J.; et al. Mesophyll diffusion conductance to CO2: An unappreciated central player in photosynthesis. Plant Sci. 2012, 193, 70–84. [Google Scholar] [CrossRef] [PubMed] [Green Version]
- Grassi, G.; Vicinelli, E.; Ponti, F.; Cantoni, L.; Magnani, F. Seasonal and interannual variability of photosynthetic capacity in relation to leaf nitrogen in a deciduous forest plantation in northern Italy. Tree Physiol. 2005, 25, 349–360. [Google Scholar] [CrossRef] [PubMed] [Green Version]
- Strand, M.; Lundmark, T.; Söderbergh, I.; Mellander, P.E. Impacts of seasonal air and soil temperatures on photosynthesis in Scots pine trees. Tree Physiol. 2002, 22, 839–847. [Google Scholar] [CrossRef] [PubMed] [Green Version]
- Awada, T.; Radoglou, K.; Fotelli, M.N.; Constantinidou, H.I.A. Ecophysiology of seedlings of three Mediterranean pine species in contrasting light regimes. Tree Physiol. 2003, 23, 33–41. [Google Scholar] [CrossRef] [PubMed] [Green Version]
- Letts, M.G.; Phelan, C.A.; Johnson, D.R.E.; Rood, S. Seasonal photosynthetic gas exchange and leaf reflectance characteristics of male and female cottonwoods in a riparian woodland. Tree Physiol. 2008, 28, 1037–1048. [Google Scholar] [CrossRef] [PubMed] [Green Version]
- Wyka, T.P.; Żytkowiak, R.; Oleksyn, J. Seasonal dynamics of nitrogen level and gas exchange in different cohorts of Scots pine needles: A conflict between nitrogen mobilization and photosynthesis? Eur. J. For. Res. 2016, 135, 483–493. [Google Scholar] [CrossRef]
- Misson, L.; Tu, K.P.; Boniello, R.A.; Goldstein, A.H. Seasonality of photosynthetic parameters in a multi-specific and vertically complex forest ecosystem in the Sierra Nevada of California. Tree Physiol. 2006, 26, 729–741. [Google Scholar] [CrossRef] [PubMed] [Green Version]
- Nouvellon, Y.; Laclau, J.P.; Epron, D.; Kinana, A.; Mabiala, A.; Roupsard, O.; Bonnefond, J.M.; Maire, G.I.; Marsden, C.; Bontemps, J.D.; et al. Within-stand and seasonal variations of specific leaf area in a clonal Eucalyptus, plantation in the Republic of Congo. For. Ecol. Manag. 2010, 259, 1796–1807. [Google Scholar] [CrossRef]
- Li, J.Y.; Ou-lee, T.M.; Raba, R.; Amundson, R.G.; Last, R.L. Arabidopsis flavonoid mutants are hypersensitive to UV-B irradiation. Plant Cell 1993, 5, 171–179. [Google Scholar] [CrossRef] [PubMed]
- Coble, A.P.; Cavaleri, M.A. Light acclimation optimizes leaf functional traits despite height-related constraints in a canopy shading experiment. Oecologia 2015, 177, 1131–1143. [Google Scholar] [CrossRef] [PubMed]
- Pardos, M.; Puértolas, J.; Madrigal, G.; Garriga, E.; Blas, S.D.; Calama, R. Seasonal changes in the physiological activity of regeneration under a natural light gradient in a Pinus pinea regular stand. For. Syst. 2010, 19, 367–380. [Google Scholar] [CrossRef]
- Craven, D.; Dent, D.; Braden, D.; Ashton, M.S.; Berlyn, G.P.; Hall, J.S. Seasonal variability of photosynthetic characteristics influences growth of eight tropical tree species at two sites with contrasting precipitation in Panama. For. Ecol. Manag. 2011, 261, 1643–1653. [Google Scholar] [CrossRef]
- Li, C.; Xu, G.; Zang, R.; Korpelainen, H.; Berninger, F. Sex-related differences in leaf morphological and physiological responses in Hippophae rhamnoides along an altitudinal gradient. Tree Physiol. 2007, 27, 399–406. [Google Scholar] [CrossRef] [PubMed]
- Wilson, K.B.; Baldocchi, D.D.; Hanson, P.J. Leaf age affects the seasonal pattern of photosynthetic capacity and net ecosystem exchange of carbon in a deciduous forest. Plant Cell Environ. 2001, 24, 571–583. [Google Scholar] [CrossRef]
- Tanaka, K.; Kosugi, Y.; Nakamura, A. Impact of leaf physiological characteristics on seasonal variation in CO2, latent and sensible heat exchanges over a tree plantation. Agric. For. Meteorol. 2002, 114, 103–122. [Google Scholar] [CrossRef]
- Kosugi, Y.; Shibata, S.; Kobashi, S. Parameterization of the CO2 and H2O gas exchange of several temperate deciduous broad-leaved trees at the leaf scale considering seasonal changes. Plant Cell Environ. 2003, 26, 285–301. [Google Scholar] [CrossRef]
- Esprey, L.J.; Sands, P.J.; Smith, C.W. Understanding of 3-PG using a sensitivity analysis. For. Ecol. Manag. 2004, 193, 235–250. [Google Scholar] [CrossRef]
- Stape, J.L.; Ryan, M.G.; Binkley, D. Testing the utility of the 3-PG model for growth of Eucalyptus grandis × urophylla with natural and manipulated supplies of water and nutrients. For. Ecol. Manag. 2004, 193, 219–234. [Google Scholar] [CrossRef]
- Davidson, R.; Mauffette, Y.; Gagnon, D. Light requirements of seedlings: A method for selecting tropical trees for plantation forestry. Basic Appl. Ecol. 2002, 3, 209–220. [Google Scholar] [CrossRef]
- Lin, Y.S.; Medlyn, B.E.; Ellsworth, D.S. Temperature responses of leaf net photosynthesis: The role of component processes. Tree Physiol. 2012, 32, 219–231. [Google Scholar] [CrossRef] [PubMed]
- Craven, D.; Braden, D.; Ashton, M.S.; Berlyn, G.P.; Wishnie, M.; Dent, D. Between and within-site comparisons of structural and physiological characteristics and foliar nutrient content of 14 tree species at a wet, fertile site and a dry, infertile site in Panama. For. Ecol. Manag. 2007, 238, 335–346. [Google Scholar] [CrossRef]
- Fellner, H.; Dirnberger, G.F.; Sterba, H. Specific leaf area of European Larch (Larix decidua Mill.). Trees 2016, 30, 1237–1244. [Google Scholar] [CrossRef] [PubMed]
- Bauerle, W.L.; Oren, R.; Way, D.A.; Qian, S.S.; Stoy, P.C.; Thornton, P.E.; Bowden, J.D.; Hoffman, F.M.; Reynolds, R.F. Photoperiodic regulation of the seasonal pattern of photosynthetic capacity and the implications for carbon cycling. Proc. Nat. Acad. Sci. USA 2012, 109, 8612–8617. [Google Scholar] [CrossRef] [PubMed] [Green Version]
- Han, Q.; Kawasaki, T.; Katahata, S.; Mukai, Y.; Chiba, Y. Horizontal and vertical variations in photosynthetic capacity in a Pinus densiflora crown in relation to leaf nitrogen allocation and acclimation to irradiance. Tree Physiol. 2003, 23, 851–857. [Google Scholar] [CrossRef] [PubMed]
- Ambrose, A.R.; Sillett, S.C.; Dawson, T.E. Effects of tree height on branch hydraulics, leaf structure and gas exchange in California redwoods. Plant Cell Environ. 2009, 32, 743–757. [Google Scholar] [CrossRef] [PubMed] [Green Version]
- Rascher, U.; Bobich, E.G.; Lin, G.H.; Walter, A.; Morris, T.J.; Naumann, M.; Nichol, C.J.; Pierce, D.; Bil, K.; Kudeyarov, V.N.; et al. Functional diversity of photosynthesis during drought in a model tropical rainforest—the contributions of leaf area, photosynthetic electron transport and stomatal conductance to reduction in net ecosystem carbon exchange. Plant Cell Environ. 2004, 27, 1239–1256. [Google Scholar] [CrossRef]
- Broeckx, L.S.; Fichot, R.; Verlinden, M.S.; Ceulemans, R. Seasonal variations in photosynthesis, intrinsic water-use efficiency and stable isotope composition of poplar leaves in a short-rotation plantation. Tree Physiol. 2014, 34, 701–715. [Google Scholar] [CrossRef] [PubMed] [Green Version]
- Franco, A.C. Seasonal patterns of gas exchange, water relations and growth of Roupala montana, an evergreen savanna species. Plant Ecol. 1998, 136, 69–76. [Google Scholar] [CrossRef]
- Corcuera, L.; Morales, F.; Abadía, A.; Pelegrín, G. Seasonal changes in photosynthesis and photoprotection in a Quercus ilex subsp. ballota woodland located in its upper altitudinal extreme in the Iberian Peninsula. Tree Physiol. 2005, 25, 599–608. [Google Scholar] [PubMed]
- Zhu, J.J.; Liu, Z.G.; Wang, H.X.; Yan, Q.L.; Fang, H.Y.; Hu, L.; Yu, L.Z. Effects of site preparation on emergence and early establishment of Larix olgensis, in montane regions of northeastern China. New For. 2008, 36, 247–260. [Google Scholar] [CrossRef]
- Wei, H.X.; Xu, C.Y.; Hawkins, B.J.; Ma, L.; Jiang, L. Organic amendment and inorganic fertilization affect soil properties and quality of Larix olgensis bareroot stock. New For. 2012, 43, 155–168. [Google Scholar] [CrossRef]
- Zhu, Y.; Dumroese, R.K.; Pinto, J.R.; Li, G.L.; Liu, Y. Fall fertilization enhanced nitrogen storage and translocation in Larix olgensis, seedlings. New For. 2013, 44, 849–861. [Google Scholar] [CrossRef]
- Eguchi, N.; Fukatsu, E.; Funada, R.; Tobita, H.; Kitao, M.; Maruyama, Y.; Koike, T. Changes in morphology, anatomy, and photosynthetic capacity of needles of Japanese Larch (Larix kaempferi) seedlings grown in high CO2 concentrations. Photosynthetica 2004, 42, 173–178. [Google Scholar] [CrossRef]
- Mao, Q.Z.; Watanabe, M.; Imori, M.; Kim, Y.S.; Kita, K.; Koike, T. Photosynthesis and nitrogen allocation in needles in the sun and shade crowns of hybrid larch saplings: Effect of nitrogen application. Photosynthetica 2012, 50, 422–428. [Google Scholar] [CrossRef]
- Wang, W.J.; Watanabe, Y.; Endo, I.; Kitaoka, S.; Koike, T. Seasonal changes in the photosynthetic capacity of cones on a larch (Larix kaempferi) canopy. Photosynthetica 2006, 44, 345–348. [Google Scholar] [CrossRef]
- Galvagno, M.; Rossini, M.; Migliavacca, M.; Cremonese, E.; Colombo, R.; Morra-di-Cella, U. Seasonal course of photosynthetic efficiency in Larix decidua Mill. in response to temperature and change in pigment composition during senescence. Int. J. Biometeorol. 2013, 57, 871–880. [Google Scholar] [CrossRef] [PubMed]
- Kurachi, N.; Hagihara, A.; Hozumi, K. Canopy photosynthetic production in a Japanese larch stand. I. Seasonal and vertical changes of leaf characteristics along the light gradient in a canopy. Ecol. Res. 1992, 7, 255–265. [Google Scholar] [CrossRef]
- Liu, Q.; Dong, L.H.; Li, F.R.; Li, X. Spatial heterogeneity of canopy photosynthesis for Larix olgensis. Chin. J. Appl. Ecol. 2016, 27, 2789–2796. (In Chinese) [Google Scholar]
- Wu, C.; Wang, Z.X.; Sun, H.L.; Guo, S.L. Effects of different concentrations of Nitrogen and Phosphorus on Chlorophyll Biosynthesis, Chlorophyll a Fluorescence, and Photosynthetic Rate in Larix olgensis seedlings. Sci. Silv. Sin. 2005, 41, 31–36. (In Chinese) [Google Scholar]
- Zhao, X.Z.; Jiang, H.F.; Mao, Z.J. The studies of the photosynthetic characteristics of Larix olgensis Herry., Larix kaempferi Carr. and Larix gmelinii Rupr. seedlings. Bull. Bot. Res. 2007, 27, 361–366. (In Chinese) [Google Scholar]
- Luca, T.H.D. Relationship of 0.5 M K2SO4 extractable anthrone-reactive carbon to indices of microbial activity in forest soils. Soil Biol. Biochem. 1998, 30, 1293–1299. [Google Scholar] [CrossRef]
- Cluzeau, C.; Goff, N.L.; Ottorini, J.M. Development of primary branches and crown profile of Fraxinus excelsior. Can. J. For. Res. 1994, 24, 2315–2323. [Google Scholar] [CrossRef]
- Bassman, J.H.; Zwier, J.C. Gas exchange characteristics of Populus trichocarpa, Populus deltoides and Populus trichocarpa × P. deltoids clones. Tree Physiol. 1991, 8, 145–159. [Google Scholar] [CrossRef] [PubMed]
- Lloyd, J.; Taylor, J.A. On the Temperature dependence of soil respiration. Funct. Ecol. 1994, 8, 315–323. [Google Scholar] [CrossRef]
- Rodríguez-calcerrada, J.; Atkin, O.K.; Robson, T.M.; Zaragoza-castells, J.; Gil, L.; Aranda, I. Thermal acclimation of leaf dark respiration of beech seedlings experiencing summer drought in high and low light environments. Tree Physiol. 2010, 30, 214–224. [Google Scholar] [CrossRef] [PubMed]
- Weerasinghe, L.K.; Creek, D.; Crous, K.Y.; Xiang, S.; Liddell, M.J.; Turnbull, M.H.; Atkin, O.K. Canopy position affects the relationships between leaf respiration and associated traits in a tropical rainforest in Far North Queensland. Tree Physiol. 2014, 34, 564–584. [Google Scholar] [CrossRef] [PubMed] [Green Version]
- Meyer, N.; Meyer, H.; Welp, G.; Amelung, W. Soil respiration and its temperature sensitivity (Q10): Rapid acquisition using mid-infrared spectroscopy. Geoderma 2018, 323, 31–40. [Google Scholar] [CrossRef]
- Sage, R.F.; Kubien, D.S. The temperature response of C3 and C4 photosynthesis. Plant Cell Environ. 2007, 30, 1086–1106. [Google Scholar] [CrossRef] [PubMed]
- Way, D.A.; Sage, R.F. Thermal acclimation of photosynthesis in black spruce [Picea mariana (Mill.) B.S.P.]. Plant Cell Environ. 2008, 31, 1250–1262. [Google Scholar] [CrossRef] [PubMed]
- Wieser, G.; Oberhuber, W.; Walder, L.; Spieler, D.; Gruber, A. Photosynthetic temperature adaptation of Pinus cembra, within the timberline ecotone of the Central Austrian Alps. Ann. For. Sci. 2010, 67, 201. [Google Scholar] [CrossRef] [PubMed]
- Calama, R.; Puértolas, J.; Madrigal, G.; Pardos, M. Modeling the environmental response of leaf net photosynthesis in Pinus pinea L. natural regeneration. Ecol. Model. 2013, 251, 9–21. [Google Scholar] [CrossRef]
- Mayoral, C.; Calama, R.; Sánchez-González, M.; Pardos, M. Modelling the influence of light, water and temperature on photosynthesis in young trees of mixed Mediterranean forests. New For. 2015, 46, 485–506. [Google Scholar] [CrossRef]
- Lloyd, J.; Farquhar, G.D. Effects of rising temperatures and [CO2] on the physiology of tropical forest trees. Phil. Trans. Biol. Sci. 2008, 363, 1811–1817. [Google Scholar] [CrossRef] [PubMed]
- Hikosaka, K.; Nabeshima, E.; Hiura, T. Seasonal changes in the temperature response of photosynthesis in canopy leaves of Quercus crispula in a cool-temperate forest. Tree Physiol. 2007, 27, 1035–1041. [Google Scholar] [CrossRef] [PubMed]
- Tjoelker, M.G.; Oleksyn, J.; Reich, P.B. Modelling respiration of vegetation: Evidence for a general temperature-dependent Q10. Glob. Chang. Biol. 2001, 7, 223–230. [Google Scholar] [CrossRef]
- Griffin, K.L.; Tissue, D.T.; Turnbull, M.H.; Schuster, W.; Whitehead, D. Leaf dark respiration as a function of canopy position in Nothofagus fusca trees grown at ambient and elevated CO2 partial pressures for 5 years. Funct. Ecol. 2001, 15, 497–505. [Google Scholar] [CrossRef]
- Griffin, K.L.; Turnbull, M.; Murthy, R. Canopy position affects the temperature response of leaf respiration in Populus deltoides. New Phytol. 2002, 154, 609–619. [Google Scholar] [CrossRef]
- Tissue, D.T.; Lewis, J.D.; Wullschleger, S.D.; Amthor, J.S.; Griffin, K.L.; Anderson, O.R. Leaf respiration in sweetgum (Liquidambar styraciflua) at different canopy positions grown in ambient and elevated CO2 in the field. Tree Physiol. 2002, 22, 1157–1166. [Google Scholar] [CrossRef] [PubMed]
- Lewis, J.D.; Lucash, M.; Olszyk, D.; Tingey, D.T. Seasonal patterns of photosynthesis in Douglas-fir seedlings during the third and fourth year of exposure to elevated CO2, and temperature. Plant Cell Environ. 2001, 24, 539–548. [Google Scholar] [CrossRef]
- Sperlich, D.; Chang, C.T.; Penuelas, J.; Gracia, C.; Sabaté, S. Seasonal variability of foliar photosynthetic and morphological traits and drought impacts in a Mediterranean mixed forest. Tree Physiol. 2015, 35, 501–520. [Google Scholar] [CrossRef] [PubMed] [Green Version]
- Mitamura, M.; Yamamura, Y.; Nakano, T. Large-scale canopy opening causes decreased photosynthesis in the saplings of shade-tolerant conifer, Abies veitchii. Tree Physiol. 2009, 29, 137–145. [Google Scholar] [CrossRef] [PubMed]
- Richardson, A.D.; Berlyn, G.P.; Ashton, P.M.S.; Thadani, R.; Cameron, I.R. Foliar plasticity of hybrid spruce in relation to crown position and stand age. Can. J. Bot. 2000, 78, 305–317. [Google Scholar]
- Zhang, Y.; Zheng, Q.; Tyree, M.T. Factors controlling plasticity of leaf morphology in Robinia pseudoacacia L. I: Height-associated variation in leaf structure. Ann. For. Sci. 2012, 69, 29–37. [Google Scholar] [CrossRef]
- Zhang, Y.X.; Equiza, M.A.; Zheng, Q.S.; Tyree, M.T. Factors controlling plasticity of leaf morphology in Robinia pseudoacacia L. II: The impact of water stress on leaf morphology of seedlings grown in a controlled environment chamber. Ann. For. Sci. 2012, 69, 39–47. [Google Scholar] [CrossRef]
- Xu, C.Y.; Griffin, K.L. Seasonal variation in the temperature response of leaf respiration in Quercus rubra: Foliage respiration and leaf properties. Funct. Ecol. 2006, 20, 778–789. [Google Scholar] [CrossRef]
- Yuko, Y.; Kouki, H.; Tadaki, H. Seasonal changes in photosynthesis, nitrogen content and nitrogen partitioning in Lindera umbellata leaves grown in high or low irradiance. Tree Physiol. 2006, 26, 1315–1323. [Google Scholar]
- Radoglou, K.; Teskey, R.O. Changes in rates of photosynthesis and respiration during needle development of loblolly pine. Tree Physiol. 1997, 17, 485–488. [Google Scholar] [CrossRef] [PubMed] [Green Version]
- Collier, D.E.; Thibodeau, B.A. Changes in respiration and chemical content during autumnal senescence of Populus tremuloides and Quercus rubra leaves. Tree Physiol. 1995, 15, 759–764. [Google Scholar] [CrossRef] [PubMed]
- Vose, J.M.; Ryan, M.G. Seasonal respiration of foliage, fine roots, and woody tissues in relation to growth, tissue N, and photosynthesis. Glob. Chang. Biol. 2010, 8, 182–193. [Google Scholar] [CrossRef]
Figure 1.
Positions of needle cluster samples within the crown. (a) Comparison between the PLR curve in the middle of the foliated branch and the average PLR curve throughout the entire foliated branch. Pn and PAR represent the net photosynthetic rate (μmol m−2 s−1) and the photosynthetically active radiation (μmol m−2 s−1), respectively; unfilled circles represent the PLR curve in the middle of the foliated branch, and filled circles represent the mean values of all PLR curves of the branch; and solid bars represent the standard deviation. (b) A diagram of the positions of needle cluster samples within the crown. PLR, photosynthetic light response; PAR, photosynthetically active radiation; Pn, net photosynthetic rate.

Figure 2.
Seasonal course of the main environmental parameters during the period of this study (May–September 2017): (a) daily mean air temperature (mean Tair) and maximum air temperature (max Tair); (b) daily mean relative humidity (mean RH) and minimum relative air humidity (min RH); (c) daily mean vapor pressure deficit (mean VPD) and maximum vapor pressure deficit (max VPD); (d) daily mean soil moisture (mean VWC) and minimum soil moisture (min VWC).

Figure 3.
The relationships: (a–d) between the light-saturated net photosynthetic rate (Pmax) and leaf temperature (Tleaf), vapor pressure deficit (VPD), leaf mass per area (LMA) and relative depth into the crown (RDINC); (e–h) between dark respiration (Rd) and Tleaf, VPD, LMA and RDINC; (i–l) between light-saturated stomatal conductance (gs-sat) and Tleaf, VPD, LMA and RDINC. The r values are Spearman’s correlation coefficients. The solid gray line represents the fitting results based on polynomial equations.

Figure 4.
Relationships between the parameters (c0 and c1) of Equation (4) and the relative depth into the crown (RDINC): (a,b) relationship of c0 and c1 versus RDINC; (c,d) relationship of c0 and c1 versus LMA (leaf mass per area). The r values are Pearson’s correlation coefficients. Solid lines are trend lines.

Figure 5.
Vertical profiles of the standardized and nonstandardized light-saturated net photosynthetic rate (SPmax) (A), dark respiration (SRd) (B) and light-saturated stomatal conductance (Sgs-sat) (C) during the growing season. (1–8) represent eight measurement campaigns from 15th May to 10th September, respectively. Data points represent the mean values (solid bars represent the standard deviation) in each RDINC (relative depth into the crown) and measurement period. Solid lines are trend lines.

Figure 6.
Seasonal evolution of standardized and nonstandardized photosynthetic parameters: (A) light-saturated net photosynthetic rate (SPmax), (B) dark respiration (SRd) and (C) light-saturated stomatal conductance (Sgs-sat) during the growing season. (1–9) represent nine vertical positions within the crown from the relative depth into the crown (RDINC) of 0.1 to 0.9, respectively, at 0.1 intervals. Data points represent the mean values (solid bars represent the standard deviation) in each RDINC and measurement period. Solid lines are trend lines.

Figure 7.
The relationships: (a) between leaf mass per area (LMA) and relative depth into the crown (RDINC) and (b) between photosynthetically active radiation (PAR) and RDINC. The r values are Spearman’s correlation coefficients. The solid gray line represents the fitting results based on polynomial equations.


Table 1.
Attributes of sample plots and corresponding sample trees for Larix olgensis Henry plantation.
Table 1.
Attributes of sample plots and corresponding sample trees for Larix olgensis Henry plantation.
| Sample Trees | Sample Plots | |||||||
|---|---|---|---|---|---|---|---|---|
| Tree NO. | DBH (cm) | H (m) | Plot NO. | Range of DBH (cm) | Range of H (m) | Quadratic Mean Diameter (cm) | Mean H (m) | Stand Density (trees ha−1) |
| I | 10.75 | 10.33 | P1 | 5.0–16.0 | 6.0–12.8 | 9.92 | 9.23 | 2200 |
| II | 11.15 | 10.52 | P2 | 5.3–15.9 | 5.3–13.2 | 10.59 | 10.19 | 2400 |
| III | 10.90 | 10.81 | P3 | 5.2–14.1 | 7.1–10.5 | 9.73 | 9.62 | 3200 |
| IV | 10.80 | 10.35 | P4 | 5.0–16.7 | 5.8–13.0 | 10.13 | 9.63 | 2920 |
| V | 11.69 | 10.80 | P5 | 5.2–16.5 | 6.3–12.7 | 10.92 | 10.3 | 2430 |
Note: Tree NO. = tree number, DBH = diameter at breast height, H = tree height; Plot NO. = plot number.
Table 2.
Descriptive statistics of the photosynthetic parameters, leaf morphology and corresponding environmental conditions.
Table 2.
Descriptive statistics of the photosynthetic parameters, leaf morphology and corresponding environmental conditions.
| RDINC | Statistics | Photosynthetic Parameters | Leaf Morphology | Environmental Conditions | ||||
|---|---|---|---|---|---|---|---|---|
| Pmax (μmol m−2 s−1) | Rd (μmol m−2 s−1) | gs-sat (mol m−2 s−1) | LMA (g m−2) | Tleaf (°C) | VPD (kPa) | PAR (μmol m−2 s−1) | ||
| 0.1–0.2 | Sample number | n = 1299 (99 PLR curves) | n = 104 | |||||
| Mean | 14.67 | 1.48 | 0.25 | 83.61 | 29.62 | 1.74 | 913.85 | |
| Std | 4.9 | 0.6 | 0.13 | 19.47 | 3.33 | 0.66 | 427.96 | |
| Max | 28.77 | 2.93 | 0.61 | 127.53 | 38.15 | 4.05 | 1879.79 | |
| Min | 5.57 | 0.58 | 0.05 | 29.18 | 19.53 | 0.78 | 58.04 | |
| 0.2–0.3 | Sample number | n = 1026 (80 PLR curves) | n = 348 | |||||
| Mean | 11.47 | 1.5 | 0.17 | 74.44 | 30.32 | 2.06 | 836.3 | |
| Std | 3.33 | 0.59 | 0.09 | 15.42 | 2.92 | 0.82 | 472.67 | |
| Max | 18.41 | 2.85 | 0.51 | 108.67 | 39.37 | 4.32 | 1998.87 | |
| Min | 5.23 | 0.31 | 0.04 | 31.07 | 25.07 | 0.97 | 104.9 | |
| 0.3–0.4 | Sample number | n = 953 (73 PLR curves) | n = 1406 | |||||
| Mean | 10.96 | 1.17 | 0.16 | 65.44 | 28.43 | 1.79 | 663.86 | |
| Std | 3.31 | 0.5 | 0.08 | 14.63 | 3.19 | 0.73 | 517.09 | |
| Max | 17.79 | 2.51 | 0.41 | 90.94 | 35.58 | 3.55 | 2006.43 | |
| Min | 4.7 | 0.18 | 0.04 | 26.64 | 19.74 | 0.83 | 14.27 | |
| 0.4–0.5 | Sample number | n = 912 (69 PLR curves) | n = 1910 | |||||
| Mean | 9.9 | 1.03 | 0.14 | 60.4 | 28.53 | 1.77 | 550.91 | |
| Std | 2.53 | 0.52 | 0.07 | 13.99 | 3.42 | 0.79 | 496.74 | |
| Max | 15.02 | 2.15 | 0.3 | 84.9 | 36.07 | 3.64 | 1804.97 | |
| Min | 3.21 | 0.31 | 0.02 | 24.85 | 20.42 | 0.65 | 7.86 | |
| 0.5–0.6 | Sample number | n = 835 (62 PLR curves) | n = 2076 | |||||
| Mean | 8.78 | 0.96 | 0.12 | 56.01 | 27.83 | 1.84 | 444.87 | |
| Std | 2.17 | 0.46 | 0.06 | 12.39 | 3.51 | 0.72 | 465.05 | |
| Max | 13.24 | 2.29 | 0.29 | 75.77 | 34.54 | 3.55 | 1856.4 | |
| Min | 4.41 | 0.19 | 0.03 | 28.85 | 19.71 | 0.67 | 7.45 | |
| 0.6–0.7 | Sample number | n = 802 (61 PLR curves) | n = 2793 | |||||
| Mean | 7.57 | 0.8 | 0.11 | 49.96 | 27.19 | 1.7 | 276.86 | |
| Std | 1.82 | 0.34 | 0.05 | 9.96 | 3.42 | 0.6 | 348.78 | |
| Max | 13.69 | 1.65 | 0.28 | 69.83 | 34.2 | 3.76 | 1781.77 | |
| Min | 4.33 | 0.3 | 0.03 | 29.3 | 18.96 | 0.81 | 6.44 | |
| 0.7–0.8 | Sample number | n = 884 (66 PLR curves) | n = 2841 | |||||
| Mean | 6.79 | 0.75 | 0.1 | 45.17 | 26.91 | 1.66 | 198.29 | |
| Std | 1.91 | 0.36 | 0.04 | 8.73 | 3.42 | 0.55 | 305.57 | |
| Max | 14.87 | 1.91 | 0.24 | 64.23 | 34.2 | 3.33 | 1609.52 | |
| Min | 3.17 | 0.25 | 0.03 | 26.22 | 18.5 | 0.75 | 2.79 | |
| 0.8–0.9 | Sample number | n = 816 (63 PLR curves) | n = 2572 | |||||
| Mean | 6.55 | 0.85 | 0.1 | 40.6 | 26.85 | 1.62 | 119.02 | |
| Std | 1.81 | 0.46 | 0.05 | 7.04 | 3.93 | 0.51 | 230.04 | |
| Max | 11.92 | 2.13 | 0.23 | 54.49 | 33.46 | 3.01 | 1463.72 | |
| Min | 3.47 | 0.2 | 0.03 | 26.86 | 15.45 | 0.64 | 1.54 | |
| 0.9–1.0 | Sample number | n = 907 (67 PLR curves) | n = 2282 | |||||
| Mean | 5.55 | 0.66 | 0.09 | 37.53 | 26.79 | 1.59 | 76.58 | |
| Std | 1.71 | 0.4 | 0.04 | 7 | 3.63 | 0.52 | 180.25 | |
| Max | 10.99 | 1.84 | 0.24 | 58.73 | 34.38 | 3.07 | 1477.64 | |
| Min | 2.1 | 0.17 | 0.03 | 23.98 | 17.8 | 0.64 | 1.04 | |
Note: RDINC is the relative depth into the crown, Pmax is the light-saturated net photosynthetic rate, Rd is the dark respiration rate, gs-sat is the light-saturated stomatal conductance, LMA is the leaf mass per area, Tleaf is the leaf temperature, VPD is the vapor pressure deficit, n is the sample number, Std is the standard deviation, Max is the maximum value, Min is the minimum value. There are no data in the range of RDINC from 0 to 0.1 because this range corresponds to the tip of the tree, and there are no branches in this segment.
Table 3.
Fitting statistics for simulations of Pmax, gs-sat and Rd.
| Photosynthetic Parameters | R2 | RMSE |
|---|---|---|
| Pmax (μmol m−2 s−1) | 0.769 | 2.00 |
| Rd (μmol m−2 s−1) | 0.575 | 0.37 |
| gs-sat (mol m−2 s−1) | 0.546 | 0.06 |
R2, coefficient of determination; RMSE, the root mean square error.
© 2018 by the authors. Licensee MDPI, Basel, Switzerland. This article is an open access article distributed under the terms and conditions of the Creative Commons Attribution (CC BY) license (http://creativecommons.org/licenses/by/4.0/).
Share and Cite
MDPI and ACS Style
Liu, Q.; Li, F. Spatial and Seasonal Variations of Standardized Photosynthetic Parameters under Different Environmental Conditions for Young Planted Larix olgensis Henry Trees. Forests 2018, 9, 522. https://doi.org/10.3390/f9090522
AMA Style
Liu Q, Li F. Spatial and Seasonal Variations of Standardized Photosynthetic Parameters under Different Environmental Conditions for Young Planted Larix olgensis Henry Trees. Forests. 2018; 9(9):522. https://doi.org/10.3390/f9090522
Chicago/Turabian StyleLiu, Qiang, and Fengri Li. 2018. "Spatial and Seasonal Variations of Standardized Photosynthetic Parameters under Different Environmental Conditions for Young Planted Larix olgensis Henry Trees" Forests 9, no. 9: 522. https://doi.org/10.3390/f9090522
Note that from the first issue of 2016, this journal uses article numbers instead of page numbers. See further details here.