The Heureka Research Programme - Mistra
The Heureka Research Programme - Mistra
The Heureka Research Programme - Mistra

Create successful ePaper yourself
Turn your PDF publications into a flip-book with our unique Google optimized e-Paper software.
Contents<strong>Research</strong> <strong>Programme</strong> 5Applications of the <strong>Heureka</strong> system 11Regional analysis, RegWise 11Long term planning, PlanWise 14Stand level analysis, StandWise 16Operational planning 18Other applications and system design 22Education and training 24<strong>The</strong>matic research projects 27Growth and yield models 27Specification of silviculturaland natural conservation treatments 31Stand establishment and early growth 34Impact of climate change on tree growth 40Soil biogeochemical modelling 45Biodiversity 52Wood properties 57Models of forest suitability foroutdoor recreation 64Data acquisition for regional planning 68Data acquisition for long term-planning 72System for objective field surveys forlong-term planning 76Data acquisition for operational planning 80Planning and optimization 84Multi-Criteria Decision Analysis 89Forest owner behaviour and dynamics 95<strong>Programme</strong> management 99Funding and expenditure 101Publications in phase I and phase IIof the research programme 103
<strong>Research</strong> <strong>Programme</strong>Introduction<strong>The</strong> vision of the <strong>Heureka</strong> research programme was to significantly contributeto the sustainable multi-purpose management of Swedish forestlandscapes and forest resources by providing up-to-date decision supporttools for different stakeholders, ranging from governmental organisations toprivate forest owners. Within the research programme a suite of software hasbeen developed for different users and problem areas. In the 1990’s goalsand practices within Swedish forestry shifted from single objective timberorientedmanagement towards a multi-purpose management. Nature conservation,environmental protection and social aspects were included in bothforest policies and stated objectives for forest companies and individual forestowners. Available systems, such as the Forest Management Planning Package(Indelningspaketet in Swedish) and the Hugin system were originally developedfor analysis and planning of timber production. With their roots in the1970’s these systems were also quite old, hence their software architecture andprogramming language had become outdated. At the end of the last centurythere were rapid advances in knowledge and methodology in closely relateddisciplines such as landscape ecology and conservation biology, accompaniedby advances in other relevant field, including operation research and remotesensing. Altogether the need for a new generation of forest analyses and planningsystems was obvious and after a feasibility study (Dahlin et. al, 1997) the<strong>Heureka</strong> research programme was established in a small scale at the Facultyof Forest Sciences, Swedish University of Agricultural Sciences (SLU), in theyear 2000. <strong>The</strong> research programme was expanded in 2002 through a researchgrant from <strong>Mistra</strong>, and its first main phase ran from October 2002 to September2005, funded by SLU and <strong>Mistra</strong>. In 2005 the research programmewas further expanded since funding was obtained from two additional financersfor a period of four years. <strong>The</strong> second phase – which is the main focusof this report – of the research programme ran from October 2005 to September2009 with funding from SLU, <strong>Mistra</strong>, the Swedish Forest IndustriesFederations and Kempe Foundations. <strong>The</strong> Faculty of Forest Sciences, SLU,has hosted the research programme but departments at the Faculty of NaturalResources and Agricultural Sciences and the Forestry <strong>Research</strong> Instituteof Sweden (Skogforsk) have also participated. In the second phase the totalfunding has amounted to 10.5 MSEK per year (3 MSEK per year from <strong>Mistra</strong>and 2.5 MSEK from each of the other three financers).This report starts with a short summary and overview of the whole programme,followed by a report on each application (software) of the <strong>Heureka</strong>system and reports from the individual thematic research projects. <strong>The</strong>reafterprogramme management, funding and expenditure are reported and finally acompilation of publications is presented. <strong>The</strong> project reports have been writtenby the responsible researchers, so some 20 authors have contributed tothis report.5
Growth and yieldmodelsSP1 Forest Ecosystem DevelopmentSpecifications ofsilvicultureRegenerationand early growthImpact of climate Soil biogeochangechemical modellingSP5 Applicationsand system designRegional analysisSP2 Goods and ServicesLong term planningBiodiversity(habitat suitabilitymodels)Wood propertiesRecreationStandwise analysesData acquisitionfor regionalanalysisSP3 Data AcquisitionData acquisitionfor managementplanningSystem forobjectivefield surveySP4 Decision Support MethodologiesData acquisitionfor operationalplanningSystem design and programmingExecutable softwarePlanning andoptimizationForest ownerbehaviorMulti criteriadecision analysisEducation and trainingFigure 2. <strong>The</strong> functional organization of the <strong>Heureka</strong> research programme in five subprogrammes.During the course of the research programme ca. 30 researchers at SLU andSkogforsk have been funded (part time) within it. Some ten system designersand programmers – SLU employees as well as consultants – have beeninvolved, and the management team has included a director, an assistant director,an administrator and a communicator (all part-time).Scientific valueGiven that the <strong>Heureka</strong> system is mainly considered as having practicalvalue for users, the fundamental scientific value of the programme consists,firstly, of scientific results obtained in the thematic projects and, secondly, ofresearch in which the <strong>Heureka</strong> system has been used. One of the main ideasof <strong>Heureka</strong> has been to synthesize existing knowledge into models that couldbe integrated into the system. In many cases required knowledge was lackingor there were a need for further development. <strong>The</strong>refore, in many of thethematic research projects fundamental research was needed, resulting in scientificpapers (see the lists of publications in the synopses of the individualprojects or at the end of this report). <strong>The</strong> research programme has generatedmore than 80 scientific papers, more than 45 of which have been publishedor accepted for publication. After the first phase of <strong>Heureka</strong> selected results inthe form of eleven scientific articles were also published in a special supplementto the Scandinavian Journal of Forest <strong>Research</strong> (Öhman and Lämås2006).During the first phase of the research programme an informal researchschool was formed within <strong>Heureka</strong>. It organized a number of PhD studentcourses and eight PhD students affiliated with the research programme havenow been examined. This research school was not continued in the secondphase since, inter alia, the focus in the second phase was to finalize the applicationsof the <strong>Heureka</strong> system. Internationally, the overall <strong>Heureka</strong> research7
programme, the <strong>Heureka</strong> system and its thematic research projects have beenpresented at quite a large number of scientific conferences. Notably, at theinternational conference ‘Adaptation of Forests and Forest Management toChanging Climate with Emphasis on Forest Health: A Review of Science,Policies, and Practices’ in Umeå, August 2008 <strong>Heureka</strong> staff arranged a session`Scenarios and modelling for forest management planning’ in collaborationwith IUFRO 4.02.07 A side event was also arranged at the conference inwhich <strong>Heureka</strong> was presented. Further, in 2009 a new EU research networkwas established, the COST Action FP0804 FORSYS – Forest ManagementDecision Support Systems – to be coordinated by SLU (probably at leastpartly in recognition of the contributions made by <strong>Heureka</strong>).To date the <strong>Heureka</strong> system has been used in the following externalresearch projects (among others):• <strong>The</strong> FP6 integrated project ‘Eforwood’, in which <strong>Heureka</strong> RegWise wasused to provide year 2015 and 2025 indicator values as inputs for theToSIA tool for a forestry-wood chain case study in Västerbotten.• <strong>The</strong> Swedish Energy Agency funded project ‘New perspectives on the roleof forestry in climate change policy’, in which <strong>Heureka</strong> was used to analysestimber and bio-fuel production and carbon sequestration under variouspossible stand management regimes (Backéus et al. 200x).• <strong>The</strong> EU-Life project ‘Forests for Water’, in which <strong>Heureka</strong> PlanWise wasused in a study on stream-water dissolved organic carbon in relation to forestryactivities in a catchment (Öhman et al. 2009).<strong>The</strong> system is also being used or planned to be used in a number of otherprojects, among others:• <strong>The</strong> EU-Northern Periphery project ‘Clim-ATIC’ in which <strong>Heureka</strong>PlanWise and <strong>Heureka</strong> StandWise are being used in collaboration withlocal stakeholders to develop management alternatives adapted to climatechange on a forest holding in Lycksele.• <strong>The</strong> ‘Future Forests’ research programme at SLU funded by <strong>Mistra</strong>, SLU,and the forestry sector in which <strong>Heureka</strong> PlanWise is being used in anintegration project for projections of case study landscapes.• <strong>The</strong> strategic research project ‘A research platform on tree retention’ fundedby Formas in which <strong>Heureka</strong> will be used for projections of landscapes,stands, and tree retention patches.<strong>Heureka</strong> analyses are also being incorporated as components in several currentresearch applications in progress.User value<strong>The</strong> suite of software packages developed and the knowledge producedin the research programme have numerous potential users, including moststakeholders of the forest ecosystem associated with environmental aspects,8
forest production, and social values. <strong>The</strong> most immediate users, however,are authorities, agencies, companies and organisations dealing with mattersrelated to forests, and non-industrial private forest (NIPF) owners. In manycases the software developed represent break-throughs in multi-purpose forestmanagement analyses and planning. For example, for NIPF owners, <strong>Heureka</strong>StandWise provides a tool for making forest management plans for small andmedium sized forest holdings that are considerably more advanced than currentand traditional management plans. For (large) forest companies Stand-Wise includes both strategic and tactical planning facilities within one andthe same tool. It also provides a link to short term planning systems, such asthe VägRust system developed at Skogforsk.In 2009 the <strong>Heureka</strong> system was introduced in teaching at SLU. In theunder graduate courses ‘Silviculture and inventory methods’ and ‘Natureconservation oriented silviculture’ StandWise was used. PlanWise was introducedin the undergraduate course ‘Forest management planning from acompany perspective’ and in the international graduate course ‘Modelinggrowth and yield for decision analysis’.In the second phase of the research programme there were lively contactswith stakeholders via workshops and seminars in collaboration with relevantauthorities, organizations, and forest companies. <strong>The</strong>se activities were complementedby a smaller “road show”, in which the software developed and otherresults from the research programme were presented in three cities. <strong>The</strong> usersof former analyses and planning systems developed at SLU are clearly eagerto start using the <strong>Heureka</strong> system and its extended functionalities. Interest hasalso been shown among new potential user groups, as in the environmentalsector and various organizations, consultants, and advisors working in smallscaleforestry.Fulfillment of objectivesAt the end of the programme period three central computer programs areavailable: RegWise, PlanWise, and StandWise, and three supporting modules:PlanStart (for importing data, etc), Ivent (for field surveys), and PlanEval (formulti-criteria decision analyses). <strong>The</strong> thematic research projects, with a fewexceptions, have delivered expected models and methodologies. Descriptions,user manuals and tutorials for the software are available from a web-page in aWikipedia format (http://heureka.slu.se/wiki). <strong>The</strong> software is available forfree downloading via the <strong>Heureka</strong> Wiki (registration of the user is required).A unit is established at SLU to maintain the system and ensure that it continuesto be accessible when the research programme ends. <strong>The</strong> overall objectiveof the research programme – development of decision support tools for multipurposeforestry – has thus been met. <strong>The</strong> <strong>Heureka</strong> system is already beingused in research, teaching and for some other uses. It is obvious that objectivesof the research programme and the development of the <strong>Heureka</strong> systemhave been a huge undertaking. Although the software packages are availableand running it would have been desirable to have had an extended period of9
testing and final adjustments between the development phase and the introductionand use phase. In practice, the testing and adjustments were less comprehensivethan ideal, partly due to late delivery of models from some thematicresearch projects, and partly to underestimation of the effort requiredfor testing. Testing, final adjustment and completion of system documentationand user manuals are continuing at the unit responsible for the maintenanceand accessibility of the system. At present, however, the resources available forthe unit to these efforts seem limited.ReferencesScientific articlesLämås, T. and Eriksson, L.O. 2003. Analysis and planning systems for multi-resource, sustainableforestry - <strong>The</strong> <strong>Heureka</strong> research programme at SLU. Canadian Journal of Forest<strong>Research</strong> 33(3):500-508.Öhman, K. and Lämås T. (eds.) 2006. Selected results from the first phase of the <strong>Heureka</strong>research programme Scandinavian Journal of Forest <strong>Research</strong> 21(3-4) Suppl. 7ReportsAnon. 2005. <strong>The</strong> <strong>Heureka</strong> <strong>Research</strong> <strong>Programme</strong>. Final report for phase 1, October 2002– September 2005. SLU. 74 pp.Dahlin, B., Ekö, P.-M., Holmgren, P., Lämås, T. & Thuresson, T. 1997. <strong>Heureka</strong> - a modelfor forest resource management. A research strategy prepared at the Faculty of Forestry,SLU. SLU, Faculty of Forestry. Report 17. 115 pp. In Swedish with English summary.Ingemarsson, F. 2005 (ed). Can we get more from the forest? Analysis tools for environmental,production, and social values of the future. <strong>The</strong> <strong>Heureka</strong> research programmeyearly report 2004. Proceedings of the SLU Forest Conference 2004. SLU, Faculty ofForest Science. Report 20. 191 pp. In Swedish with English summary.Popular science publicationsLämås, T., Dahlin, B. 2006. <strong>Heureka</strong> – analys och planeringssystem för mångbruk ochmiljö. Metstieteen aikakauskirja 1/2006: 66 - 71.External referencesÖhman, K., Seibert, J., and Laudon, H. 2009. An approach for including consideration ofstream water dissolved organic carbon in long term forest planning. Ambio 38(7): 387-393.Backéus, S., Lämås, T., and Wikström, P. 200X. Carbon sequestration in Swedish foreststands under different management regimes. Manuscript10
Applications of the <strong>Heureka</strong> systemThree main applications (software) of the <strong>Heureka</strong> system have been developed,each containing the core of the <strong>Heureka</strong> system, i.e. models depictingindividual tree and stand development:• RegWise for regional analysis• PlanWise for long-term planning in large and small forest holdings• StandWise for analysis of individual stands.To support these main applications a number of software modules have alsobeen developed:• PlanStart for importing data, etc.• Ivent for field surveys of (sample) stands• PlanEval for multi-criteria decision analysis (described in the <strong>The</strong>maticresearch projects chapter).In addition, a suite of software has been developed at Skogforsk for operationalplanning. This was included in <strong>Heureka</strong> to link information (data) andmethodology between long-term and short-term planning.Regional analysis, RegWiseProject leader: Torgny Lind, Dept. of Forest Resource Management, SLU,UmeåProject aim<strong>The</strong> objective was to develop an application for long-term analyses ofregions, counties or other large areas. <strong>The</strong> application is named RegWise(Fig. 3) and is based on a simulation approach to answer “What if?”questions.<strong>The</strong> simulations are guided by a set of rules and regulations. <strong>The</strong> applicationshould be able to include many different utilities in the analyses and reportresults as indicators of these utilities over long-time horizons. Examples aretimber production, biodiversity, carbon sequestration and recreation indicators.Methods used in the project<strong>The</strong> primary method to implement models such as growth models in the<strong>Heureka</strong> system consisted of writing requirement specifications and instructiondocuments about the models. <strong>The</strong>se documents were sent to the softwaredevelopers group for implementation in co-operation with those responsiblefor each model. After implementation each model was tested against a set oftest data. Another important aspect has been communication with researchersinvolved in other sub-projects within the <strong>Heureka</strong> programme in order tofacilitate implementation of their models. Results of analyses with RegWisehave also been compared to results obtained using the Hugin system.11
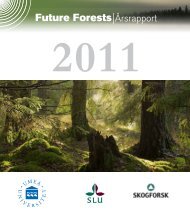
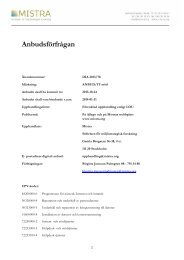
User valueIn future, RegWise will be used at least by the users of the present Huginsystem. However, RegWise meets all the requirements to be useful for awider group of users than existing system (Hugin), because its analyses provideresults covering more utilities. RegWise is also more flexible and it canbe run on an ordinary computer, providing users opportunities to undertaketheir own analyses, with support from SLU.RegWise has been used within the Eforwood project funded under theEU “Global change and ecosystems“ research activity of the Sixth Framework<strong>Programme</strong> (www.eforwood.org). <strong>The</strong> role of RegWise was to estimatevolumes from cuttings for the years 2015 and 2025 in Västerbottenbased on a reference scenario.Figure 3. Screen-shot of growing stock and harvested volume data generated by RegWise.Fulfilment of objectives<strong>The</strong> first version of RegWise includes most of the functionality originallyplanned. <strong>The</strong> system is flexible and the user can generate scenarios with differentforest management methods assigned to specific forest areas. It is alsoworth mentioning that new models for estimating climate effects on treegrowth, soil carbon and nitrogen stocks and sequestration are integrated inthe application. One objective was to make analyses based on wall-to-wall12
data, improving opportunities to include models demanding such data. Examplesare habitat index models and models estimating forest owner behaviourbased on forest estate data. However, although RegWise is designed for usingwall-to-wall data it is not yet streamlined for using this type of data.Further developments should include a module for estimating effects of forestowner behaviour on cutting and regeneration activities based on wallto-walldata (providing data for each individual holdning) and external dataabout forest owners. Another important issue is to widen the number of usersof RegWise both within and outside SLU.ReferencesLind, T. 2002. A Blueprint of the Hugin II system. In: Heikkinen, J., Korhonen, K. T.,Siitonen, M., Strandström, M. and Tomppo, E. (eds). Nordic trends in forest inventory,management planning and modelling.Finnish Forest <strong>Research</strong> Institute. Proceedings ofSNS Meeting in Solvalla, Finland. April 17–19, 2001.<strong>Research</strong> Papers 860: 149–152.Scientific articlesBarth, A., Lind, T., Pettersson, H. & Ståhl, G. 2006. A framework for evaluating dataacquisition strategies for analyses of sustainable forestry at national level. ScandinavianJournal of Forest <strong>Research</strong> 21, Supplement 7:94-105Working papersTomé, M. & Faias, S. (eds), 2007. Report describing version 1 of the regional simulators.EFORWOOD Tools for Sustainability Impact Assessment. Deliverable PD2.5.6.Popular science publicationsLind, T. 2005. Applikationen för regional analys. I: Ingemarsson, F (editor). Har skogenmer att ge? <strong>Heureka</strong> årsrapport 2004. Fakulteten för skogsvetenskap, SLU, Rapport nr20: 33–36 (In Swedish).13
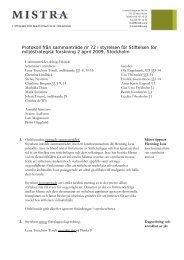
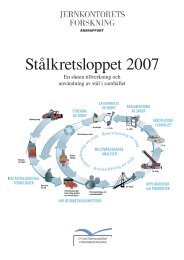
Long term planning, PlanWiseProject leader: Peder Wikström, Dept. of Forest Resource Management, SLU, Umeå.Project aim<strong>The</strong> overall aim of this project was to develop a decision support system forlong-term planning, capable of strongly facilitating attempts to improve theutilization of forest resources with respect to both timber production andnon-monetary values. Here, non-monetary values refer to biodiversity, socialvalues (recreation), and carbon sequestration. <strong>The</strong> application is named Plan-Wise (Fig. 4) and uses an optimization approach to search for preferred solutions(i.e., to address “How to?” questions).Key primary tasks for the project included the specification of requirementsfor the software, including the functionalities that should be included,and technical specifications such as performance requirements. <strong>The</strong> requirementsinclude functional requirements, that is what functionality that shouldbe included in the software, as well as technical requirements such as performancerequirements.Methods used in the project<strong>The</strong> requirements have been compiled by:• continuous discussions with a reference group• following public forestry debates• participation in research projects• literature studiesFigure 4. Screen-shot generated by the PlanWise software for long-term planning.14
User valueA complete decision support system for forestry planning has been developedand is freely available by downloading from the internet. <strong>The</strong> system can beused to make prognoses and generate alternative plans and scenarios for agiven forest holding or forest landscape. Thus, the system can guide to usersto better decisions and thereby increase the value of their forest and its production,both economically and with respect to other, non-monetary, values.Here, the built-in optimization model helps the user to select among variousstand-level management alternatives so the overall objectives for the wholeforest can be met.<strong>The</strong> system can also be used in education and in spring 2009 was used bystudents taking the SLU graduate course “Forestry Planning from a CompanyPerspective” (Skoglig planering ur ett företagsperspektiv).Finally, PlanWise can be used for research in forest policy and forestryplanning (see references below).Fulfillment of objectivesPlanWise was successfully developed and is absolutely state-of-the-art in thefield of forestry decision support systems. It seamlessly integrates data managementwith simulation models, a flexible optimization system, maps, graphs,and tables.Some functionality was not implemented due to a shortage of time andpersonnel in the software development project. <strong>The</strong> model for depicting treewood properties is one example. <strong>The</strong> system should also have been morethoroughly tested before release. More resources should have been put intothis.Part of the project overlapped with the optimization project addressing thedevelopment of the optimization programming model, optimization models,and tactical planning (see Optimization project section).ReferencesScientific articlesBackéus S., Lämås T. and Wikström P. Carbon sequestration in Swedish forest standsunder various management regimes. (manuscript). In Backéus S, 2009. Forest ManagementStrategies for CO2 mitigation, Acta Universitatis Agriculturae Sueciae 2009:89(Doctoral <strong>The</strong>sis). 47 s, ISBN: 978-91-576-7436-4Hankala, A., Wikström, P., and Eriksson, L.O. 2009. Using software to support forestrydecision-making with multiple goals: a case study with the MCDA application of the<strong>Heureka</strong> planning system. (In prep.)15
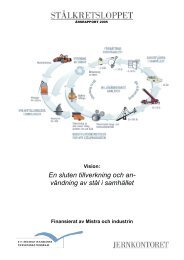
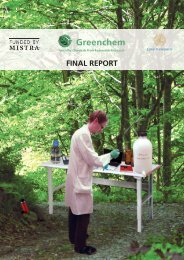
Stand level analysis, StandWiseProject leader: Peder Wikström, Dept. of Forest Resource Management, SLU, Umeå.Project aimStandWise (Fig. 5) should be considered a love child, conceived during theproject. It was not planned from the beginning, but proved to be muchloved and received a lot of attention. <strong>The</strong> software is an interactive simulatorfor exploring stand development and effects of silvilcultural and harvestingactions.Methods used in the projectStandWise is based on the same core as PlanWise and RegWise. Two softwareprogrammers who had been working on stand and tree visualization wereengaged to design and program the 2D and 3D-visualization models. <strong>The</strong>yused their own experience from their Master’s projects, in which they constructeda 3D forest stand simulator.User valueStandWise has been used by a Swedish forest company to evaluate and visualizealternative treatments and development scenarios for dense stands, forwhich determining optimal thinning treatments were considered difficultto determine. As an example, StandWise has been used by a Swedish forestcompany to evaluate and visualize different alternative treatments and devel-Figure 5. Screen-shot generated by the interactive simulator StandWise.16
opment scenarios for a stand that was considered problematic in terms ofdifficulties in determining whether a thinning that was performed in a densestands was the best decision. Results from a number of scenarios were usedin subsequent discussion among foresters and decision-makers. StandWise hasalso been used in graduate courses in forest management and inventory. <strong>The</strong>students typed in their own field data measurements in StandWise, and couldvisualize and exploit the current state, and different management alternatives.StandWise is currently being used in a project dealing with continuous coverforestry at the Forestry Agency. StandWise will be used to calculate and visualizedifferent stand development scenarios for selected research sites.Fulfillment of objectivesStandWise was successfully developed and it proved feasible to construct anew application that shares the same core as PlanWise and RegWise. Stand-Wise has proved very useful for testing, education, research, software demonstration,and visualization of treatment alternatives.Future areas of improvement include (inter alia) the addition of functionalityto simulate tree positions for different spatial patterns (currently onlydistributions defined by a Poisson process are supported), the possibility tomanually select individual trees for cutting, implementation of different thinningor selection cutting algorithms, and 3D-images of more tree species(currently images are available only for pine, spruce and birch).ReferencesPopular science publicationsWikström, P., Klintebäck, F., and Westling, J. 2008. BeståndsVis – en simulator för analysav skogsskötsel. Fakta Skog nr 4/2008. SLU, Umeå.17
Operational planningProject leader: Mikael Frisk, SkogforskProject aim<strong>The</strong> operational planning module in <strong>Heureka</strong> considers short-term planningof harvesting and transportation activities and has a clear connectionto the long-term planning application, PlanWise. For example, resultsfrom PlanWise, such as suggested harvest alternatives for different stands,can be directly used for planning of road investments or harvest resourceplanning. <strong>The</strong> aim of the operational planning is to support short-termplanning of forest harvests and logistics. An important reason for includingthe project in <strong>Heureka</strong> was to provide secure information (data) andmethodology links between the long-term and short-term planningapplications.Skogforsk has been responsible for the project and has developed anumber of tools (software) for operational planning. In <strong>Heureka</strong> phaseone Skogforsk received money from the <strong>Heureka</strong> budget for this work. Inthe second phase, however, Skogforsk has financed the work except for acase study in the last year linking long-term planning to operational planning.For this reason Skogforsk has not followed all of the standard <strong>Heureka</strong>procedures (e.g. for reporting progress).Methods used in the project<strong>The</strong> application for operational planning consists of four planning tools,due to the variations in decisions that have to be made and the time horizonsthat have to be considered. Over the 1-3 years time horizon, typicaldecisions concern investments in forest roads and terminals for storageand railway transportation. Over the monthly to single year time horizonthe decisions rather focus on transportation issues and delivery plans,including for example, decisions regarding which stands to harvest inwhich month, allocation of stands to different mills, the use of differenttransportation modes, such as truck or train, back-hauling possibilitiesand timber exchange between different forest companies. <strong>The</strong> tacticalplanning period normally extends over a period from a month to a year.At the operational level, covering a time period from a day to a couple ofweeks, daily planning includes scheduling tasks and route optimizationfor trucks and harvesting machines.All of these planning tools share a common structure: a database for datastorage and calculations, a user interface for preparing data and interpretingresults, and an optimization model for the calculations.User valueIn phase one funds from the <strong>Heureka</strong> budget were used to finance parts ofthe development of models and decision support systems for wood flow optimization(FlowOpt), route optimization (RuttOpt) and road investment planning(VägRust). <strong>The</strong> systems were developed in close cooperation with forest18
<strong>Programme</strong> meeting including an excursion on, among others, remote sensing and habitat models,October 2008, Vindeln. Photo Tomas Lämåscompanies in Sweden, and they have been used and tested in a number ofcase studies in which several different logistical questions have been addressed.For example, FlowOpt has been used to support decisions regarding largeinvestments in train terminals, to find the most optimal combination of truckand train transportation and to analyze the potential for timber exchangebetween forest companies. <strong>The</strong>se studies have identified potential cost savingsof up to 15 % for the companies involved. At least two companies have alsoimplemented the decision support tool FlowOpt into their business and usedit to reduce costs and emissions.<strong>The</strong> system for planning road upgrades (VägRust) has been used in twocase studies together with Stora Enso Skog AB and Holmen Skog AB. <strong>The</strong>results show that the potential for this kind of tool is very high and theoptimization model gave interesting and reasonable suggestions for roadinvestments according to the companies.RuttOpt has been developed as a powerful analytical tool, capable ofhandling large, complex transport planning environments. Exact planningfor hundreds of trucks over a period up to a week can be handled, and theeffects of alternative plans on transport costs, under various conditions,can be calculated.In the second phase Skogforsk has reported work focused on improvingexisting tools to make them more user friendly and better adapted toissues that were not previously included. In FlowOpt this involved develop-19
ment of the optimization model for multi-period analyses and storage planning.Methods for assessing cost-sharing between companies have also beendeveloped and tested. Functions for optimizing the procurement of forestfuel, which involves decisions regarding several other aspects in addition toround wood procurement, such as chipping operations, have also been added.<strong>The</strong> model has to decide when, where and by which machine the forest fuelshould be chipped into smaller fractions.For RuttOpt and VägRust a completely new platform and user interfacehave been developed. <strong>The</strong> platform is technically the same for each of thesystems but some functionality and views are different. <strong>The</strong> platform isbuilt like a client-server solution and consists of Open Source programssuch as PostgreSQL and GeoServer.<strong>The</strong> development of RuttOpt also included development of an optimizationmodel to handle larger, more complex planning problems, independentloaders and queues at loaders and industrial sites. In several case studies theimplementation of route planning has been tested. This is very complex sinceit changes the working conditions and business relations for all stakeholders,and further work is required to ensure a smooth transition from current practicesto centralized route planning.For VägRust, a completely new optimization model has been constructed.<strong>The</strong> new model is more advanced and will take into account moredetails than the prior version. <strong>The</strong> model now considers storage placesfor storing timber from one season to another in order to complement orreplace the road investments. <strong>The</strong> model also considers different vehicletypes, typical vehicles equipped with CTI (Central Tyre Inflation) and normalvehicles. <strong>The</strong> CTI-trucks are allowed to use roads of lower standardduring seasons of low bearing capacity such as spring thaw, and providecomplementary options to storage and upgrading when planning continuous,year-round deliveries from forest to mill.<strong>The</strong> system will also provide a more detailed way of calculating thecosts for upgrading, using the placement of gravel pits and the distancefrom all roads to the closest gravel pit.<strong>The</strong> system is intended to be fed by information directly from the <strong>Heureka</strong>planning tool PlanWise regarding harvesting alternatives for a large numberof stands. <strong>The</strong> information from PlanWise includes different harvest alternativesfor each stand with harvested volume per assortment and year, presentvalue and costs of harvesting. Together with information on delivery plans fordifferent seasons and road information the model will also find ways to fulfillindustrial demands during periods with low accessibility by road. This is doneby using the optimal combination of road upgrading, timber storage and theuse of CTI-trucks while minimizing costs of upgrading, transportation andstorage and maximizing the present value.<strong>The</strong> whole process, analyses in PlanWise and optimization in VägRust hasbeen tested in a case study in conjunction with the forest company Sveaskogin northern Sweden. <strong>The</strong> case comprised over 12 000 stands, 2 300 km of20
forest roads, 10 time periods, four seasons and and ten industrial sites. It wasperformed at the very end of <strong>Heureka</strong> phase two and will be reported separately.<strong>The</strong> case study was funded by the <strong>Heureka</strong> budget.Fulfillment of objectives<strong>The</strong> models and methods developed and incorporated within the applicationfor operation planning fulfill the project´s objectives as formulated inthe project application.All models have been tested on real cases at forest companies in Swedenwith very good and interesting results. During these cases studiesvaluable knowledge about the models and methods has been transferredto the companies in order to facilitate future implementation. <strong>The</strong> resultsfrom many of the case studies show that there is great potential for reducingcosts and emissions when using the models for planning the woodsupply chain. Now that the models have been developed and tested thenext step is to promote their implementation by the companies.ReferencesExternal referencesM. Henningsson, J. Karlsson and M. Rönnqvist, Optimization models for forest roadupgrade planning, Journal of Mathematical Modelling and Algorithms, Vol. 6, No. 1, 3-23,2007.M. Frisk, M. Göthe-Lundgren, K. Jörnsten and M. Rönnqvist, Cost allocation in collaborativeforest transportation, accepted for publication in European Journal of Operational<strong>Research</strong>.P. Flisberg, B. Liden and M. Rönnqvist, A hybrid method based on linear programmingand tabu search for routing of logging trucks, Computers & Operations <strong>Research</strong>, Vol. 36,1122-1144, 2009.G. Andersson, P. Flisberg, B. Liden and M. Rönnqvist, RuttOpt – A decision supportsystem for routing of logging trucks, Canadian Journal of Forest <strong>Research</strong>, Vol. 38, 1784-1796, 2008.21
Other applications and system designPlanStartPlanStart is a software program used to import data from different datasources into the system, for example ordinary stand inventory databases,GIS-data, kNN data, and background images. PlanStart can import datafiles from the Forest Management Planning Package, thereby offeringbackward compatibility with that system. PlanStart can also assist fieldinventory stratified sampling design, and both export and import datato and from Ivent (see below) and process these data. PlanStart also hasfunctionality to simulate tree lists (height and diameter distributions)from stand-level averages if individual tree data are not available.IventIvent is a program for handheld computers developed for field inventory ofdata that are needed for analyses with the application for long-term planning,PlanWise. Ivent is designed for surveys of plots, within selected stands, in eachof which: trees are either callipered (in medium aged and old stands) or measuredby height (younger forests)(Fig. 6); the age, height, damage and qualityof randomly selected sample trees are recorded; and both stand and site dataare registered at plot level. Ivent can communicate with a GPS and showdistance and direction to the plot and log plot coordinates. Together with aPosTex instrument from Haglöf, the position of each tree on the plot canbe determined. Ivent has been developed for Windows Mobile and uses thedatabase SQL server Compact Edition. <strong>The</strong> software has been used with thehandheld TDS Nomad and also works directly on a PDA. To be used togetherwith other brands of handheld devices, Ivent might need some adjustment.So far the software has been used together with DigiTech® Professional caliperfrom Haglöf.<strong>The</strong> system for objective field surveys within <strong>Heureka</strong> largely resemblesthe system previously developed within the Forest Management PlanningPackage (FMPP) and Ivent can be seen as a follow-up of the FMPP’s softwarefor handheld computers, which has been widely used in recent decades.Although specifically developed to collect data for analyses with PlanWise,Ivent can also be used independently and with other types of plot layout. Forexample, Ivent has already been used for field inventories in connection withremote sensing research studies. Together with the application PlanStart, thereis a possibility to make some choice of variables and to include user-definedvariables.22
Figure 6. Examples of screen layouts in Ivent with, from the left, a tree list in which trees areregistered directly through the calipers or manually, a form for registering site data and a plotview with trees positioned with a PosTex instrument from Haglöf.System design<strong>The</strong> system was developed by a group of four to five programmers, a testleader and a project leader. System architecture is state-of-the-art and adoptslatest knowledge in the design of complex systems, for example by clearlyseparating data management from business logic and user interfaces. <strong>The</strong>system is a Windows application, developed in Visual Studio with C# asprogramming language. SQL Server (free or commercial version) is used fordata storage, and can be installed either on a server or locally on a computer.All software can be downloaded from the internet, and a website (a “wiki”,http://heureka.slu.se/wiki) has been set up where users can find informationon installation, user’s help and tutorials, and other documentation. Somethird-party software is included. Cplex is optional and requires that the userhas a licence. Third-party software includes LP_Solve (optimization solver),ILOG Cplex (optimization solver), OnyxTree (tree images), ZIMPL (optimizationmodeling language), DotNetMagic (Graphical User Interface components),and ZedGraph (Graphs).23
Education and trainingProject leader: Hampus Holmström, Dept. of Forest Resource Management, SLU, Umeå.<strong>The</strong> <strong>Heureka</strong> Wiki – a web-based encyclopediaTo provide information on the <strong>Heureka</strong> system a website in a Wikipediaformat was created during the last year of the research programme (http://heureka.slu.se/wiki, Fig. 7). Wiki was a main task for the Education and trainingproject. With easy access, updated information and a well-known format,the Wiki is convenient for all users; from the interested forester to the experiencedforest researcher. Here, one will find:• Information about the different applications of the system• Downloadable installation files and software (and hardware) setup instructions• User’s guides and tutorials.<strong>The</strong> reference manuals describe the user’s possibilities to control thesimulations (primarily the forest management treatments) and adaptanalyses for specific purposes (e.g., by applying user-defined optimizationmodels). Descriptions of the system’s underlying simulation and prognosismodels are continuously updated. Interactive methods have beenused in education (see below) where the exercises were extended by tipsand hints as proposed solutions were reported, and thereafter added tothe website. For a potential user, the Wiki should be the first place to startlooking for information about the <strong>Heureka</strong> system. Contacts are herelisted, to answer any following questions. Advanced users do also haveaccess to the bug report system.Figure 7. <strong>The</strong> <strong>Heureka</strong> Wiki website with navigation menus to the left, an internal searchengine, and plentiful linked pages.24
Implementations in practical forestryOn several occasions, the <strong>Heureka</strong> system has been demonstrated to representativesof the Swedish forestry. Here, users of the Hugin system and the ForestManagement Planning Package (FMPP) (e.g., the Swedish Forest Agency andthe forest companies, respectively) were given insight in the new forest managementplanning system, and experience, including hands-on exercises. Specialattention was directed towards the non-industrial private forest owners(representatives of “small-scale forestry”) since they were a new target group,introducing them to a more advanced planning system than traditional forestryplans.<strong>The</strong> advances in the system include (inter alia) the unbiased initialforest descriptions, the length of the planning horizon, the use of economiccalculations (e.g. net present values), and optimizations instead of subjectivemanagement proposals.Applicable and appreciated pedagogical toolsFor several decades the FMPP has been used in the “Forest ManagementPlanning from a Company Perspective” course to analyze a large forest holding(some thousands of hectares). In 2009, PlanWise was used instead, andfor the first time applied in students’ excercises. Much appreciated, partly byinvolving the students in the system development (several bugs were bothfound and fixed during the course), the system proved to be useful for solvingmultiple-goal forestry problems. Assigned tasks concerned promotion ofIn 2009 the <strong>Heureka</strong> system was introduced in undergraduate and graduate courses at theFaculty of Forest Sciences, SLU. Photo Sofia Hansson.25
iological diversity, recreational values, game hunting, etc., although always inconjunction with long-term, profitable forestry. Problems were solved by forestdomain classifications as well as by restricted optimization models.In the “Silviculture and Inventory Methodology” course the studentsfirst took in-field measurements of a forest, then analyzed effects of differenttreatments applied to this forest, using StandWise. <strong>The</strong> simplicity ofapplying, and undoing, a certain treatment in a certain forest, visualizedin 2D and 3D, was found to be of great interest. Moreover, the studentslooked forward to using PlanWise with its built-in Treatment ProgramGenerator in future courses.During 2009 the <strong>Heureka</strong> system was used in parts of several othercourses, e.g. “Forest Management Planning” and “Nature conservationoriented silviculture”. Some Master’s projects were based on analyses withPlanWise. Introductory lectures have also been held at other SLU locations,e.g. Skinnskatteberg and Alnarp, and the system will presumably beapplied in teaching at these sites in the future.Part of the <strong>Heureka</strong> team at the programme meeting September 2009, Borgafjäll. Photo SusanneSjöberg.
<strong>The</strong>matic research projectsGrowth and yield modelsProject leader: Björn Elfving, Dept. of Forest Ecology and Management, SLU, UmeåParticipants: Nils Fahlvik, Southern Swedish Forest <strong>Research</strong> Centre, SLU, AlnarpProject aim<strong>The</strong> growth and yield models form the core elements for projections oftree layer development. <strong>The</strong>y mainly consist of models for stand establishment,diameter- and height growth, in-growth and mortality. <strong>The</strong> modelsfor stand establishment were developed in a separate <strong>Heureka</strong> project.Accurate projections of tree and stand development are essential for theoverall reliability of the <strong>Heureka</strong> planning system.Methods used in the projectEmpirical models were developed on the basis of data from the NationalForest Inventory and from long-term experiments and yield plots controlledby the Faculty of Forest Sciences. Functions were parameterized byregression analysis under the assumption of stable growing conditions,i.e. it was assumed that observed growth relations in the past will continuein the future. So far, no deviations from this assumption have beendetected. <strong>The</strong> focus in the last three years has been on adapting and testingpreviously developed models. However, new models were developedfor height growth of beech and oak and for thinning responses. Effects ongrowth of whole-tree utilization and on mortality of ageing and sheltercuttinghave been quantified on the basis of literature reviews. <strong>The</strong> variabilityof growth and ways to ensure the largest possible precision ingrowth predictions have also been reviewed.User value<strong>The</strong> value for the planning system of reliable projections of the tree layerdevelopment is self-evident. <strong>The</strong> new models have also increased possibilitiesto evaluate alternative silvicultural systems like continuous coverforestry.Scientific resultsNo scientific reports have been published in the project period. <strong>The</strong> aim isto gather all growth models with descriptions of their background in thereport “Growth modeling in the <strong>Heureka</strong> system” (in prep.). <strong>The</strong> most evidentresult from the project is a working planning system.Fulfillment of objectivesAlthough a working system has been constructed many details should bere-considered and improved. Regional deviations from predicted growthhave been observed, but not considered. <strong>The</strong>ir background and stability overtime should be examined. <strong>The</strong> system for predicting height growth should27
e tested in relation to stem form development. Effects of suppression andrelease of trees on this relationship are complex and not specifically handledso far. Mortality functions have been developed on the basis of data fromlong-term thinning experiments, but they have not yet been implementedin the <strong>Heureka</strong> system since they only concern pure and even-aged pine andspruce stands. (<strong>The</strong> present <strong>Heureka</strong> mortality functions are based on NFIdata.) <strong>The</strong> system for tree selection at thinning works well, but is difficult tohandle and has weak empirical foundations. Ideas for development have beenpresented but further studies are needed before a new system can be implemented.It is also important to continuously follow the growth level in orderto detect deviations between true and projected growth. Effects of changes inthe climate and nitrogen deposition can be expected, but must be empiricallyverified.3,02,5ObsEstiG5, m²/ha2,01,51,0Numb.of plots300020000,510000,00 20 40 60 80 100 120 140 160 180 200Stand age, yrs0Figure 8. Partial relationship between basal area growth and stand age: numbers of observationsand observed and estimated growth in different age classes. Observed data from, and estimateddata for, the permanent NFI-plots in the first observation period (iG5=five-year basalarea increment).28
600PineSpruceBirch500400Max-age, yrs300200100016 20 24 28 32Site index (SIS), mFigure 9. Tree longevity: maximum ages for trees of different species according to studies onage-determined sample trees in the NFI plots. Those relations were used in functions for mortalitydue to tree ageing.302520Top height, m15105PineSpruceBirchAlderAspenBeechOak00 20 40 60 80 100Total age, yrsFigure 10. Patterns of height growth for different tree species with top heights passing 16 m atage 50 years, based on functions for height growth derived from data from both temporary andlong-term yield plots.29
ReferencesScientific articlesElfving, B. 2009. Natural mortality in thinning and fertilization experiments with pineand spruce in Sweden. Submitted.Elfving, B. 2009. Top height development in thinning and fertilization experiments withpine and spruce in Sweden. Submitted.Working papersElfving, B. 2009. Growth modeling in the <strong>Heureka</strong> system. In prep.30
Specification of silviculturaland natural conservation treatmentsProject leader: Ulf Söderberg, Dept. of Forest Resource Management, SLU, Umeå.Participants: Björn Elfving, Dept. of Forest Ecology and Management, Kenneth Nyström,Dept. of Forest Resource Management, SLU, Umeå.Project aim<strong>The</strong> aim of this project was to provide the <strong>Heureka</strong> system with adequateroutines for regulating and controlling the system to obtain the desiredscenarios for the user. One part of the project was to evaluate existingspecifications of silvicultural treatments, and if appropriate use them ordevelop them further. Another was to develop new specifications, payingspecial attention to the development of specifications for alternativemethods of silvicultural treatments (continuous cover forestry) and specificationsof natural conservation.<strong>The</strong> project is concerned with one of the core areas of the <strong>Heureka</strong> systemsince flexible and realistic specifications of silvicultural treatments,natural conservation and other regulating systems are crucial for the outcomeof the system.Methods used in the project<strong>The</strong> methods used were literature studies, interviews and tests of algorithms.Specifications developed in earlier forest management planningsystems were examined (Eriksson 1981, Lind 2003, Wilhelmsson 1981) anddiscussions were held with users of these systems to gain knowledge ofexperiences of different specifications.Various currently available applications were also evaluated, especially severalthinning simulators, in terms of performance and parameter settings.User value<strong>The</strong> results of the project are essential components of the system for theuser that provide, after programming the interface between the user and thesystem, him/her to specify the scenarios he/she wishes to study. <strong>The</strong> greaterthe flexibility and the more alternative silvicultural and natural conservationtreatments that can be specified, the greater the value for different users.Scientific results<strong>The</strong> results of the project are a considerable number of specificationsdelivered to the system development group. <strong>The</strong> evaluation of the existingthinning simulators showed that two had fairly similar properties fordifferent types of thinning, but one had some advantages that could beused in specifications of alternative silvicultural treatments.<strong>The</strong> specifications of the traditional silvicultural treatments have beenchecked and documented for the <strong>Heureka</strong>-system. <strong>The</strong>y cover all mainsilvicultural treatments, including soil scarification, regeneration methods,specifications for prioritising and performing thinning and final felling,31
and for prioritising and considering effects of fertilisation. Specificationsfor cleaning, stand establishment and early growth were handled in theproject. Furthermore, algorithms for calculating total volume from thinning,and proportions of volumes from non-prioritised thinnings and finalfelling for the application RegWise were documented.Continuous cover forestryFour types of alternative silvicultural methods/continuous cover forestrywere defined with accompanying silvicultural descriptions. <strong>The</strong> fourtypes described are: selection cutting in spruce stands, two-storied pinestands, urban forests and deciduous-rich marshes. <strong>The</strong> definitions includecriteria used to define suitable stand and site conditions for the differenttypes. <strong>The</strong>se alternatives can be seen as default alternatives, while a useralso has the possibility to change them or define his or her own alternatives.Example, selection cutting in spruce stands.Potential stands/plots are defined by a spruce proportion >0.7, a field vegetationtype equal to Vaccinium myrtillus or better (i.e. indicative of a richer site)and stands/plots in the thinning or final felling stage.<strong>The</strong> diameter distributionshould be decreasing, i.e. the numbers of stems in four width classes (inwhich the width of the trees is at least a quarter of the width of the thickesttree on the plot) should successively decrease, as the width increases.<strong>The</strong> treatment is specified as a weak thinning from above. <strong>The</strong> so-called10§-curve in the Forestry Act defines the lowest allowable volume in thestand after cutting aiming at improving forest development. This curveis used as a guide curve. Thinning is performed when at least 30% of thevolume can be cut without falling below the curve, i.e. when V Act> 1.43V Min, where V Actis actual volume and V Minis volume from the guide curve.Nature preservation methodsNew approaches have been developed to promote nature conservation,involving conservation measures at three levels: stand level, groups of treesand the individual tree level. Different specifications are needed for the differentlevels. If information on an area for nature preservation is given in theinitial data, this area is referred to the corresponding forest domain, e.g. borderzones.Stand level<strong>The</strong> user can define forest domains to be kept for nature conservation, forinstance deciduous-rich stands, signified by > 60 % deciduous species inyoung forests and > 30 % in thinning and final felling stage. <strong>The</strong> standsare treated by promoting deciduous trees when thinned.Plot levelTwo cases are distinguished that are treated in different ways: border32
zones and other tree groups. Border zones are gathered in a separate forestdomain and consist of areas bordering waters and bogs. <strong>The</strong> preservationof other tree groups is randomly distributed across plots and plotparts. <strong>The</strong> user can specify the proportion of the area to be allocated tonature preservation. In many cases the information on plots within borderzones is available either from field data or can be retrieved from GIS layerinformation. <strong>The</strong> remaining area allocated to nature conservation is allocatedto a random proportion per plot (0-100%) of the plots needed tomeet the specified area.Tree level<strong>The</strong> trees to be retained at final felling for nature conservation can be specifiedas “eternal trees” (large trees) or as retained for diversity preservation.<strong>The</strong> latter are generally deciduous trees. <strong>The</strong> number of trees per hectarethat should be left for retention is specified by the user. <strong>The</strong> selection ofretained trees is made in a prioritised order based on tree species and diameterat breast height. A list is given as a default specification but the user canchange the order of species as well as the diameter criteria.Fulfillment of objectivesGenerally speaking, the objectives have been achieved. Many specificationsused in the Hugin-system were found to be appropriate for use inthe <strong>Heureka</strong> system, in some cases with minor modifications. <strong>The</strong> developedmethods and specifications for continuous cover forestry and naturalpreservation are flexible and give great opportunities for the user tospecify desired scenarios.A new concept for designing treatments was developed, using imputationto allow the use of more plots for decisions regarding treatmentsand their performance. However, time was limited and the ideas were notcompleted. <strong>The</strong> methods for continuous forest cover and nature preservationcould be developed further in terms of selections of stands and trees.This would then require information on how these treatments are actuallydone in practice.ReferencesExternal referencesEriksson, B. 1981. Åtgärdsval vid långsiktiga regionala avverkningsberäkningar. Sammanfatttningav arbetet inom problemområdet ”åtgärdsprogram” inom Hugin-projektet.Slutredogörelse för anslag nr S620/ P294. Statens råd för skogs- och jordbruksforskning.Lind, T. 2003. Hugin’s och IP’s regelverk. <strong>Heureka</strong>-projeket, working paper.Wilhelmsson, E. 1981. Provytedatas tillämpbarhet- en studie av variationen mellanprovyta och avdelning samt dess konsekvenser för beräkningar med Hugin-systemet.SLU, Projekt Hugin, rapport nr 24.33
Stand establishment and early growthProject leader: Kenneth Nyström, Dept. of Forest Resource Management, SLU, Umeå.Participants: Elfving Björn, Dept. of Forest Ecology and Management, SLU, Umeå.Project aim<strong>The</strong> core components in the <strong>Heureka</strong>-system are the growth models,which predict the development of the tree layer during the projections.<strong>The</strong> modeling of regeneration establishment and early growth is basedon an individual-tree approach, in accordance with the general approachin the <strong>Heureka</strong> system.In Sweden, about a third of the productive forest area consists of bareland or stands younger than 30 years. <strong>The</strong>refore, in forest scenario analysis,it is essential that accurate predictions of the regeneration successand development of young stands can be made. Results of regenerationin terms of stand density, species mixture and height evenness vary considerablydepending on regeneration practices and site conditions. Thus,the regeneration success and early development are fundamental determinantsof the future stand state and consequently of central significancefor issues regarding yield and environmental aspects in the long term.<strong>The</strong> main objectives of the project were to implement and increase theflexibility of our tools for stand establishment by developing functions tomodel:• <strong>The</strong> new plant population after simulated regeneration cuttings and onbare land in a given initial state.• Individual trees from stand level data in existing seedling stands.• Implementating and checking existing growth simulators for the reliabilityof their early growth predictions.Methods used in the projectStand establishmentIn most growth simulators for management planning it is necessary tosimulate the regeneration success and early development of the establishedseedlings before the actual growth modeling can start. <strong>The</strong>re aretwo options to generate a new plant population after harvest.One approach to model regeneration success is by imputation of theexpected initial state, e.g. by selecting a single plot with desired characteristics.This approach was used by Elfving (1977, 1990) and evaluatedfor the Hugin system and has now also been incorporated in <strong>Heureka</strong>`stoolbox. <strong>The</strong> regeneration success is described in terms of the expectedstocking at 12 years total age as a function of regeneration method, sitepreparation, and site conditions. Once the regeneration success has beenestimated, tree or stand characteristics must be assigned before thegrowth modelling can start. <strong>The</strong> relationship between expected stocking(ASLU) following regeneration and the expected state at 2-3 metersmean height is expressed by an index (Stand quality index, 0-100), which34
expresses the expected potential influence of stand density, species compositionand height variation on future growth. <strong>The</strong> stand quality index isthe key variable as a predictor for the estimation of the new generation. Asample plot with tree data is assigned (from a database) to target stands,based on the estimated stand quality index (Uk). To account for the effectsof random variables involved in stand establishment, a random componentis added to the predicted mean of the relationship between expectedstate of the tree-layer in the young stand and estimated regenerationsuccess.A second approach to modeling stand establishment is to estimate theexpected status of the established young stand by a set of hierarchically linkedfunctions. This approach has been used in the project to simulate “synthetic”plant populations. <strong>The</strong> Weibull distribution was used to characterize specieswisefrequency distributions for initial heights of established seedlings. <strong>The</strong>user specifies the mean height (the default in <strong>Heureka</strong> is 2 meters) of themain species according to current regeneration methods. An expected treelist at 2-3 meters mean height of established seedlings is then created stepwiseby applying the sub-models listed below;• Estimate the expected regeneration result, Uk=ƒ(ASLU,method). This isthe key variable and is the same in both methods, imputation and simulation.• Estimate the expected total number of established seedlings per hectare.• Estimate the proportions of conifers and broadleaves.• Estimate the expected tree species composition (i.e. proportions of Norwayspruce, Scots pine, birch, etc.)• Estimate the expected mean height and height variation for each tree speciespresent.<strong>The</strong> mean height of main species is determined according tospecifications for the simulation.• Estimate for each species the shape and scale parameters for the 2-parameterWeibull probability density function given the estimated mean heightand height variation.• Finally, individual trees are generated (species, heights) by using the Weibulldistribution to randomly select tree characteristics given the estimatedparameters for the distribution.Separate models have been developed for the following regeneration methods:planting, (Scots pine, Norway spruce, and Pinus contorta), direct seedingand natural regeneration (Scots pine) with or without seed trees. <strong>The</strong> submodels used to build up an initial stand structure are evaluated independentlyof each other. However, mixed modeling techniques were used in modelformulation and parameter estimations to capture the within- and betweenstandvariability in the data used for parameter estimation. <strong>The</strong> within-standvariation in number of stems and proportions of conifers and broadleavesresulting from a stochastic simulation for a spruce plantation is illustrated inFig 11.35
Figure 11. Number of stems per hectare distributed over the species groups conifers and broadleaves.<strong>The</strong> figure illustrates the within-stand variation obtained from 10 realizations with astochastic setting of the regeneration models. Initial state at 2 meters mean height for a spruceplantation planted with 2500 plants per hectare.Existing seedling standsModels have also been evaluated in the project to create individual tree datain stands with an existing seedling population not described by individualtrees. In current inventories describing young stands, the tree layer is oftendescribed in an aggregated way. This kind of stand-level information on theinitial state is common in many data sources, e.g. forest management plans. Indata from the NFI since 2003 seedlings with a less than 4 cm in diameter atbreast height are only registered on two small plots per site (radius = 1 m) infour classes species-wise. <strong>The</strong> numbers of stems are registered in two heightclasses for trees less than 1.3 meters tall and two diameter classes for trees atleast 1.3 meters tall. To overcome the high variability due to the small sampleplot size associated with the seedling information and the mixed classificationsof tree sizes, we decided to use the registration (description) of heightlayers occurring on the NFI-plots. <strong>The</strong> description of existing height layersrefers to trees within 20 meters from the plot center. In height layers lessthan 7 meters, the seedling (tree) populations are described by the numberof stems, mean height, and species composition. <strong>The</strong> height distribution ofthe initial stand is generated by regression models that predict the parametersfor a Weibull distribution as a function of mean height and height variationwithin the stand (cf. Fahlvik et al. 2005). Separate regression models are usedfor different forest types defined by species composition. <strong>The</strong> height variationis defined by the coefficient of variation and is estimated by additional func-36
tions, mainly using current forest type and mean height. An overview of theindividual tree data initialization in the stand establishment phase is given inFig. 12.Figure 12. Overview of the stand establishment phase in <strong>Heureka</strong>. On bare land at the initialstate or following simulated future regeneration cuttings, a new plant population (individualtree list) is generated (user-defined option) by simulation of species-wise height distributionsor by imputation of a sample plot with tree data. On sites with established regeneration at theinitial state, available inventory data are used. If the data only consists of stand-level informationthere is an option to create individual tree data from height distributions.Early growthAfter the stand regeneration is established and individual tree descriptions aregenerated or obtained from inventory data (i.e. tree species and height), thegrowth forecasts can start.<strong>The</strong> early development of young stands to the pole stage (i.e. mean-heightof approximately 7-8 meters) is projected using a model developed by Elfving(1982). <strong>The</strong> growth simulators in young stands are based on height-agecurves for the main crop trees. <strong>The</strong> height development for a single treeon the plot is derived from functions describing relationships between theheight development of main crop trees on the plot, the stand density, and thesocial position of the individual tree. Diameter, age (Nyström and Söderberg,1987) and volume are estimated from static relationships using height as animportant variable. Mortality and damage are predicted by a partly stochasticmodel (Näslund, 1986).37
Additional sub-models are also included in the growth simulator to simulatethe effects of pre-commercial thinning, intensive fertilization and use ofgenetically improved material.User value<strong>The</strong> new options evaluated within the project for modeling and predictinga new forest population following harvest or from stand level inventory dataimprove our possibilities to make realistic forecasts of tree layer developmentduring stand establishment up to 7-8 meters. Building up the expectedtree layer composition hierarchally and eventually simulating single trees byheight distributions gives the users great opportunities to calibrate (adjust) therelationships to their own reference data or future expectations regarding thenumber of stems per hectare, tree species proportion and height variation.Scientific resultsNo scientific reports have been published during the project period. <strong>The</strong>aim is to present evaluated models in a report “Growth models for predictingstand development in the <strong>Heureka</strong> system” (Elfving et al., in prep).Fulfillment of objectives<strong>The</strong> models were developed to be directly applicable in the <strong>Heureka</strong> system,and the input variables are restricted to variables that are measured or assessedin practical forest inventories today. Implemented tools for stand establishmentand early growth form a solid base for flexible analyses from theregional down to the stand level, well in line with the main objectives forthe project. However, there is still much work to do regarding new functionalityand tests of the models against new empirical data. As yet <strong>Heureka</strong>does not distinguish between different broadleaved species during simulationsof the establishment of new populations. An aim is to introduce functions toallow this using current data from the NFI and/or data specified by the user.38
ReferencesPopular science publicationsNyström, K. (2008). Beståndsetablering. In: <strong>Heureka</strong> – Årsrapport 2007.Nyström, K. (2009). Beskrivning av existerande plant- och ungskog: ett delvis snårigtkapitel. In: <strong>Heureka</strong> – Årsrapport 2008.External referencesElfving, B. 1977. Fältundersökning i ungskog. – Resultat av pilotstudier 1976. Swed.Univ. of Agri. Sciences, Faculty of Forestry, Umeå. Projekt HUGIN, Rapport 1, 39 pp.(In Swedish)Elfving, B. 1982. HUGIN´s ungskogstaxering 1976-1979. Swed. Univ. of Agri. Sciences,Faculty of Forestry, Umeå. Projekt HUGIN, Rapport 27, 87 pp. (In Swedish)Elfving, B. 1992. Återväxtens etablering och utveckling till röjningstidpunkten. SLU,Institutionen för skogsskötsel. Arbetsrapport nr 67. ISSN 0281-7292. (In Swedish)Fahlvik, N., Agestam, E. Nilsson, U and Nyström K. 2005. Simulating the influence ofinitial stand structure on the development of young mixtures of Norway spruce andbirch.Nyström, K. and Söderberg, U. 1987. Tillväxtberäkningen för ungskog i HUGIN-systemet.En kontroll med data från återinventerade ungskogsytor. SLU, Institutionen förskogsskötsel. Arbetsrapport nr 18. ISSN 0281-7292. (In Swedish)Näslund, B.-Å. 1986. Simulation of damage and mortality in young stands and associatedstand development effects. Dept. of Silviculture, Univ. of. Agri. Sciences, Umeå. Report18, 147 pp. ISSN 0348-8969. (In Swedish with English summary)39
Impact of climate change on tree growthProject leader: Michael Freeman, Dept. of Ecology, SLU, UppsalaProject aimSilvicultural decision support systems for today’s forest management mustbe capable of dealing with the fact that environmental conditions for forestgrowth are currently changing and most likely will continue to changethroughout the next century. Traditionally, empirical growth and yield modelsbased on historical growth data and historic environmental conditions havebeen used to make good predictions of forest timber production. However,when the environment changes the empirical models evidently become lessreliable.<strong>The</strong> main objective of this project was to develop a model that incorporatesthe effects of climate change into the statistical growth and yield modelsused to forecast forest growth and integrate it as an option in the <strong>Heureka</strong>system. A critical function of the model was that it should be able to accountfor the primary effects of climate change on tree growth, and feedback fromthe climatic effects on soil fertility. Secondary effects like changed risks forpests or wind throw were not considered.Methods used in the projectTo deal with the implications of climate change, a process-based model wasused. <strong>The</strong> strength of the process-based model is that it incorporates a mechanisticdescription of the interaction with the environment, which makes itresponsive to changes in environmental conditions. However, while the process-basedmodel can reliably integrate the effects of environmental conditionson individual processes, it may be less reliable when extrapolated to thegrowth of specific tree compartments. For this reason a traditional empiricalgrowth and yield model was combined with the process-based model. <strong>The</strong>strength of the empirical growth model is its foundation on historical yielddata on which site-specific determinants are derived and thus its capability toprovide reliable estimates for timber yield. In this project, a hybrid model wasdeveloped that combines the best features of both models by using the process-basedmodel to generate biologically realistic responses to climate changeas input for the empirical model.Model development<strong>The</strong> process-based model BIOMASS (McMurtrie et al. 1990) was used togenerate relationships between tree growth and climate change. <strong>The</strong> modelhas been adapted to and validated for Swedish conditions in a number ofstudies (e.g. Bergh et al. 1998, Freeman & Linder 2001, Bergh et al. 2003,Freeman et al. 2005). Tree growth was simulated in response to changes inatmospheric CO 2concentration, air temperature, air humidity and precipitation.Soil water conditions were dealt with in the process-based simulations,whereas the relationship of soil fertility to temperature change was evaluatedempirically, based on data from the Swedish National Forest Inventory. <strong>The</strong>40
identified relationships were used to adjust the statistical growth and yieldmodel. <strong>The</strong> modelling covered a range of stand types and growing conditionsfor the main tree species spruce and pine.A method of linking the results from the process-based model and thestatistical growth and yield model was developed. <strong>The</strong> method is based onthe concept of adjusting an intrinsic tree age in the empirical growth modelto target the relative changes in the growth potential found by the processbasedsimulations, e.g. when trees are growing better they are regarded asyounger and more vital. <strong>The</strong> adjustment of the growth potential occurs inevery 5-year period to take into account the stage of the stand developmentand thus the effects of management.Climate scenarios<strong>The</strong> simulations of the climate change responses of tree growth were basedon four climate scenarios generated by the regional climate model RCA3developed by the Rossby Centre of the Swedish Meterological and HydrologicalInstitute (SMHI) (Kjellström et al. 2005, 2009). RCA3 was used todown-scale the results of two global circulation models, forced by IPPCemission scenarios: ECHAM5 (emission scenarios A2, A1B, B1) and Had-CM3 (emission scenario A1B), according to SMHI’s recommendations tocapture a range of variation in the predictions of climate change.User valueToday, most researchers agree that the global climate is changing. If so, theempirically-based statistical growth and yield models will not give validestimates without adjustments. Including the effects of a changing climatein long-term planning is vital to make the right decisions for the future (cf.Freeman et al. 2005). Choices of species, thinning regime and age for finalfelling are examples of decisions that have to be reconsidered in a changingclimate. Valid forecasting of the development of the tree layer is crucial forreliable predictions of the outcome of all the goods and services associatedwith the tree layer that is provided by the <strong>Heureka</strong> system.Scientific resultsProcess-based model simulations were used to estimate the effect of elevatedCO 2, temperature and changed patterns of humidity and precipitation on netprimary production for Norway spruce and Scots pine covering all of Swedenin an approx. 50x50 km grid. Based on these simulations climate changeresponse factors were generated specifically for Swedish conditions (Figure13) (Freeman & Sahlée 2009) as an improvement of the Scandinavian simulations(Bergh et al. 2009). Response functions were developed to transfer theclimate change signal from the process-based model to the statistical growthand yield model based on these factors. <strong>The</strong> functions of the climate changeresponse were finally used to adjust the growth forecasted by the statisticalmodel (Freeman, Wikström & Elfving 2009).41
abFigure 13: Potential relative increase in growth of Norway spruce in 2070–2100 relative to1961–1990 for stands with LAI = 6 and intermediate soil water holding capacity for fourdifferent climate scenarios: ECHAM5 and HadCM3 both with the emission scenario A1B (aand b, respectively) and ECHAM5 with additional emission scenarios A2 and B1 (c and d,respectively). In the <strong>Heureka</strong> system the response is modified according to the actual LAI, soilwater holding capacity and soil fertility of the simulated stand.cdabcdFigure 14: Potential relative increase in growth of Scots pine in 2070–2100 relative to1961–1990 for stands with LAI = 3 and intermediate soil water holding capacity for fourdifferent climate scenarios: ECHAM5 and HadCM3 both with the emission scenario A1B (aand b, respectively) and ECHAM5 with additional emission scenarios A2 and B1 (c and d,respectively). In the <strong>Heureka</strong> system the response is modified according to the actual LAI, soilwater holding capacity and soil fertility of the simulated stand.42
Fulfilment of objectives<strong>The</strong> goal of developing a model of tree growth that takes into account effectsof climate change was successfully achieved and the model was implementedin the <strong>Heureka</strong> system. <strong>The</strong> climate response works well in accordance withthe tree- and site-specific parameters used to drive the statistical growth andyield model. However, the question of how soil fertility will develop underclimate change is uncertain. <strong>The</strong> sub-model that describes the change infertility in response to temperature was based on inventory data. A directcoupling of tree growth to soil nitrogen available for growth, and subsequentresponse to climate change, however, was desired but not accomplished. Afuture research challenge is to develop a closer relationship between the treegrowth model and the soil model available in <strong>Heureka</strong>.ReferencesScientific articlesBergh, J., Freeman, M. & Räisänen, J. 2009. Modelling regional effects of global changeon net primary production in Scandinavia. Manuscript in prep.Elfving, B., Freeman, M. & Mörling, T. 2009. Correlation between weather conditionsand tree growth for Scots pine and Norway spruce in northern Sweden 1980 – 2001.Manuscript in prep.Freeman, M. & Sahlée, E. 2009. Effects of climate change on net primary production ofSwedish forests. Manuscript in prep.Freeman, M., Wikström, P. & Elfving, B. 2009. Adjustment of an empirical growth andyield model to account for effects of climate change on forest production. Manuscript inprep.Working papersFreeman, M. & Elfving, B. 2005. Empiriska produktionsmodeller och klimatförändringar– tillämpning avprocessbaserad modellering (Empirical growth models and climatechange – applying process based modelling). Report.Conference proceedingsElfving, B., Freeman, M. & Mörling, T. 2005. Correlation between weather conditionsand tree growth for Scots pine and Norway spruce in northern Sweden. In: (Innes, J.L.,Edwards, I.K., and Wilford, D.J. eds.) Forest in the balance: Linking tradition and technology,XXII IUFRO World Congress, 8–13 August, Brisbane, Australia. Abstracts. InternationalForestry Review, Vol 7(5), No 28, August 2005.Freeman, M., Wikström, P. & Elfving, B. 2008. Adjustment of an empirical growth andyield model to account for effects of climate change on forest production. In: Adaptationof Forests and Forest, Management to Changing Climate with Emphasis on ForestHealth: A Review of Science, Policies and Practices, Book of Abstracts, InternationalConference, Umeå, Sweden 25-28 August 2008.Popular science publicationsFreeman, M. 2005. Skogens produktion ökar när klimatet blir varmare (<strong>The</strong> forest productionincreases when climate turns warmer) In: Ingemarson, F. (Ed.) 2005. Har skogenmer att ge? <strong>Heureka</strong> årsrapport 2004. Fakulteten för skogsvetenskap, SLU. Rapport nr20. Umeå. 75–82 (In Swedish).43
External referencesBergh, J., Freeman, M., Sigurdsson, B.D., Kellomäki, S., Laitinen, K., Niinistö, S., Peltola.H. & Linder, S. 2003. Modelling the short-term effects of climate change on the productivityof selected tree species in Nordic countries. Forest Ecology and Management 183:327–340.Bergh J., McMurtrie R.E. & Linder S. 1998. Climatic factors controlling the productivityof Norway spruce: a model-based analysis. Forest Ecology and Management 110:127–139.Freeman, M. & Linder, S. 2001. Boreal forests. In: Long-term effects of climate changeon carbon budgets of forests in Europe (eds. Kramer, K. & Mohren, G.M.J.) pp. 197–203.Alterra-report 194. Alterra, Green World <strong>Research</strong>, Wageningen, 2001Freeman, M., Morén, A.-S., Strömgren, M. & Linder, S. 2005. Climate Change Impactson Forests in Europe: Biological Impact Mechanisms. In: Management of European Forestsunder Changing Climatic Conditions (eds. Kellomäki, S. and Leinonen, S.). <strong>Research</strong>Notes 163, University of Joensuu, Forest Faculty, pp. 45-115. ISBN 952-458-652-5Kjellström, E., Bärring, L., Gollvik, S., Hansson, U., Jones, C., Samuelsson, P., Rummukainen,M., Ullerstig, A., Willén U. & Wyser, K. 2005. A 140-year simulation of Europeanclimate with the new version of the Rossby Centre regional atmospheric climate model(RCA3). Reports Meteorology and Climatology, 108, SMHI, SE-60176 Norrköping,Sweden, 54 pp.Kjellström, E., Nikulin, G., Hansson, U., Strandberg, G. & Ullerstig, A. 2009. 21st centurychanges in the European climate: uncertainties derived from an ensemble of regionalclimate model simulations. Manuscript in prep. for Tellus.McMurtrie, R.E., Rook, D.A. & Kelliher, F.M. 1990. Modelling the yield of Pinus radiataon a site limited by water and nitrogen. Forest Ecology and Management 30: 381–413.44
Soil biogeochemical modellingProject leader: Johan Stendahl, Dept. of Soil and Environment, SLU, Uppsala.Project aim<strong>The</strong> aim of this project was to provide models for the cycling of soil carbon(and nitrogen) and the weathering of soil minerals. <strong>The</strong>se are important processesto model in order to evaluate the impact of forestry on: (1) the balanceof greenhouse gases between land and atmosphere, (2) nutrient sustainabilityand (3) the acidification of soil and water.Methods used in the projectInitially soil models were evaluated to identify suitable models for the <strong>Heureka</strong>system based on: (1) spatial resolution, (2) input data demands, (3) executiontime, and (4) availability of the models. To implement the models in the<strong>Heureka</strong> system, decisions had to be made about the level of integration,i.e. full integration, model simplification or meta-modeling. <strong>The</strong> soil carbonmodel could be fully integrated in the system. <strong>The</strong> accumulation of carbonin the soil depends on the input of litter to the soil and the decomposition ofsoil organic matter. To facilitate the input of litter to the soil carbon model,a separate model for litter production was developed to provide the link tothe forest model. Further, the model was adopted for different soil moistureconditions. For the mineral weathering model it was not realistic to supplyall necessary input data on mineralogy etc. for each forest stand included inan analysis or planning process. Thus, instead of a full integration with thesystem, a method was adopted to supply the weathering rate values based ona spatial database of baseline weathering rates, which may be adjusted to localsite conditions. <strong>The</strong> database covers spatial variability in weathering rates dueto mineralogical and climatic factors, which are fairly large-scale and may begeneralized to nearby locations.Soil carbon modelingFor soil carbon the Q model was selected for use in the system. This is amechanistic model of the decomposition of soil organic matter (SOM) andis based on the continuous quality theory presented by Ågren and Bosatta(1998). This theory assumes that the SOM changes continuously duringdecomposition and becomes less favourable for the decomposers to assimilate- the quality (Q) of the substrate decreases. <strong>The</strong> quality of different littertypes is also accouted for. <strong>The</strong> yearly input of fresh litter from differenttree fractions, i.e. needles, branches stems etc., is tracked over time and theweight loss due to decomposition is modelled. Decomposition rates for thedifferent litter types are controlled by the initial litter quality, the time ittakes for the decomposers to invade the litter, and environmental factors suchas climate and soil conditions. <strong>The</strong> input to the model is litter fall, which ismodeled from the tree layer development given by the forest model. Thisgives the development of the soil carbon (and nitrogen) over the modellingperiod. <strong>The</strong> main parameter values were set according to Ågren et al. (2007)45
and Ågren and Hyvönen (2003), except for the decomposer growth rate,which was calculated from the mean annual temperature (Ågren & Bosatta1998). Parameter settings for different soil moisture conditions were developedwithin the project.Soil mineral weathering modeling<strong>The</strong> PROFILE model (Sverdrup & Warfvinge 1993) enables site-specificmodelling of the mineral weathering in the topsoil, which is required for usein a spatially explicit planning system such as <strong>Heureka</strong>. <strong>The</strong> weathering rate isestimated for steady-state conditions, which means that it is estimated whenthe soil system reaches equilibrium (weathering+deposition=uptake+leaching)for unchanged environmental conditions. <strong>The</strong> steady-state assumptionmeans that the model does not describe the long-term balance in the systemor thus the long-term average weathering rate. <strong>The</strong> transition state theoryforms the chemical basis of the model and accounts for the chemical reactionsinvolved in the dissolution of the minerals. <strong>The</strong> dissolution reactions ofthe soil minerals must be very well characterized for the theory to hold, butthere are at present no alternatives to describe mineral dissolution (Hodsonet al. 1997). <strong>The</strong> PROFILE model has been widely accepted, especially forcalculations of critical loads (Akselsson 2004; Bertills & Lövblad 2002), andit has been applied in many countries and environments. It has also beenevaluated by sensitivity analysis (Sverdrup & Warfvinge 1993; Hodson et al.1996; Jönsson et al. 1995), and compared with other methods for estimatingweathering rates (Hodson & Langan 1999).User valueSubstantial amounts of carbon are stored in boreal forest ecosystems and thebalance of green house gases between the forest and the atmosphere may tosome degree be influenced by forest management. About two thirds of thecarbon in boreal forest ecosystems is stored as soil carbon, which has ratherslow turnover rates, and changes in this pool are of particular interest for thefuture. As a consequence of international agreements there is an increasingdemand for predicting the development of the carbon stocks in the forestecosystem. <strong>Heureka</strong> includes models for the development of the soil carbon,which enables analyses of the impact of different forest management alternativeson the soil stocks, both above and below ground. <strong>The</strong> model is essentialfor integrated analyses of the green house gas emissions from forestry and forestproducts (Eriksson et al. 2007).<strong>The</strong> long-term sustainability of soil mineral nutrients is a concern dueto the increasing use of forest products, mainly for bioenergy. This leads toa larger removal of nutrients from the forests at harvest, which might leadto nutrient deficits and adverse effects on the acidification status of soil andwater. <strong>The</strong> <strong>Heureka</strong> system estimates the weathering rate and the removalof nutrients by harvest, and the balance between the two indicates the needfor compensation by e.g. ash recycling. This is also relevant for the nationalEnvironment quality goal “Natural Acidification Only”.46
Scientific resultsSoil carbon modeling<strong>The</strong> Q model has not previously been adapted to different soil moisture conditions,although the model includes important processes that vary dependingon soil moisture, such as the decomposer growth rate. A model parameterizationfor different soil moisture conditions was carried out within the project.<strong>The</strong> activity of the decomposers may be limited both by too dry and too wetconditions, but in the Swedish climate decomposition is mainly limited bytoo high soil moisture, which can be seen in the large carbon stocks in thesesoils (Fig. 15). For water logged-soils (hydromorphic soils) the decompositionprocess is very slow and the decomposition process is different in thesesoils due to the anoxic conditions, which limits the use of models for uplandsoils such as the Q model. Although soil moisture is an important factorfor the decomposition there have been surprisingly few quantitative studieson the relationships between these variables in boreal forests. <strong>The</strong> approachused to parameterize the Q model was to utilize data from permanent sitesof the National Forest Soil Inventory (NFSI) and National Forest Inventory(NFI). <strong>The</strong> soil carbon stock was estimated to 50 cm depth in the mineralsoil and the litter-fall was estimated from functions based on the site productionindex. <strong>The</strong> decomposer growth rate was estimated from the relationshipbetween the needle litter input and the carbon stock originating from needlelitter (ca. 25%), assuming that the soil carbon stocks are at equilibrium. Thiswas done for mesic and mesic-moist sites (according to the NFSI classification)by region and the difference in decomposer growth rate could be determined.<strong>The</strong> soil carbon stock was considerably larger for mesic-moist sitescompared to mesic sites (Fig. 15) and the difference was stronger towards thenorth of Sweden. <strong>The</strong> site productivity was lower on mesic-moist comparedto mesic sites (Fig. 16), reflecting the gradient in needle litter fall, which wasused in the estimation of the decomposition rate. <strong>The</strong> decomposer growthrate in the Q model was reduced by the factor 0.67 for mesic-moist sites.<strong>The</strong> results are illustrated by simulations of spruce forest of normal productivity(productivity class G26) at sites with mesic and mesic-moist conditions inthree Swedish regions in Fig. 17. <strong>The</strong> carbon stock was ca 10% larger for themesic-moist conditions after one rotation and in the long-term the differencewill rise to ca. 50%.47
Figure 15. Soil carbon stocks for mesic and mesic-moist sites in three Swedish regions. Estimationsbased on the National Forest Soil Inventory, 1993-2002.Figure 16. Site productivity for mesic and mesic-moist sites in three Swedish regions. Estimationsbased on the National Forest Inventory, 1993-2002.Soil mineral weathering modeling<strong>The</strong> fundamental part of the system that can supply values for base cationweathering in forest stands is a weathering database. <strong>The</strong> database includesdata from ca. 18,000 sites from the National Forest Inventory. For each ofthese sites a baseline weathering rate was simulated using the PROFILE48
model (Fig. 18). In addition, the weathering rate was simulated assumingthree soil moisture classes (dry, mesic and mesic-moist) and two soil textureclasses (sandy silty till and coarse and fine silty), i.e. for six permutations ofsoil moisture and texture. <strong>The</strong>se weathering rates can be used to adjust tolocal site soil moisture and texture conditions. <strong>The</strong> simulations performed toproduce the weathering database are to a large degree similar to those usedfor current reporting under the Long-range transboundary air pollution convention(Akselsson et al. 2007). In order to evaluate different forest managementalternatives, the <strong>Heureka</strong> system also calculates the amounts of nutrientsremoved at harvest based on nutrient concentrations in different tree compartments.Figure 17. Simulated changes in soil carbon stocks at sites with mesic and mesic-moist soilmoisture conditions supporting similar spruce stands with the same site productivity (productivityclass G26).Fulfillment of objectives<strong>The</strong> most important objectives of the project were fulfilled, although the soilweathering database has not yet been implemented. An aspect that was originallyplanned was to include models of the emission of nitrous oxides fromdrained organic forest soils, but these models are perhaps still too uncertainto include in a large-scale system such as <strong>Heureka</strong>. <strong>The</strong> soil carbon modelwould benefit from separating humified soil carbon and less decomposedmaterial or dead wood. Further, recent development of the Q model tocope with a variable climate in scenarios could be incorporated in the future.Finally, an important task for the future is further testing to see if <strong>Heureka</strong>delivers good results in diverse situations.49
Figure 18. Weathering rate ofbase cations (Ca+Mg+K+Na)in forest soils.ReferencesScientific articlesEriksson, E. Gillespie, A.R. Gustafsson, L. Langvall, O. Olsson, M. Sathre, R. & Stendahl,J. 2007. Integrated carbon analysis of forest management practises & wood substitution.Canadian Journal of Forest <strong>Research</strong> 37 (3): 671-681.Stendahl, J. Johansson, M.-B. Eriksson, E. Nilsson, Å. & Langvall, O. 2009. Soil organiccarbon in Swedish spruce and pine forests – differences in stock levels and regional patterns.Manuscript in prep.External referencesAkselsson, C., Fölster, J., Rapp, L., Alveteg, M., Belyazid, S., Westling, O., Sverdrup, H.Stendahl, J. 2007. Underlagsrapport - Reviderade beräkningar av kritisk belastningför försurning. I: Bara naturlig försurning. Bilagor till underlagsrapport till fördjupadutvärdering av miljömålsarbetet. Rapport 5780, Naturvårdsverket.Akselsson, C., Holmqvist, J., Alveteg, M., Kurz, D., & Sverdrup, H., 2004. Scaling andMapping Regional Calculations of Soil Chemical Weathering Rates in Sweden. WaterAir Soil Pollut. 4, 671-681.Bertills, U. & Lövblad, G. 2002. Kritisk belastning för svavel och kväve. Rapport 5174.Naturvårdsverket.Beven, K. J. & Kirkby, M. J. 1979. A physically-based variable contributing area model ofbasin hydrology. Hydrol. Sci. Bull. 24: 43-69.Hodson, M.E. & Langan, S.J., 1999. Considerations of uncertainty in setting critical loadsof acidity of soils: the role of weathering rate determination. Environ. Pollut. 106, 73-81.Hodson, M.E. & Langan, S.J., Wilson, M.J., 1997. A critical evaluation of the use ofthe PROFILE model in calculating mineral weathering rates. Water Air Soil Pollut. 98,79-104.50
Hodson, M.E., Langan, S.J. & Wilson, M.J., 1996. A sensitivity analysis of the PROFILEmodel in relation to the calculation of soil weathering rates. Appl. Geochem. 11, 835-844.Jönsson, C., Warfvinge, P. & Sverdrup, H., 1995. Uncertainties in predicting weatheringrate and environmental stress factors with the PROFILE model. Water Air Soil Pollut. 81,1-23.Sverdrup H. & Warfvinge P. 1993. Calculating field weathering rates using a mechanisticgeochemical model PROFILE. Appl Geochem 8(3) 273-283.Ågren G.I. & Hyvönen R. 2003. Changes in carbon stores in Swedish forest soils dueto increased biomass harvest and increased temperatures analysed with a semi-empiricalmodel. Forest Ecol. Manag. 174. 25-37.Ågren, G.I & Bosatta, E. 1998. <strong>The</strong>oretical Ecosystem Ecology - Understanding ElementCycles. Cambridge University Press.Ågren, G.I. Hyvönen, R. & Nilsson, T. 2007. Are Swedish forest soils sinks or sourcesfor CO2 – model analyses based on forest inventory data. Biogeoch. 82: 217-227.51
BiodiversityProject leader: Lars Edenius, Dept. of Wildlife, Fish and Environmental Studies, SLU,Umeå.Participants: Grzegorz Mikusinski, Dept. of Ecology, SLU.Project aim<strong>The</strong> long-term maintenance of forest biodiversity is one of the fundamentalrequirements for sustainable forest management. This project has developed,tested and delivered a planning tool consisting of habitat suitability modelsfor a set of species to assess effects of forest management on biodiversity.Figure 19. Effects of different forest management plans on the amount (top) and spatial distribution(bottom) of suitable habitat for the red squirrel at different time intervals. All three plansresult in a gradual decrease in the amount of squirrel habitat, plan A being the worst and planB the least bad in this respect.Methods used in the projectA biodiversity assessment tool kit consisting of habitat suitability models wasconstructed for six species/species groups from different taxa, viz. bryo-52
phytes, fungi, lichens, invertebrates, mammals and birds. For each species/species group the most important ecological factors and for most of the speciesminimum area requirements were defined, and these requisites wereparameterized and translated into forest variables. In order to promote abroad coverage of the biodiversity concept, species were selected so as torepresent a wide range of ecologies. For some species habitat requirementswere described solely by site-specific forest descriptors like timber volumeand/or tree species composition, whereas for area-demanding species, thetype and amount of habitat in the neighborhoods were also included. Forestdata used to feed the models are derived from the <strong>Heureka</strong> system, and foreach specific forest state and species/species group habitat suitability scoresare calculated over the planning unit area in an external GIS-interface.User valueOur biodiversity module provides a simple, generic tool for accommodatingbiodiversity conservation in forest management planning. Species themselvesare well-known and comprehensible entities of biodiversity, which facilitatesinterpretation and communication of results. Habitat models are efficienttools for analyzing and communicating effects of different management scenarioson forest biota. Flexibility is built into the module such that users maychange habitat parameters for existing species, and they may also include newspecies or replace existing ones if desired. Habitat suitability scores may betreated equally among species or weighted based on the preferences of theuser, e.g. to facilitate species with limited dispersal ability or specific habitatrequirements, to calculate a joint suitability (biodiversity) score.Scientific results<strong>The</strong>re has been a rapid increase in the use and development of habitat suitabilitymodeling in forest management planning. Important impetus inour work was the strong desire for simple yet scientifically sound and easilyimplementable methods for conservation planning. <strong>The</strong> approach inour project draws on work primarily performed on single species in NorthAmerica. We extended this work and the main outcome and achievement ofthis project is a synoptic tool for multi-species assessment especially designedfor Swedish forests, forest owners and stakeholders. Along with preparingour biodiversity module, we have performed a number of scientific studiesthat tested various methods used in multi-species biodiversity assessment aswell as the reliability of data on species distribution in further improvementof habitat models.A literature review of habitat suitability modeling (Edenius & Mikusinski2006) showed that single-species models are most common, but consideringmany species is more likely to yield useful habitat suitability modeling toolsfor biodiversity planning. Further, use of spatially explicit models scaled tothe ecologies of species improves the ability of habitat suitability models toidentify and quantify functional habitats at different spatial scales. Linkingspecies’ habitat requirements with landscape projection models and scenario53
analysis is an important next step to make habitat suitability models moreefficient as planning tools in forest management.We examined the spatial functionality of old spruce-dominated forest inseveral regions of Sweden through the perspective of organisms with differentecologies, in terms of their area requirements and mobility (Mikusinski &Edenius 2006), using virtual species representing a gradient of these two ecologicaltraits. <strong>The</strong> main tool was habitat suitability modeling. Countrywideestimates of forest variables derived from satellite data and field data from theNational Forest Inventory using the kNN-method (k-Nearest Neighbor)were used as sources of habitat distribution data. We found large regionalvariations in old spruce forest functionality depending on natural conditionsand forest history. <strong>The</strong> relationship between functionality and amountwas largely curvilinear. Areas with >10% of old spruce forest generally havehigh levels of spatial functionality, whereas high variation in functionalitywas observed in areas with little old spruce forest cover. We found that ourmethod for multiple-scale assessment of old forest functionality may be helpfulin regional forest biodiversity planning.Effective management of biodiversity in production landscapes requires aconservation approach that acknowledges the complexity of ecological andcultural systems in time and space (Mikusinski et al. 2007). This includesextensions of current methods for conservation planning to consider therelative contributions to conservation objectives of different forms of management,the effects of changes in land use, and the requirements for practicalimplementation. As a contribution to meeting the challenge posed byCountdown 2010, we presented an example of a planning exercise that useda spatially explicit conservation planning tool to incorporate the knowledgeof regional experts on biodiversity. We placed this exercise in the context ofthe requirements of Countdown 2010 by presenting a general framework forforest conservation planning.Using an extensive data-set of species occurrences and forest and landscapevariables, we analyzed the habitat-occurrence relationships of nineresident boreal forest bird species in Sweden (Edenius et al. submitted). Wedecomposed the variation at different sampling units and tested the effect ofhabitat on bird occurrence at different spatial scales using generalized mixedeffects models (GLMMs). <strong>The</strong> ability of the habitat variables to explain theoccurrence patterns was highly variable. Large variation at the smallest scalesuggests that further research should be directed towards understanding theimportance of both fine-scale variation in habitat suitability and detectionprobability in order to increase the predictive power of species-habitat models.We have demonstrated the usefulness of our biodiversity assessmentapproach in case studies covering regional conservation planning at countyscale (Örebro) and long-term planning at the forest estate level (Remningstorp,Sundsvall, Krycklan). We have also co-operated within the <strong>Heureka</strong>program, by participating in efforts to find optimal solutions to combine high54
forest net value revenues and the promotion of habitats for selected speciesfor finding optimal solutions. Results from the project have been communicatedin a number of peer-reviewed papers, public reports (Faktablad), seminarswith forest owners, forest managers, forestry authorities and other stakeholders,NGO’s, and over the internet.Fulfillment of objectives<strong>The</strong> biodiversity assessment module has been developed and delivered. Specieshabitat requirements have been translated into forest data such as thevolume (age) of main tree species, i.e. data readily available and frequentlyused in forest management planning. <strong>The</strong>se variables were useful as habitatdescriptors in our habitat models, at least over broader spatial scales. However,a drawback was that we could not predict finer scale distributions ofmodel species. Moreover, due to a lack of reliable data on the amount anddistribution of coarse woody debris, we were forced to limit the number ofspecies dependent on dead wood. This was unfortunate since the majorityof threatened species in the Swedish forests are saproxylic. We thereforehope for better data on this substrate in future. Also, data on individual trees(diameter) would be helpful in developing refined models built on foreststructural characters.ReferencesScientific articlesMikusinski, G. & Edenius, L. 2006. Assessment of spatial functionality of old forest inSweden as habitat for virtual species. Scandinavian Journal of Forest <strong>Research</strong> 21 (Suppl.7): 73-83.Edenius, L. & Mikusinski, G. 2006. Utility of habitat suitability models as biodiversityassessment tools in forest management. Scandinavian Journal of Forest <strong>Research</strong> 21(Suppl. 7): 62-72.Mikusinski, G., Pressey, R. L., Edenius, L., Kujala, H., Moilanen, A., Niemelä, J., &Ranius, T. 2007. Conservation Planning in Forest Landscapes of Fennoscandia, and anApproach to the Challenge of Countdown 2010. Conservation Biology 21: 1445-1454.Edenius, L., Mikusinski, G., et al. Matching national bird breeding surveys with foresthabitat data: influence of spatial and structural components of the data (submitted to Ecography)Öhman, K., Edenius, L., Mikusinski, G. Optimizing spatial habitat suitability and timberrevenue in long-term forest planning: a case study of the habitat demands of HazelGrouse (submitted to Canadian Journal of Forest <strong>Research</strong>)55
Conference proceedingsMikusinski, G., Edenius, L. & Ståhl, G. Linking species requirements with landscapeinformation in forest biodiversity management – some examples of European experiencesin habitat suitability modelling. Abstract for IUFRO World Congress, 8-13 August2005, Brisbane, Australia.Popular science publicationsEdenius, L. & Mikusinski, G. (red. Ann-Sofie Morén). 2004. Planeringsverktyg för biologiskmångfald. Miljötrender från SLU, 2004, 3-4, s. 14-15. www-miljo.slu/dokument/mt/MT3-4_04.pdf.Edenius, L. & Mikusinski, G. (red. Ann-Katrin Hallin). 2004. Framtida skogslandskap urarters perspektiv. Miljöaktuellt 2004.Edenius, L. & Mikusinski, G. Biologisk mångfald. 2004. Sammanfattning från Skogskonferensen,SLU, Uppsala 30 nov–1 dec 2004.Edenius, L. & Mikusinski, G. 2004. Sammanfattning från <strong>Heureka</strong>s vårexkursion, Remningstorp13 maj 2004.Mikusinski, G. Edenius, L. 2005. Skattning av effekter på biologisk mångfald. Reserapport- arbetsmöte mellan forskningsprogrammen CLAMS och <strong>Heureka</strong>, 9-11 sep 2004,Corvallis, Oregon, USA.Edenius, L. & Mikusinski, G. 2005. Planeringsverktyg för biologisk mångfald i morgondagensskogar. FaktaSkog No. 2, 2005.Edenius, L. & Mikusinski, G. 2005. Planeringsverktyg för biologisk mångfald. Pages89-95, in (Ingmarson, F.) Har skogen mer att ge? <strong>Heureka</strong>programmets årsrapport 2004.Mikusinski, G. Edenius, L. 2007. Zonation testas i Örebro län. <strong>Heureka</strong>programmetsårsrapport 2006, p. 10-11.Edenius, L. & Mikusinski, G. 2008. Habitat förutsäger biologisk mångfald i skogslandskapet!Årsrapport, <strong>Heureka</strong> 2007, p. 13-14.Öhman, K., Edenius, L. Eriksson, L.-O. & Mikusinski, G. 2008. Habitatmodeller ochflermålsanalys - en väg till effektivare planering av skogsbruket. Fakta Skog No. 5, 2008.56
Wood propertiesProject leader: Lars Wilhelmsson (2008-2009); Lennart Moberg (2006-Jan 2008),(both Skogforsk)Participants: Björn Hannrup, Johan Möller, John Arlinger and Maria Nordström(all Skogforsk)Project aim<strong>The</strong> main objective of forestry is to produce high and sustainable economicgain at low environmental impact. In regular situations incomes will comefrom selling or supplying wood. <strong>The</strong>refore the estimation of potential grossandnet values of the typical products, i.e. logs and biomass adapted to customersdemands is essential. A number of stem, wood and fibre propertieshave been shown to influence process efficiencies and functional propertiesof final products. Consequently, the potential economic and environmentalvalue of information on raw-material properties is considerable.<strong>The</strong> use ofmodels to predict wood quality attributes, and the application of such modelsin conversion simulation systems, has been recognized as a viable method tolink end users’ product requirements and process efficiencies with propertiesof the forest resource.<strong>The</strong> objectives of phase II of this project have been:• to further test, improve and supplement models for wood and fiber propertiesthat can be implemented in <strong>Heureka</strong> and related to process efficiencyand/or properties of end-products.• to develop and implement the concept of tree-pricing for valuation ofproduced wood in both short-term and long-term perspectives.Methods used in the projectWe have developed/selected and applied mixed models based on deductiveand statistical model approaches, including fixed and random effects:• We have prioritized industrially relevant, basic stem, wood and fiber propertieswith respect to available models and experimental materials.• An additional set of models has been developed based solely on a deductiveapproach and these models have not yet being validated.• All models included are based on commonly available or predictable inputvariables that are used in routine forest inventories and have been adapted(or could easily be adapted) to Swedish/Scandinavian forestry conditions(Species: Norway spruce and Scots pine).• In principle the same models can also be used in real harvester productionreports using StanForD pri-files (StanForD2010 hpr-messages).• <strong>The</strong> introduction of tree-pricing provides a flexible tool for general grossvaluation of standing trees. <strong>The</strong> system is based on tree size, frequencies ofdamage and faults combined with stem segmented valuation of wood andfibre properties.57
• Default segmentation of stems according to size and valuation of woodproperties results in prices that are close to valuations in common pricelistsbased on VMR 1-07.• Valuation of trees with different wood and fiber properties can be basedon a value index expressed by economic weights. <strong>The</strong> user should also beable to alter both the segmentation and the economic weights of differentproperties for different scenario analyses.In the tree-pricing concept short-term perspectives should provide estimatesof payment to forest owners reflecting normal price levels in the presentwood market. Long-term perspectives should include possibilities to generatescenarios in which stems can be valued differently from today. This shouldinclude options to alter the limits of stem sections, the frequencies of damageand faults and the values of different properties. In tree-pricing all parts ofthe tree can be valued. In addition to the stem, branches, needles stumps andbark can also be included in the valuation.User valueForestry is justified by incomes from forest products. <strong>The</strong>se are dependenton their fit to consumers demands with respect to volumes and propertiesof produced logs. This information in combination with cost estimates forharvesting, forwarding and haulage to different industrial sites provides a basisfor optimisation of the forest resources, including estimates of environmentalload.Scientific results<strong>The</strong> set of models for characterizing stems and logs in <strong>Heureka</strong> has beenexpanded by the following models:1. Modulus of elasticity (MOE) and (MOR) of centerboards originating fromNorway spruce sawlogs (Fig. 19) (Hannrup et al. manuscript)2. Models of green density at harvesting (Wilhelmsson et al. manuscript)3. Models for conversion of basic density to Density at 12 % MC (includinga shrinkage effect on volume and weight effect of water) (Wilhelmssonunpublished).4. Models for calculation of fibre collapse resistance (Wilhelmsson (2008) furtherdeveloped from Jonsson (1979))5. A number of additional models for bark density, carbon sequestration etc.<strong>The</strong> concept of tree-pricing is based on generic tree and stand characteristicsfeeding models for predicting stem, wood and fiber properties. <strong>The</strong> resultscan be used in decision support systems for controlling wood supply in termsof key timber indicators such as economic value, raw material consumption,energy requirements and environmental impact. <strong>The</strong> basic propertiesare weighted according to their influence on each key timber indicator. <strong>The</strong>actual property values for a given stem or stem-section (i.e. present sawlog/58
pulpwood energy wood sections) are then related to norm values which aredetermined for a larger region. <strong>The</strong>se norm values can be calculated usingdata from the Swedish National Forest Survey. <strong>The</strong> resulting index quantifiesthe benefit (e.g. economic value), or load (e.g. environmental impact such asemissions) that each raw material component represents. This entity can theneasily be implemented in the goal function, or in a restriction, of optimizationalgorithms. <strong>The</strong>y can also be used in a more passive description of thewood supply over a given time period for an individual mill, for deliveriesin a defined region, or aggregated to the national level. A similar valuationconcept, but more closely adapted to specific customers’ demands and operationalplanning is now under development at Skogforsk, but not within the<strong>Heureka</strong> framework.Figs. 20-22 show examples of the characterisation of different wood propertiesby means of models included in <strong>Heureka</strong>.)*+,-.*/#01/-2-,#13#*2+,45678#9):+;#(&"""#(%"""#%$"""#%!"""#%'"""#%&"""#%%"""#$"""#!"""#=0>39:.*/657*/#/*?,678@#A*6BA7#6?#7A*#,7*0;#C ( >"@DD#C)E=>%F!"#)
($"#(!"#'$"#'!"#&$"#&!"#%$"#%!"#$"#!"#)*+#,-./0,--/1#23-4/# 5-*36#23-4/# 7*,89131:.;#:11#?341:3-61/#@?.A#A1B:4C--6#D-34134#Figure 21. Proportions of log volumes of different assortments and quality classes. Resultsfrom bucking simulations of plots from the Swedish National Forest Inventory in Västerbotten(2001-2005). Analyses performed within the Indisputable key & Eforwood projects(Wilhelmsson et al. 2009).kg/m sub or mm*10500400300200+ within 95%Basic dens kg/m sub- within 95%+ within 95%Kdmax *10 (mm)- within 95%10055 58 61 64 67Latitude °Figure 22. Results from combining input data from the Swedish National Forest Inventory(2001-2005) from all of Sweden, bucking simulations with TimAn2 and models for predictingbasic density (Wilhelmsson et al. 2002) and maximum knot size (kdmax)(Moberg 2000).60
Table 1. Properties that can be predicted (calculated) by PriAnalysis (Skogforsk), demonstrationsoftware built on the same models as delivered to <strong>Heureka</strong> and current implementaton.Description of propertyBasic density under bark, kg/m 3 s.ub.Heart wood diameter, mmHeart wood proportion, %Double bark thickness, mmLatewood proportion, %Number of annual (growth) ringsFibre length, mmFibre wall thickness, µm*100Maximum knot diameter, mm*100Proportion of green knots at surface, %Green density under bark, kg/m3s.ub.Green bark density, kg/m3 (solid)Sound knot log top cylinder (only includes sound knots)Solid volume under bark, dlSolid volume over bark, dlStanForD-code indicating whether log was cut manually byoperator (0=automatic)Calculated raw mass of log, kgNumber of growth rings at small end of log (minimum)Number of growth rings at large end of log (maximum)Collapse resistance of fibres. Relative figure (max 1, min =0.05)Wood density at 12% MC (by dry weight and actual volume)Longitudinal width of average knot whorls in the log, mmAverage NetInternode = average knot-free distance between branchwhorls, mmProportion of knot-free wood between branch whorls in percent of totallength, %Modulus of Rupture (Centerboards of Spruce) (MPa)Modulus of Elasticity (Centerboards of Spruce) (MPa)Bark percentage based on volume over barkSequestrated carbon per m3 woodSequestrated carbon in log (excluding bark)Sequestrated carbon in bark, kgSequestrated carbon in bark per logRequired volume to sequestrate one ton carbon m3ob.To be implementedin <strong>Heureka</strong>XXXXXXXXXXXXXXXXXXX61
Fulfillment of objectives<strong>The</strong> objectives to develop models for predicting wood and fibre propertiesof industrial relevance and incorporate them in <strong>Heureka</strong> have been fulfilled.Additional analyses can be performed by model software from Skogforsk(TimAn2 , PriAnalyses, SAS-programmes etc.). <strong>The</strong>se programs are based onstandardised StanForD (StanForD2010) production files and can be used forboth bucking simulations and production reports from real harvesters. <strong>The</strong>tree-pricing module in <strong>Heureka</strong> is currently being implemented and we canforesee that these objectives will be fulfilled. Tree-pricing is already operationalin the wood market, and has already been introduced and practiced bySveaskog and Södra (Fig. 23).Tree pricing by harvester / Log pricing at industry by VMF (%)115%110%105%100%95%90%85%Average price per m s u.b.Tree price including downgradingTree price incl downgrading and qualitypredictions1 3 5 7 9 11 13 15 17 19 21 23 25 27 29 31Compared objects sorted in order of deviations from industry measurementsFigure 23. Total relative value (%) of Scots pine wood from 31 objects in Sweden valued bytree-pricing (calculated from harvester production files) and industry measurements by VMF(VMR 197). (Möller et al. 2006).In memoriamLennart Moberg, PhD, passed away unexpectedly on the 31st of January2008. Lennart Moberg’s all too early passing is not only a severe and painfulloss for his family, relatives and friends. It is also a great loss for Swedish forestryresearch. We are among the many that miss him. Thank you Lennart, foreverything you did for us and for the <strong>Heureka</strong> wood properties project.ReferencesScientific articlesIkonen, V-P. Peltola, H. Wilhelmsson, L. Kilpelaäinen, A. Väisänen, H. Nuutinen, T. Kellomäki,S. 2008. Modelling the distribution of wood properties along the stems of Scotspine (Pinus sylvestris L.) and Norway spruce (Picea abies (L.) Karst.) as affected by silviculturalmanagement. Forest Ecology and Management 256. pp 1356–1371.Nuutinen, T. Kilpeläinen, A. Hirvelä,H. Härkönen, K. Ikonen, V-P. Lempinen, R. Peltola,H. Wilhelmsson, L. Kellomäki, S. 2009. Future wood and fibre sources – case North Kareliain eastern Finland. Silva Fennica 43(3). pp 489-505.62
Hannrup, B. et al. (manuscript). Models for predicting MOE and MOR on centerboardsfrom logs of Norway spruce.Wilhelmsson et al. (manuscript) Models for predicting Green density of logs from Norwayspruce and Scots pine.Working papersHannrup, B. et al. (manuscript). Model description MOE and MOR on centerboardsfrom logs. <strong>Heureka</strong>. 4pp.Lanvin, J-D. Bajric, F. Wilhelmsson, L. Moberg, L. Arlinger, J. Möller, J. Bramming, J.Nordmark, U. 2007. D3.2 Existing models and model gap analyses for wood properties.Results from the EU-Integrated Project, Sixth Framework <strong>Programme</strong>, Priority 2, InformationSociety Technologies, n° 34732: INDISPUTABLE KEY. European Commission.51 pp.Wilhelmsson, L. 2007. Model for calculation of fibre collaps resistance. <strong>Heureka</strong> 4 pp.Conference proceedingsArlinger, J., Moberg, L., Möller, J.J. & Wilhelmsson, L. 2009. Automatic timber qualitydetermination using wood property models and harvester measurements. In Dykstra, D.& Monserud, R. (Eds.): Proceedings from the conference “Forest Growth and TimberQuality: Crown Models and Simulation Methods for Sustainable Forest Management”.Portland, Oregon, USA, August 7-10, 2007.Wilhelmsson, L. 2008. Är de nya kubikmetrarna lika värdefulla som de gamla? Dokumentation.Sammanfattningar och Powerpoint-presentationer. Utvecklingskonferens 08,Skogforsk (presenterat i Sundsvall, Växjö, Västerås)Wilhelmsson, L. Arlinger, J D. Moberg, L. Möller, J J. 2007. Intelligent CTL harvestingbased on cost-benefit analyses for value chain optimization. In: Gingras, J F. (ed.). Proceedings3 rd Forest Engineering Conference Mont-Tremblant, Quebec, Canada October1-4. 18 p.Wilhelmsson, L. Arlinger, J. Nordström, M. and Westlund, K. 2009. Economic and environmentalimprovements to wood supply in the context of whole forest-wood chainsby means of operative predictions of costs and benefits in monetary, environmental andworking-hour units – a connection between Eforwood and Indisputable Key. Posterpresentation at Eforwood Final Conference, Uppsala 23-24 Sept.Popular science publicationsSundblad, L-G, Thor, M. Wilhelmsson, L. Linander, F. Hannerz, M. 2008. Hjälpmedel förinventering av rotröta i stående skog. Resultat 18. Skogforsk (Uppsala). 4 pp.External referencesJonsson, P. 1979. Jämförelse mellan massor av eukalyptus samt sydstatstall och Scan-massor.Svensk Papperstidn. 12. pp 353-357.Kennedy, R W. 1995. Coniferous wood quality in the future concern and strategies.63
Models of forest suitability for outdoor recreationProject leader: Anderas Lindhagen, Dept. of Forest Products, SLU, Uppsala.Project aim<strong>The</strong> aim of this project was to develop models for calculating relative recreationalvalues of forest sites, from existing models describing the suitability ofthe forest as an environment for outdoor recreation and using the descriptorsof the forest in the <strong>Heureka</strong> system as predictors. Three main models havebeen constructed, describing:1. Recreational value at stand level.2. Recreational value according to locations of stands in the landscape.3. Total recreational value at landscape level.Models 1 and 2 provide relative recreational values between 0 and 1, wherevalues close to 1 indicate that the forest site is very suitable for outdoor recreation.<strong>The</strong> total recreational value (model 3) is calculated as the product ofthe results of models 1 and 2, so a forest stand must have a high value accordingto both of these models to be assigned a high value in the total model.Methods used in the project<strong>The</strong> stand-level model (1) is based on preference studies conducted mostly inSweden, but results from Denmark, Norway and Finland have also been used(Hultman 1983, Koch & Jenssen 1988, Ribe 1989, Axelsson-Lindgren 1990,Lindhagen 1996, Hörnsten 2000, Tyrväinen et al. 2003, Jensen & Koch 2004,Kardell & Lindhagen 2006, Lindhagen 2010a, Lindhagen 2010b). <strong>The</strong> dataused in these preference studies were acquired from postal surveys, in whichthe respondents sorted photos of various forest environments in accordancewith their perceived suitability for outdoor recreation.<strong>The</strong> model of the recreational value according to location at landscape level(2) has been constructed as an expert model, based on literature studies ofthe outdoor recreation habits and behavior of the adult Swedish population(Statistiska centralbyrån 1993, 2004, Hörnsten 2000, Hörnsten & Fredman2000, Björk et al. 2008, Fredman et al. 2008).User value<strong>The</strong> models are suitable as tools to facilitate forest management and planningby landowners who want to provide forests with high recreational values.Such landowners may include local municipalities who want to provide goodrecreation areas for their inhabitants, or small private forest owners who wantattractive areas near the center of their holdings.<strong>The</strong> models are also suitable for local and regional studies of outdoor recreationsites and facilities. <strong>The</strong>y can be used, for example, by local municipalitieswhen planning new housing areas or by governmental agencies wheninvestigating affects of forestry on the landscape and potential uses of landscapes.<strong>The</strong> stand level model is implemented in all three main <strong>Heureka</strong> softwarepackages: StandWise, PlanWise and RegWise. <strong>The</strong> total landscape recreational64
value model, based on both stand attributes and stand localization, is only relevantin a landscape context. Thus, it is applicable in PlanWise and RegWise,but not StandWise.Scientific resultsFor even-aged forests the stand level model is divided into the followingthree sub-models (one of which is also used for uneven-aged forest), relatedto different stages of stand development:• Clear-cut areas and young regrowth with a mean height less than 2 meters.• Young even-aged stands with a mean height exceeding 2 meters, butbefore the first commercial thinning.• Even-aged forest after the first commercial thinning. This sub-model is alsoused for uneven- aged forest.<strong>The</strong> model for calculating recreational values of forest stands according totheir locations in the landscape is based on the number of potential visitorsliving within certain distances and the stands’ accessibility. <strong>The</strong> latter is basedon the distance to the nearest road, but also considers obstacles (railwaysand highways) hindering access. <strong>The</strong> model uses the number of inhabitantsresiding within 50 m, 300 m, 2000 m and 40000 m of the stands as predictors,weighted so that substantially more people need to live 4000 km awayto have the same impact on recreational value as a few persons living within50 m. This is because the latter are presumed to see, or otherwise experience,the forest every day and in some cases see it from their houses. <strong>The</strong> othertwo distances, 2000 m and 3000 m are assumed to correspond to comfortablewalking or biking distances. We know that most forest visits are to sitesat these distances from visitors’ homes, and that the number of visits decreasesrapidly as the distance is extended and the visitors have to spend more timeto get to the forest sites. Whether or not the forest stand is close to a lake orwater course broader than 6 m is also considered in the model since closenessto water is highly appreciated.Fulfillment of objectives<strong>The</strong>se models are based on the attitudes and behavior of the “normal” Swede.According to the original program plan we also hoped to develop modelsfor more specialized forest visitors who want access to wilder nature, withfewer forestry tracks and signs of other human activities. For example, lyingtrees and dead wood are considered to detract from the recreational experienceby most of the respondents in preference studies, but to add to them bya minority of the respondents. A lot of effort has been spent to try to excludethe respondents with different preferences and try to determine a model foronly these respondents. However, there has been insufficient data in the preferencestudies to find such respondents, probably because the same respondentsreact positively to dead wood in some cases, while in other cases theyreact negatively. Very few, if any, respondents consistently favor dead woodand lying stems. Another reason for this shortcoming is that the description65
of dead wood and decomposition in the <strong>Heureka</strong> system is not as detailed aswe hoped it would be. In the future, preference studies need to be improvedin terms of both the information they provide regarding perceptions of deadwood and lying stems by different categories of visitors and their ability todiscriminate between, for example, urbanist and purist visitors.ReferencesScientific articlesLindhagen A. 2010a. Changes in public attitudes to forest sites between 1978 and 2009.Manuscript in prep.Lindhagen A. 2010b. Public opinion to plantations on former farmland in Sweden. Man-Seminars and computer exercises at the programme meeting in May 2008, Umeå.Photo Tomas Lämås.66
uscript in prep.Working papersLindhagen A. 2010. Description of the recreation models in the <strong>Heureka</strong> planning system.Manuscript in prep.External referencesAxelsson Lindgren, C. 1990. Upplevda skillnader mellan skogsbestånd – rekreations- ochplaneringsaspekter. Stad & Land nr 87.Björk, J., Albin, M., Grahn., Jacobsson, H., Ardö, j. Östergren, P-O. & Skärbäck, E. 2008.Recreational values of the natural environment in relation to neighbourhood satisfaction,physical activity, obesity and wellbeing. Journal of Epidemiology & Community Health 62:4Fredman, P., Karlsson, S-E., Romild, U. & Sandell, K. (redaktörer) 2008. Vilka är ute inaturen? Delresultat från en nationell enkät om friluftsliv och naturturism i Sverige. ForskningsprogrammetFriluftsliv i förändring, Rapport nr 1.Hultman, S-G. 1983. Allmänhetens bedömning av skogsmiljöers betydelse för friluftsliv.Del 1 och 2. SLU, institutionen för skoglig landskapsvård. Rapport nr 27 och 28.Hörnsten, L. 2000. Outdoor recreation in Swedish forests: Implications for society andforestry. SLU, Acta Universitatis agriculturae Sueciae. Silvestria, 169.Hörnsten, L. & Fredman, P. (2000) On the distance to recreational forests in Sweden.Landscape and Urban Planning 51:1-10.Jensen, F. S. & Koch, N. E. 2004. Twenty-five years of forest recreation research in Denmarkand its influence on forest policy. Scandinavian Journal of Forest <strong>Research</strong>. Supplement; 4, S. 93-102.Kardell, L. & Lindhagen, A. 2006. Talltorpsmon i Åtvidaberg. 2. Alternativa slutavverkningsformersamt attityder till dessa 1978-2005. SLU, inst. för skoglig landskapsvård,rapport 98.Koch, N. E. & Jensen, F. S. 1988. Skovenes friluftsfunktion i Danmark. Del 4. Befolkningensønsker til skovenes og det åbne lands udformning. Det forstlige forsøgsvæsen iDanmark, 42:3.Lindhagen, A. 1996. Forest recreation i Sweden. Four case studies using quantitative andqualitative methods. SLU, inst. för skoglig landskapsvård, rapport 64. Dissertation.Ribe 1989. <strong>The</strong> Aestetics of forestry: What have Empirical Preference <strong>Research</strong> ToughtUs? Environmental Management 13: 55-74.Tyrväinen, L. Silvennoinen, H. & Kolehmainen, O. 2003. Ecological and aesthetic valuesin urban forest management. Urban Forestry & Urban Greening 1: 3:135-149.Statistiska centralbyrån, 1993. Fritid 1976-1991, Levnadsförhållanden Rapport 85, Stockholm.Statistiska centralbyrån, 2004. Fritid 1976-2002: Levnadsförhållanden, rapport nr. 103.67
Data acquisition for regional planningProject leader: Mats Nilsson, Dept. of Forest Resource Management, SLU, Umeå.Participants: Jonas Bohlin, Michael Gilichinsky, Steve Joyce, Mats Nilsson, Håkan Olsson,Dept. of Forest Resource Management, SLU, Umeå. Johan Stendahl, Dept. of Soiland Environment, SLU, Uppsala.Project aim<strong>The</strong> main objective of this project was to develop methods for providingdata to be used in the regional application (RegWise), including wall-towallmaps with estimated forest parameters and field data from the SwedishNational Forest Inventory (NFI). Raster maps with estimated forest parameterssuch as stand volume and tree species mixture are not only useful asinput to RegWise, but also in applications such as habitat mapping and landscapeplanning.Methods used in the project<strong>The</strong> project has been divided into the following four sub-projects:• Development of methods to handle field data from the Swedish NFI.• Wall-to-wall mapping of forest parameters (kNN Sweden 2005).• Development of methods to handle time series of satellite data.• Topographic modeling of soil moisture.Field data from the Swedish NFI<strong>The</strong> aim has been to develop and implement methods that make it possibleto use field data from the Swedish NFI in RegWise. An important task hasbeen to improve the quality of the NFI data used in the application by poststratifyingthe field samples using remotely sensed data or map products basedon remotely sensed data. Methods have been developed that can be used toderive both estimates of parameters like stand volume, tree species mixtureand woody biomass (Nilsson et al. 2005), and estimates of changes in variablessuch as the annually clear felled area in a region (Nilsson et al. 2009).Wall-to-wall mapping of forest parametersOne important aim has been to develop and produce a new national wallto-wallraster map with estimated forest parameters representing the forestconditions in 2005. <strong>The</strong> method used is the k Nearest Neighbour (kNN)algorithm (e.g., Tomppo 1993, McRoberts 2002, Reese et. al. 2003) inwhich satellite data are combined with field data from the Swedish NFI. <strong>The</strong>new dataset is produced using SPOT HRG images from 2005 and 2006.<strong>The</strong> relatively small scenes (60 x 60 km) have made it necessary to spectrallycalibrate the images so that NFI plots from more than one image can be usedfor the estimations. <strong>The</strong> reason for this is the relatively low sampling intensityused by the NFI, which sometimes results in too few field plots within aSPOT scene. <strong>The</strong> possibility to improve the quality of the kNN estimates byincluding multi-temporal satellite data and ancillary data from maps has also68
een tested.Estimates of forest parameters obtained from optical satellite data oftenunderestimate the true variance of the parameters. Thus, a histogram-matchingpost-processing procedure for calibrating the kNN estimates to the distributionobtained by the NFI has been developed.Time series of satellite dataMethods for mapping changes based on multi-temporal satellite data havebeen developed. <strong>The</strong> use of mapped clear cuttings gives valuable informationthat can potentially be used together with satellite data and ancillary data toestimate forest parameters using the kNN method.Topographic modeling of soil moisture<strong>The</strong> soil moisture is important for the local variation in soil characteristics,which affects many important soil processes. It also affects the productioncapacity and biodiversity. <strong>The</strong> aim has therefore been to investigate the topographicinfluence on soil properties. A topographical wetness index (TWI)has been derived using a digital elevation model.<strong>The</strong> possibility to use TWI values as additional data when estimating forestparameters using the kNN method has also been tested.User valueNew and more accurate raster maps (kNN Sweden) with realistic distributionsof estimated forest parameters will soon be available. <strong>The</strong> new rastermaps will make it possible to derive reliable estimates for relatively smallareas, and it will be better suited for identifying extreme values, for exampleidentifying areas with old deciduous forest, as compared to the previouskNN Sweden 2000 dataset. <strong>The</strong> kNN Sweden 2000 dataset is already availablefree of charge on the Internet (http://skogskarta.slu.se/) and the 2005dataset will soon be available from the same website.Post-stratification of the NFI plots means that the initial state of the forestis estimated more accurately in RegWise, which also improves the quality ofscenarios describing how the forest will develop over time given, for example,different management policies.Scientific results<strong>The</strong> scope for improving estimation accuracies for different forest parametersat a county level by combining field data from the NFI and satellite datausing post-stratification, compared to using field data alone, has been evaluated.<strong>The</strong> results show that the standard errors for estimates of total stem volume,stem volume for pine, stem volume for spruce, stem volume of deciduoustrees and tree biomass can be reduced by 10% - 30% at a county level(approximately 1 million ha forest land) by using post-stratification based onkNN data compared to use of field data from the NFI alone (Nilsson et al.2005).<strong>The</strong> kNN estimates have been successfully calibrated. Results show that69
the mean and variance of total stand volume estimates correspond closely tothe mean and variance obtained by the NFI after the calibration, althoughthe original kNN estimates had considerably less variance (Gilichinsky etal. 2009). It has also been found that the accuracy for total stand volumeincreased after the matching as compared to the accuracy of the originalkNN estimates.<strong>The</strong> possibility to improve the accuracy of kNN estimates of forest parametersby using TWI, mapped clear cuttings, and other types of ancillary datain combination with satellite data in the estimation was tested. <strong>The</strong> resultsshow that the estimation accuracy for variables such as stand volume wasslightly improved when adding information on cuttings and tree species inthe kNN estimation, as compared to only using satellite data. However, theestimation accuracy was not improved by including TWI.Fulfillment of objectives<strong>The</strong> research and development regarding the kNN method, including calibrationof the estimates, and the use of post-stratification based on remotelysensed data has been successful. However, the development of the methodshas taken much longer than initially anticipated. It was also intended that asegmentation algorithm should be developed and implemented. Unfortunately,it was not possible to finalize this part within the <strong>Heureka</strong> program.<strong>The</strong> implementation of a segmentation algorithm will therefore be finalizedwithin SLU’s environmental monitoring and assessment program.ReferencesScientific articlesSeibert, J. Stendahl, J. & Sörensen R. 2007. Topographical influence on soil properties inboreal forest soils. Geoderma 141; 139–148.Tomppo, E., Olsson, H., Ståhl, G., Nilsson, M., & Katila, M. 2007. Creation of forest databases by combining National Forest Inventory Field Plots and Remote Sensing Data.Remote Sens. of Environ. 112:1982-1999.Gilichinsky, M., Heiskanen, J., Wallerman, J., Egberth, M., & Nilsson, M. 2009. Histogrammatching for post-processing of stem volume estimates imputed from forest inventoryand satellite data. Submitted to Remote Sensing of Environment.Lyon, S.W. Sörensen, R. Stendahl, & J. Seibert, J. 2009. Using landscape characteristics todefine an adjusted distance metric for improving kriging interpolations. Manuscript inpress.Nilsson, M., Holm, S., Wallerman, J., Reese, H. & Olsson, H. 2009. Estimating annualcuttings using multi-temporal satellite data and field data from the Swedish NFI. InternationalJournal of Remote Sensing, 30: 5109–5116.Reese, H., Nilsson, M., & Olsson, H. 2009. Comparison of Resourcesat-1 AWiFS andSPOT-5 data over managed boreal forests. International Journal of Remote Sensing, 30:4957–4978.70
Conference proceedingsNilsson, M., Holm, S., Reese, H., Wallerman, J., & Engberg, J. 2005. Improved forest statisticsfrom the Swedish National Forest Inventory by combining field data and opticalsatellite data using post-stratification. In: Proceedings of ForestSAT 2005 in Borås, May31 – June 3, Report 8a, pp. 22-26.Reese, H., Granqvist-Pahlén, T., Egberth, M., Nilsson, M., & Olsson, H. 2005. Automatedestimation of forest parameters for Sweden using Landsat data and the kNN algorithm.In: Proceedings for the 31st International Symposium on Remote Sensing of the Environment,June 20-24, 2005, St. Petersburg, Russia.Stendahl, J. Seibert, & J. Sörensen, R. 2005. Spatial variability in soil carbon stocks andrelations to topography at the landscape level. Poster: Focus on Soils symposium, Uppsala14-16 September, 2005.Olsson, H., Sallnäs, O., Nilsson, M., Egberth, M., Sandström, P. & Bohlin, J. 2008. Satellitedata time series for forecasting, habitat modeling and visualization of the managed borealforest landscape. In: proceedings from the XXI ISPRS Congress, Bejing, July 3-11, 2008,International Archives of Photogrammetry, Remote Sensing and Spatial InformationSciences vol XXXVII Part b8, pp.1007-1012. (www.isprs.org).Popular science publicationsChaminade, G. 2005. Topography, vegetation and soil carbon-nitrogen ratio in borealforests at the landscape level. MSc thesis at the Dep. of Forest Soils, SLU, 12.External referencesMcRoberts, R.E., Nelson, M.D., & Wendt, D.G. (2002a). Stratified estimation of forestarea using satellite imagery, inventory data, and the k-Nearest Neighbors technique.Remote Sensing of Environment, 82:457-468.Reese, H., Nilsson, M., Granqvist Pahlén, T., Hagner, O., Joyce, S., Tingelöf, U., Egberth,M., & Olsson, H. 2003. Countrywide estimates of forest variables using satellite data andfield data from the National Forest Inventory. Ambio 32, pp. 542-548.Tomppo, E. 1993. Multi-Source National Forest Inventory of Finland. In: Proceedings ofIlvessalo Symposium on National Forest Inventories, August 17-21, Finland. pp. 52-59.71
Data acquisition for long-term planningProject leader: Jörgen Wallerman, Dept. of Forest Resource Management, SLU, Umeå.Participants: Anna Ringvall, Dept. of Forest Resource Management, SLU, Umeå.Project aimThis project aimed at developing methods to provide data about every foreststand in an addressed area, primarily to support the long-term planning application,PlanWise. <strong>The</strong> specific requirements were:• Each stand had to be represented by single-tree data, i.e. as if objectivesample-plot survey data, including lists of tree diameter measurements andspecies, were available for each stand.• Proper representation of the forest variation within each stand, in order toprovide sufficient information for adequate stand silviculture modeling andtreatment optimization.• Possibilities to utilize different data sources, especially common forest standdatabases, and possibly in combination with airborne laser scanner (ALS)information.In addition, a new study site was established in the project, for acquiring,evaluating and comparing field survey measurements, remote sensing data,and raster maps of forest state parameters, to support validation of the <strong>Heureka</strong>system, perform case-studies and assist the education of users.Methods used in the projectModeling stand variationUsing the two main sources of data considered here, i.e. forest stand databasesand ALS data, extensive efforts have been made to model and predict thevariation of forest within stands. Using only the data in a forest stand database,it is possible to assess the within-stand variation in terms of tree heightand diameter distributions, by modeling distributional parameters (Weibullparameters or percentiles) using stand database information as explanatorydata (e.g. Kangas & Maltamo 2000, Kangas et al. 2007). Furthermore, utilizationof ALS data provides a means for highly accurate modeling of treeheight distributions and reasonably accurate diameter distributions, using thearea-based method as well as detection and estimation of single trees (e.g.Næsset et al. 2004, Gobakken & Næsset 2005). <strong>The</strong>se research findings formthe fundamental basis of the project, and two different approaches to utilizemodeled distributions to produce single tree stand data were developed - anew plot data selection algorithm and an ALS-based support for simulationof single tree data.72
Selection of plot data to represent modeled stand variation<strong>The</strong> <strong>Heureka</strong> system implements many statistical models, which collectivelydescribe the complex multivariate properties of a very large number of forestparameters. In order to obtain good results, it is likely to be important tosupply the system with data in which the natural multivariate dependencestructures are preserved. A first attempt to address this problem using ALSdata was made in the first phase of the <strong>Heureka</strong> project using imputation ofexisting field plot data to each stand (Wallerman & Holmgren 2007). Thiswas not very successful, mostly due to the requirement for a very large datasetof reference field plot data with ALS data for each plot.Here, a new method to assign existing field plot data to each stand wasdeveloped. Given the existing information for each stand, such as site index,species composition, mean stem volume, and estimated height and diameterdistributions, this new method aims to use only this to carefully select a fewplots from a very large set of reference plots. In short, the existing data areused as a goal for the joint properties of the selected plots. <strong>The</strong> main steps ofthe algorithm are:1. Prediction of tree height and diameter distributions using existing data(stand register or ALS).2. Selection of plots of similar geographical area tree species composition, andsite index.3. Selection of n of these plots by iterative random selection until the modeledbivariate tree height, diameter distribution and mean stem volume ofthe stand are satisfactorily represented by the surveyed tree data.<strong>The</strong> algorithm was implemented using C# and the statistical software R (RDevelopment Core Team, 2008), and evaluated using data from the Krycklantest site and the very large Forest Management Planning Package database offield plot survey data (“IP Bank”).ALS-based support for simulation of tree dataAccurate predictions of diameter and height distributions allow an alternativemethod to supply the system with single tree data, based on simulation ofobservations from these distributions. Such synthetic data can be easily producedonce knowledge of the parent distributions is available. However, adrawback is probably the loss of natural dependence of the resulting syntheticdata. <strong>The</strong> area-based method for modeling forest parameters using ALS data(Holmgren 2003, Næsset et al. 2004, Gobakken & Næsset 2005) is ratherstraight forward and generally produces accurate estimates of the total treedistributions, i.e., not distributions for each tree species separately, althoughthis is clearly needed.Here, a convenient tool to perform area-based ALS analysis was implemented,including a basic method to utilize existing information on tree speciesproportions to estimate species-specific tree distributions. It was implementedin R using the sp package to access raster and vector data.73
Establishment of the Krycklan test site<strong>The</strong> new test site, Krycklan, consists of the Krycklan stream watershed,which covers an area of 70 km 2 outside Vindeln in northern Sweden. It is amajor research site for the Krycklan Catchment study (KCS, ccrew.sek.slu.se/krycklan), and investigators involved in this project and the KCS haveclosely cooperated in investigations at the site. Many data capture activitieshave been performed on the test site:2006• Laser scanning using an ALTM scanner (1100 m flying altitude, 3-4 pulses/m2 );2007• Surveys of 162 circular field plots of 6 m radius, using routines accordingto the National Forest Inventory;2008• Laser scanning using TopEye Mk II (500 m flying altitude, 5 pulses/ m 2 ),• Surveys of 31 forest stands (ca. 10 plots stand, 10 m radius) in the BIO-SAR project,• Surveys of 110 field plots (12 m radius, positioned trees) in the IRIS project,• Stand delineation and species assessment using aerial photo interpretationin stereo.<strong>The</strong> surveys of 2008 were made using the Ivent application, and providedopportunities to test, validate and correct errors in other applications, includingPlanStart. Using the collected data, ALS-based raster maps have beenmade of the area (Table 2) and are documented in Wallerman (2009).Table 2. Mapping datasets at KrycklanDataset Resolution UnitDigital elevation model 0.5 m × 0.5 m [m above MSL]Biomass map 10 m × 10 m [ton/ha]Mean stem volume 10 m × 10 m [m 3 /ha]Mean tree height map 10 m × 10 m [m]Mean tree diameter map 10 m × 10 m [mm]Mean tree age 10 m × 10 m [yr]Tree height percentiles 10 m × 10 m [m]Weibull parameters of tree height 10 m × 10 m -distributionTree diameter percentiles 10 m × 10 m [mm]Weibull parameters of tree diameterdistribution10 m × 10 m -Data from the Krycklan test site are stored in a SDE database on the SLUcomputer network, in order to be easily assessed and maintained. Furthermore,there is substantial interest in extending and utilizing this unique data-74
set, in the BIOMASS and IRIS projects, for educational purposes and inprojects of Master’s students based at both SLU and Umeå University.User valueIn the project, basic support to utilize the currently most promising source ofgeographical forest data – ALS – was developed. Use of ALS data is expectedto provide accurate descriptions of each scanned forest stand, in terms of bothaverage stand parameters and their variation.<strong>The</strong> establishment of the Krycklan test site provides excellent opportunitiesto develop user education material, and may very well provide means forfurther development of the system.Fulfillment of objectivesA very large part of the project work involved the development of methodsto impute or assign existing field plot data to stands, in order to providesingle-tree representation and plot-level survey data for each stand. Unfortunately,this approach was not successful. <strong>The</strong> method used to select plot datato represent modeled stand variation did not meet the target distributionsvery well, regardless of the number of reference plots available. However,use of simulations may very well provide data of sufficient quality, and providesa very straight-forward method to create single-tree data from commonforest stand databases as well as ALS data.ReferencesScientific articlesWallerman, J., & Holmgren, J. 2007. Estimating field-plot data of forest stands using airbornelaser scanning and SPOT HRG data. Remote Sensing of Environment 110 (4):501-508.Working papersWallerman, J. 2009. Krycklan. Working report (in progress).External referencesHolmgren, J. 2003. Estimation of forest variables using airborne laser scanning. Doctoral<strong>The</strong>sis. Acta Universitatis agriculturae Sueciae 278.Kangas, A. & Maltamo, M. 2000. Percentile based basal area diameter distribution modelsfor Scots pine, Norway spruce and birch species. Silva Fennica 34: 371–380.Kangas, A., Mehtätalo, L. & Maltamo, M. 2007. Modelling percentile based basal areaweighted diameter distribution. Silva Fennica 41(3): 425-440.Næsset, E., Gobakken, T., Holmgren, J., Hyyppä, H., Hyyppä, J., Maltamo, M., Nilsson,M., Olsson, H., Persson, Å. & Söderman, U. 2004. Laser scanning of forest resources: thenordic experience. Scandinavian Journal of Forest <strong>Research</strong> 19(6): 482-499.Gobakken, T. & Næsset, E. 2005.Weibull and percentile models for lidar-based estimationof basal area distribution. Scandinavian Journal of Forest <strong>Research</strong> 20: 490–502.R Development Core Team, 2008. R: A language and environment for statistical computing.R Foundation for Statistical Computing, Vienna, Austria. ISBN 3-900051-07-0,URL http://www.R-project.org.75
System for objective field surveys for long-term planningProject leader: Anna Ringvall, Dept. of Forest Resource Management, SLU, UmeåParticipants: Sören Holm, Per Hansson, Dept. of Forest Resource Management, SLU,Umeå.Project aimSince the introduction of the Forest Management Planning Package (FMPP;Jonsson et al. 1993) in the 1980’s, long-term planning in large-scale forestryin Sweden has been largely based on data collected by objective plot surveysin an objectively selected sample of stands. This type of inventory providesunbiased estimates with, for larger areas, a high precision (small standarderrors). However, in <strong>Heureka</strong>, different types of spatial analyses are a corecapability. For such analyses, data from all stands in the target area are neededand methods to obtain such data have been developed within the projectData acquisition for long term planning. However, given the higher accuracyof estimates from objective field surveys, there will be, at least initially,demands for some analyses, e.g., to determine cutting levels at a company level,based on data from objective field surveys in a sample of stands. In contrastto data originating from imputation, data from objective field surveys containdetailed tree data in addition to detailed site data, which are important fore.g., growth functions.<strong>The</strong> system for objective field surveys in the FMPP has been well tested,in terms of both the methodology and dimensioning. New challenges with<strong>Heureka</strong> included the potential need to incorporate new variables, for examplein the models developed for non-timber values. <strong>The</strong> data from an objectivefield survey in a sample of stands should also complement the data for allstands obtained through imputation methods studied within the project Dataacquisition for long term planning, which might have implications for theway the sample stands should be selected. It is also possible that remote sensingdata, e.g., aerial laser scanning data, can be used for more efficient sampledesign both at stand level and for selecting stands. <strong>The</strong>re have also beenmajor technological developments in handheld computers and GPS sincethe FMPP was developed. Although the FMPP methodology is well-tested,better computer capacity should also enable better studies on a reasonabledimensioning under different demand on accuracy.<strong>The</strong> aim of this project was to develop a cost-efficient system for field surveyto be applied when using the long-term planning application, PlanWise.<strong>The</strong> project consisted of a research-oriented part in which different alternativeswere compared, both for the stratification applied in the selection ofstands and the field survey. <strong>The</strong> second part of the project aimed to implementthe suggested routines, i.e. ensure that the systems were ready for use by76
the end of the project period. <strong>The</strong> main deliverable from this project was anoperational field survey method including:• Definition of variables,• Recommendations of field equipment and specifications for the field surveysoftware,• Routines for planning field surveys (including stratification and selectionof stands), routines for correction of collected data and algorithms for stateestimates and standard error estimates in the application.Methods used in the projectIn the scientific part of the project, different designs and estimators for plotwisefield surveys within stands were compared through Monte Carlo simulations(e.g., Lämås & Ståhl 1996). In these simulations, data from a fieldsurvey and airborne laser scanning at the Remingstorp estate in southwestSweden were used (Holmgren & Wallerman 2006). Different measures fromlaser data were extracted for each field plot and used as auxiliary informationeither in the layout of plots (stratification) or for estimation (calibration estimator).Different alternatives for calculation of calibration ratios for height andvolume predictions (from regional functions) were tested on sample tree datafrom an objective field survey using FMPP in Västerbotten performed by thecompany SCA. Effects on estimates of the different alternatives were studiedthrough Monte-Carlo simulations.In the development-oriented part of the project, a large portion of thework consisted of writing instructions for the system development group.Many of the routines were already used in the FMPP but still needed to bedescribed for this group.<strong>The</strong> developed application for field computers was tested within this projectin a field survey at the test site Krycklan in Vindeln. Data from this fieldsurvey were then also used for testing routines for calculating calibrationratios and estimating the current state in the application PlanStart (Ringvall2009).User valueBased on the descriptions of routines created within this project, a systemfor objective field surveys has been developed. Although alternatives werestudied, the final methodology largely resembles the methodology used inFMPP. With the developed system, implemented in the applications Iventand PlanStart, the same type of analyses as previously made by FMPP can bemade by PlanWise. <strong>The</strong> applications Ivent and PlanStart also have some newfunctionality in comparison with FMPP. <strong>The</strong> two applications can also beused independently for other types of plot surveys. For example, Ivent hasalready been used for field surveys in remote sensing-oriented research studies.77
Scientific results<strong>The</strong> comparison of a random layout of plots with a layout (stratification)or an estimator (calibration estimator) using laser scanning data as auxiliaryinformation indicated that it provided possible improvements in terms of precisionof estimates. However, the increase in precision did not compensate forthe possible drawbacks of using auxiliary information. In the tested area, thebest alternative, stratification, increased the precision of estimates of volumeha -1 by 16%, on average over 13 stands, but would result in more complicatedfield work, less flexibility and more complex calculations. With the calibrationestimator, the choice of using auxiliary information or not can be madeat the analysis stage and the calibration estimator works well for some parameters(providing similar improvements to those for stratification) but less wellfor others and may also introduce some small bias due to the low number ofplots in a stand. Before final conclusions are drawn, it would be of interestto repeat the study with data from other stands, e.g, stands at the Krycklantestsite in Vindeln, since Remingstorp consists of rather homogenous standsand the effect of using auxiliary information might be stronger in more heterogenicstands. In addition, an alternative and possibly more interesting useof the calibration estimator may be to “calibrate” old updated field data withnew laser scanning data.Fulfillment of objectives<strong>The</strong> main aim of this project was to provide a description of a system forobjective field surveys, based on a sample of stands, enabling PlanWise tobe used in similar analyses to those in which the FMPP has previously beenused. That objective has been fulfilled, in that such a system has been developedand implemented in applications. However, more time than expectedwas needed to write instructions and support implementation, includingimplementation of functionality that already existed in the FMPP. Hence,some of the topics planned to be studied during the project time were omitted,including the study of an alternative stratification and sample standselection procedure to support the imputation methods studied within theproject Data acquisition for long-term planning. It was also unclear whetheror not the imputation methods will be based on field data collected in objectivefield surveys. Instead, in the future it might be of interest to study howestimates from objective field surveys, which are known to be unbiased withsmall standard errors for large target areas, might be used to complement orcalibrate estimates/data from the less accurate imputation methods. Further,the newly developed models in <strong>Heureka</strong> did not include many new variablesin comparison with the system for field inventory in FMPP and studiesregarding the precision of such variables were not included. However, thesystem implicitly requires measurements of dead wood acquired in a similarmanner to that used in the Swedish NFI, which might be too complicatedfor some users. Simplified routines can be used, but might give rise to bias, asshown by Fraver et al. (2007). Hence, this study was planned to be followed78
y a study of the consequences for <strong>Heureka</strong> of including simplified deadwood measurements but this was omitted due to time constraints.During the course of implementation, other research questions, of varyingimportance and complexity, were raised. Some were studied in the project,such as different alternatives for calculating calibration ratios for height andformheight functions. Some will be studied in the near future, includingalternative approaches for calibrating age predictions from functions usingsample tree data, possibilities to calibrate growth functions (at plot level)based on remeasurements of some stands, implications for stand selection andestimates if surveys are made as continuous surveys (i.e., a certain amountof stands surveyed each year) in comparison with today’s cyclic surveys andimplementation of different alternatives for sample tree selection. It wouldalso be of interest to study how remote sensing information could improvestratification at a stand level and as a support for adequate dimensioning inselected stands.ReferencesScientific articlesRingvall, A. 2010. Comparison of estimates of stand variables based on plot inventorieswith simple random sampling, stratification and calibration estimation. Manuscript inprep.Working papersHansson, P. 2008. Förstudie av mjukvara för skoglig inventering. Stencil. 41 p.Popular science publicationsRingvall, A. 2008. Faktablad IventRingvall, A. 2009. Nyutvecklade applikationer för avdelningsvis fältinventering. <strong>Heureka</strong>sårsrapport 2008.External referencesJonsson, B., Jacobsson, J. & Kallur, H. 1993. <strong>The</strong> Forest Management Planning Package.<strong>The</strong>ory and application. Studia Forestalia Suecica 189, 56 pp.Fraver, S., Ringvall, A. & Jonsson, B.G. 2007. Refining volume estimates of down woodydebris. Canadian Journal of Forest <strong>Research</strong> 37:627-633Holmgren, J. & Wallerman, J. 2006. Estimation of tree size distribution by combiningvertical and horizontal distribution of LIDAR measurements with extraction of individualtrees. Workshop on 3D Remote Sensing in Forestry, 14-15 January 2006, Vienna.Lämås, T. & Ståhl, G. 1996. On the accuracy of line transect sampling of rare forestobjects. In: Bachmann, P., Köhl, M. and Päivinen, R. (eds) Assessment of biodiversity forimproved forest planning. EFI Proceedings 18.79
Data acquisition for operational planningProject leaders: Andreas Barth, (2008-2009), Lennart Moberg (2007), Ingemar Eriksson(2006), SkogforskParticipants: Johan Holmgren, Kenneth Olofsson, Jörgen Wallerman, Dept. of ForestResource Management, SLU, Umeå.Project aim<strong>The</strong> aim of this project was to develop methods for data acquisition relevantfor operational forest planning. <strong>The</strong> lack of high quality data from preharvestinventories is one of the most important problems hampering improvementof efficiency in forest operations (e.g. optimization of stand selectionand stand sequencing) and the ability to meet increased customer demands.To obtain such data, it is essential to be able to predict yields with sufficientdetail and accuracy, down to wood-property level. This requires improvedmethods, techniques and routines for variables including diameter distributionat the tree species level, tree age, frequencies of down classed logs, sizeof harvest areas and other factors affecting wood quality.Methods used in the project<strong>The</strong> following methods and steps were applied:• Development and evaluation of a method for combining airborne laserscanner (ALS) and harvesting data.• Evaluation of data quality from the developed method as input for predictingwood product recovery in bucking simulations.• Evaluation of the use of high-resolution airborne laser scanner data trainedwith field plot data.User value<strong>The</strong> results from this project open possibilities to design data acquisition systemsthat will provide highly precise pre-harvest predictions of the expectedvolume and value recovery of company-specific round wood assortmentsfrom candidate sites. By implementing efficient routines for inventories ofareas to be cut, planning of the wood supply to industrial sites will be muchimproved, which also will contribute to reductions in transport and theamount of wood stored at industrial yards.Scientific results<strong>The</strong> main focus within the project has been to develop a method for detectingand describing all the trees within a stand by ALS, and to supplement thisinformation using harvesting data and imputation techniques in order to predictwood product recovery. By linking information from the harvester withALS data, trees within stands that have not been harvested can be describedby variables from the harvester, including stem diameters. Stem diametermeasurements are automatically registered by all modern harvesters so thesedata could be available at a low additional cost. However, to be able to linkthe harvester information with airborne laser scanner data the positions of80
Field trials in the project Data acquisition for operational planning. To the left planned harvestingareas in Strömsjöliden, Västerbotten. An application for FcGIS was developed to assist theoperator to register tree identification numbers on the sample-plots (right, from Remningstorp,Västergötland).single trees have to be registered during harvesting, which is not done by harvesterstoday. Results from a first study, hosted by SCA, were presented at twoscientific conferences (Wallerman et al. 2008, Moberg et al. 2008). Resultsfrom a second study at Vindeln Experimental Forests are presented in theMaster’s thesis by Larsson (2009). At a sub-stand level DBH and tree heightwere estimated with RMSEs of 1.7 cm (8.4%) and 0.7 m (5.2%) , respectively.<strong>The</strong> stem volume was estimated with a RMSE of 25 m 3 ha -1 (10.5%). Examplesof the diameter distribution at the plot-level for two field-plots are presentedin Fig. 24. Further results will be presented in a forthcoming scientificpaper (Holmgren et al. 2009).Figure 24. Comparison of density plots between imputed diameters and reference diameters forplots 5.3 and 11.1. at Vindeln Experimental Forests in Strömsjöliden. From Larsson (2009).81
Stem taper data can serve as input in bucking simulations in order to makeprognoses of wood product recovery for a standing forest. In Fig. 25 theresults from bucking simulations in 17 sub-stands in Strömsjöliden are presented(Larsson 2009). <strong>The</strong> total volume of logs was estimated with a RMSEof 23.5 m 3 ha -1 (13.0%). When divided into saw timber and pulp wood theaccuracy decreased with a RMSE between 27.5-28.7%. However, these figurescould probably be improved if tree species classification was incorporatedin the remote sensing data. Knowledge of the tree species composition ishighly valuable and would also improve the details in the prognoses of woodproduct recovery. Supplemented with additional data, such as geographiclocation and stand age, individual tree models can be used to predict woodproperties such as fibre length, cell wall thickness, basic density, and knot size.Commercial methods currently deliver predictions at the single-tree levelbased on high resolution ALS data trained by field plot inventory data. Heightand diameter of single trees are predicted and diameter distributions can beestimated at the stand level. Together with information on the stem taperthese data can be used as input in prognoses of wood product recovery. <strong>The</strong>method has been evaluated as an input for operational forest planning (Barthet al. 2008, Barth 2008). Diameter and height estimates at stand level werecomparable or better than those provided by tested field inventories. Accuratedelineation of planned harvest areas gave accurate estimates of total stem volume.However, for wood product recovery the distribution between differentassortments is more important than total volume. For such analysis diameterdistribution at the tree species level is required. Based on the single tree estimatesthe diameter distributions were in most cases acceptable, but tree speciesclassifications were generally poor. For operational forest planning bettertree species classifications are clearly desirable.'()*+",(+-./"(0"+(12"&#!"&!!"'()*+",(+-./"(0"+(12"3. & 2(4"5* 6$ 7"829.*)/2"4*2/:"(;"":*)*"%#!"%!!"$#!"$!!"#!"!"!" #!" $!!" $#!" %!!" %#!" &!!" &#!"'()*+",(+-./"(0"+(12"3. 2(4"5* 6$ 7"?*@,/2)/@"2).6A+/2"&Figure 25. Total volume of logs for 17 sub-stands at Vindeln Experimental Forests in Strömsjöliden.A comparison of prognoses of wood product recovery based on the harvested trees andthe estimated stem data based on ALS, analyzed using Aptan in the TimAn software package(Arlinger et al. 2002).82
Fulfillment of objectives<strong>The</strong> main efforts in the project have focused on developing and testing amethod for combining information from the harvester and high resolutionairborne laser data. Harvesters continuously measure trees in the forest andregister stem diameters. This information can be successfully and cheaply usedto train high resolution ALS data. However, for practical applications the harvestersalso need to automatically measure and register the position of singletrees. Various solutions for this problem are possible, but to date there havebeen no practical trials of possible methods.Wood product recovery can also be predicted with a terrestrial laser scanner(TLS). TLS data have been acquired within the project and briefly evaluated.Such data provide valuable information on the lower section of thestems and based on these measurements parameters of the upper sectionof the stems can also be estimated. This method can be used for measuringsample trees within stands that will be harvested, or used to train ALS data tomake predictions for all stems within a stand or for other stands that will beharvested. <strong>The</strong>se methods will be more comprehensively evaluated by SLUand Skogforsk during 2010 within the IRIS-project.ReferencesScientific articlesHolmgren, J., Barth, A., & Wallerman, J. 2009. Prediction of product recovery for preharvestinventories with airborne laser scanning trained by harvester measurements.Manuscript in prep.Working papersBarth, A., Hannrup, B., Möller, J. & Wilhelmsson, L. 2008. Validering av FORAN Single-Tree® Method. Skogforsk, Working Report No. 666. (In Swedish).Larsson, H. 2009. Flygburen laserskanning kopplat till skördarmätning för datainsamlingtill operativ planering. SLU, Institutionen för skoglig resurshushållning, Working ReportVol. 260. (In Swedish with English summary).Conference proceedingsMoberg, L., Wallerman, J., Holmgren, J., & Barth, A. 2008. High-precision inventorymethods to predict wood properties for operational, pre-harvest planning. IUFROWorking Party 5.01.04 Wood Quality Modeling. Koli, Finland.Wallerman, J., Holmgren, J., & Moberg, L. 2007. Data acquisition for harvest schedulingusing single-tree detection in LIDAR data. ForestSAT 2007. Montpellier, France.Popular science publicationsBarth, A. 2008. Flygburen laser gav bättre data om träden. Skogforsk, Result No. 15. (InSwedish with English summary).External referencesArlinger, J., Moberg, L., & Wilhelmsson, L. 2002. Predictions of wood properties usingbucking simulation software for harvester. IUFRO Workshop S5.01.04 Connectionbetween Forest Resources and Wood Quality. Harrison Hot Springs, British Colombia,Canada.83
Planning and optimizationProject leader: Karin Öhman, Dept. of forest resource management, SLU, Umeå.Participants: Peder Wikström, Dept. of forest resource management, SLU, Umeå.Project aim<strong>The</strong> <strong>Heureka</strong> system is designed to be used for analysis and decision supportwhen addressing complex forest resource management problems. <strong>The</strong>complexity of these problems is a consequence of the spatial and temporaldynamics of the resource system itself, the response of the system to silviculturalactivities, the diverse and often conflicting goals and the huge numberof management alternatives. As a result it is not possible to compare andevaluate all possible combinations of management activities without relyingon quantitative tools, i.e. formulating the stated problem with a mathematicalmodel and solving the model with an optimisation method. This allowsthe analyser not only to rank the management alternatives in a systematicway, but also to make sensitive analyses of the effects of, e.g. different timberprices, changed preferences and new restrictions and to analyze trade-offs.<strong>The</strong> aim of this project was to develop such quantitative tools to be integratedin the <strong>Heureka</strong> system.<strong>The</strong> work can be divided into undertakings to develop methods for:1. Including habitat area,2. Avoiding large harvest openings,3. Clustering harvest activities,4. Integrating tactical and strategic planning,5. Deciding the geographical location of nature reserves,6. Developing a stand-level management model that can be used forexploring and evaluating different kinds of silvicultural systems.Methods used in the project<strong>The</strong> main focus in this project has been to develop quantitative tools forintegrating spatial considerations in the planning process. Undertakings 1-3and 5 are all examples of typical spatial problems. <strong>The</strong> approach in the projecthas been to first identify the most important spatial aspects. This has beendone by literature studies, interviews and workshops. Secondly, a number ofapproaches for optimizing the spatial layout of forest harvest activities withrespect to these aspects have been developed.Unfortunately, when spatial consideration of harvests is included in strategicplanning problem they inevitably grow in complexity (Öhman 2001).One reason for this is that to represent spatial aspects in the models integervariables must be used since they allow one to specify if a unit is managed bya certain treatment. Another reason is that including spatial aspects requireseach stand to be characterized in terms not only of its state but also thatof the neighbouring stands. Further, it is not always obvious what measureshould be used to represent the spatial problem. For example is it sufficientthat harvest areas are within a certain distance from each other, or shouldsome other requirement be satisfied when considering aggregation of har-84
vests? As a result, for the identified problems different formulations have beentested and suggested in the project for expressing spatiality in the optimization.This complexity has led to spatial aspects of the optimization often beingsolved by a heuristic method. However, the application of heuristic algorithmsoften means that the algorithms need to be specially designed, or atleast parameterized, for the specific problem being addressed. In addition,when dealing with problems including many constraints there could be difficultiesif the constraints are transformed to penalty functions and includedin the objective function. This could create problems in the relative weightingof these functions and poor convergence if there are non-continuitiesin the augmented objective function. Finally, it could be difficult to ensurethat the optimal solution is found, or at least a close to optimal solution. Analternative to heuristic techniques is to use an exact solution technique suchas mixed integer programming (MIP) with the branch and bound algorithm(Williams, 1985). One limitation of the branch and bound algorithm hasbeen the time required to locate the solution to a complex problem and,hence, the limited size of the problems that can be solved. However, recentdevelopments in optimization software systems and computer hardwarehave increased the scope for solving large-scale problems in a reasonabletime (Atamtürk and Svavelsbergh 2005; Johnson et al. 2000). As a result, theproblems addressed in the project have been formulated so that they could besolved with MIP and the branch and bound algorithm.User value<strong>The</strong> optimization tools developed within this project should be consideredas aids to generate different solutions that form the basis for decision-making.<strong>The</strong> tools will be designed to support rather than replace planners andresource specialists in the decision-making process. <strong>The</strong> tools should enabletrade-off analysis between economic values of timber production and effectson other utilities.Scientific resultsSpatial analysisWhen solving a forest planning problem, one may end up with a plan withvery large openings. To prevent this, an optimization problem can be formulatedas a so-called Area Restriction Model (ARM). We propose the termOpening Size Constrained Problem, but regardless of the terminology, thiskind of problem has been considered notoriously difficult to solve with exactmethods. However, in recent years, Goycoolea et al. (2005) presented avery strong MIP formulation that made it possible to solve quite large ARMproblems with exact methods (branch and bound) in a reasonable time. Onedrawback is that the problem formulation is quite complex and requiresadvanced GIS-analysis and programming before entering data into the optimizationmodel. In <strong>Heureka</strong>, the model of Goycoolea et al. (2005) has been85
adapted to the problem structure used in <strong>Heureka</strong>, and the necessary calculationshave been automated (Wikström & Öhman 2009). <strong>The</strong> user simplyselects a function called “Add Opening Size Constraints”, after which allrequired computations are made and all model parameters and equations areadded to the optimization model.A second aspect connected to spatial analysis is habitat modeling. <strong>The</strong>focus when using habitat suitability models in forest planning has often beento investigate the potential habitat area for certain species if a certain managementplan is applied (i.e. a “What if?” question is addressed). Anotherapproach when using habitat models in forest planning is to include the habitatmodels in the problem formulation and the optimization (i.e. “How to?”question). How should the forest area be managed if a certain area of habitatis desired? This question assumes that the habitat demand is included in theoptimization part of the planning process. As a result, a new general spatialhabitat model that could be included in the optimization and still allow theproblem to be solved with an exact solution method has been developed inconjunction with the biodiversity project (Öhman, Edenius & Mikusinski2009). <strong>The</strong> habitat model includes both suitability assessment of stand-wiseconditions and evaluation of the spatial context of the stand in a broaderlandscape (Fig. 26).Another feature that enables spatial analysis in PlanWise is the automaticaddition of shared borders between each pair of adjacent polygons. This featureenables the inclusion of clustering. During the <strong>Heureka</strong> project an approachfor two different clustering problems has been developed, the clustering of oldforest and the clustering of harvest areas (Öhman & Wikström 2007; Öhman& Eriksson 2009). <strong>The</strong> approach is built on the idea of minimizing the outsideperimeter of old forest and harvest areas, respectively. For example, if two adjacentstands are old forest in the same period the total perimeter of the old forestareas will be lower than if two non-adjacent stands with the same area andshape were saved. An advantage of using the perimeter as a criterion is that itmakes it possible to formulate and solve the problem as an MIP problem withthe traditional branch and bound algorithm.86
Figure 26. <strong>The</strong> spatial layout of habitat patches for Hazel Grouse at the end of the planninghorizon for cases a) without spatial consideration and b) with spatial consideration.Tactical and strategic planningPlanWise offers functionality to generate long-term treatment schedules, inwhich the planning period is divided into five-year time periods. For moreshort-tem planning, five-year periods are too coarse since it is necessary tocontrol the flow of product on a yearly basis. <strong>The</strong>refore, PlanWise now alsooffers functionality to generate short-term schedules, in which a typical planninghorizon is five to ten years, divided into one-year time steps. <strong>The</strong> sameoptimization model system is used for solving tactical optimization problems,PlanWise uses the same data structure in both strategic and tactical cases.From a strategic solution, or plan, the user can choose to start from that planand generate a more detailed tactical plan. Alternatively, the user can let thesystem generate tactical alternatives for each stand that is eligible for harvest(thinning, selection felling, final felling) during the tactical period. Thoseresults can then be used as input for VägRust (see the Operational planningproject) or solved as an optimization problem, probably with an upper boundfor harvested volume guided from a more long-term strategic plan.Fulfillment of objectives<strong>The</strong> original project plan was revised during the course of the project. Oneplanned objective was to develop methods for defining the geographicallocation of reserves. Due to a lack of time this was not possible during theproject time. However, one possibility when evaluating possible locations toreserve is to use the model for clustering old forest areas. Another undertakingfor which we did not reach the goal is undertaking number 6, developmentof the stand-level management model. <strong>The</strong> intention was to developa model allowing a target-oriented approach, i.e. one allowing managementprograms to be generated from goals set by the user and applicable forseparate, single-stand analysis (a primary desire for many users). <strong>The</strong> modelshould be used for separate, single-stand stand analysis, which is indeed aprimary request of many users. Although this goal was not reached, the longtermtreatment schedules, generated by PlanWise, could still be ranked by(for instance) the net present value.Future improvements include the addition of roads as entities in an optimizationmodel. This was a planned objective but was not reached. It willenable the clustering of harvest activities by coordinating harvest activitiesbetween stands that are linked to the same road segment. Another area ofimprovement is to develop robust optimization models that always result infeasible solutions. One problem with e.g. the ARM model described, is thata problem may be infeasible and only an advanced user may be able to finda workaround. A solution to this problem is to develop models that are formulatedin such a way that solutions will always be found. One step in this87
direction has been taken, but is still under improvement. Regarding habitatmodels, PlanWise for the moment only offers answers to “What if?” questions.Another future important improvement in PlanWise is therefore toinclude consideration of the habitat models in the optimization part. That is,PlanWise should in the future offer answers to “How to?” questions.Finally, the optimization model in PlanWise applies a modeling languagecalled ZIMPL. Optimization models are stored as files and can be sharedbetween users. Hence, optimization models can be developed and easily distributed.ReferencesScientific articlesÖhman, K. & Eriksson, L.O. 2009. Aggregating harvest activities in long term forestplanning by minimizing harvest area perimeters, accepted for publication in Silva Fennica.Öhman, K. & Wikström, P. 2008. Incorporating aspects of habitat fragmentation intolong-term forest planning using mixed integer programming. Forest Ecology and Management255(3-4): 440-446.Öhman, K., Edenius, L. & Mikusinski, G. 2009.Optimizing spatial habitat suitabilityand timber revenue in long-term forest planning:. Submitted to Canadian Journal of Forest<strong>Research</strong>.Wikström, P. & Öhman, K. 2009. Adaptation of MIP harvest scheduling models withopening size constraints to handle treatment programs, annual allowable cuts and roadaccess. Manuscript in prep.Working papersÖhman, K. 2007. Rumslig hänsyn i skoglig planering, SLU, Inst. för skoglig resurshushållning.Arbetsrapport 195.External referencesAtamtürk, A. & Savelsbergh, M.W.P.. 2005. Integer programming software systems.Annals of Operations <strong>Research</strong> 140(1): 67-124.Goycoolea, M., Murray, A.T., Barahona, F., Epstein, R., & Weintraub, A., 2005. Harvestscheduling subject to maximum area restrictions: Exploring exact approaches. Oper. Res.53, 490-500.Johnson, E.L., Nemhauser, G.L. & Savelsbergh, M.W.P. 2000. Progress in linear programming-basedalgorithms for integer programming: An exposition. Informs J. Comput.12(1):2–23.Öhman, K. 2001. Forest planning with consideration to spatial relationships. PhD. <strong>The</strong>sis.Acta Universitatis Agriculturae Sueciae, Silvestria 198, 32 pp.Williams, H. P. 1985. Modelbuilding in mathematical programming, John Wiley andSons.88
Multi-Criteria Decision AnalysisProject leader: Ljusk Ola Eriksson, Dept. of Forest Resource Management, SLU, Umeå.Participants: Anu Hankala, Carola Häggström, Peder Wikström, Karin Öhman, Dept.of Forest Resource Management, SLU, Umeå. Per Westerlund, Sogeti Sverige ABProject aimForest planning to date has predominantly meant planning of timber production.However, as interest is increasingly directed also towards non-timberforest values, new methods for planning are needed. Increasingly, the valueof forests cannot be considered purely in economic terms, but additionalgoals must be considered, such as conserving pleasant scenery or increasingpossibilities for recreation (Hörnsten 2000).Multi-criteria decision analysis [MCDA or MCDS (MCD Support) orMCDM (MCD Making)] is one approach that can be used to apply the variousobjectives in forest planning and analyze their relative importance in ananalytical manner. An MCDA process generally starts with the identificationof a problem or a goal, continues by assessing the importance and weight ofthe criteria and alternatives involved, and results in an overall ranking of thealternatives according to their importance (e.g. Belton & Stewart 2001, Kangas& Kangas 2005). A successful MCDA process will thus facilitate decisionmakers’understanding of the problem and its dimensions, and guide them toidentify and choose preferred courses of action for planning.<strong>The</strong> aim of this MCDA project was to develop and test a software applicationthat enables multi-criteria analysis of plans created in the PlanWiseapplication.Methods used in the projectSoftware development<strong>The</strong> software, named PlanEval, was built on three principles: it should be(i) possible to retrieve data easily and flexibly, (ii) based on well-establishedMCDA methods, and (iii) easy enough for users without prior knowledge ofMCDA to apply.<strong>The</strong> first design principle meant that it should be possible to access datafrom plans created by PlanWise within the application. In the program, theuser opens a PlanWise project and marks the plans that should be includedin the analysis. From that point onwards the user has direct access to all datacreated in PlanWise, whether it is scalars, diagrams or maps.<strong>The</strong> second requirement concerns the way the MCDA methods shouldbe employed in order for the user to evaluate different plans. <strong>The</strong> generalapproach of decision analysis is applied, meaning that the analysis processrests on a hierarchical description of objectives against which the plans areevaluated. <strong>The</strong>n follows the choice of techniques by which the preferencesshould be elicited, both for the objectives and the plans. At the moment possiblealternatives are the Analytic Hierarchy Process (AHP) and direct point89
allocation. <strong>The</strong> former is one of the best documented methods applied inforestry situations, while the latter is possibly intuitively easiest to understand;see Kangas et al. (2008) for an overview of methods.To ensure the usability of the software a cognitive walk-through was performedon a prototype of the program. Several difficulties, including ambiguoustaxonomy, were detected, some of which could be addressed beforethe field test. <strong>The</strong> walk-through also highlighted which parts of the processneeded to be conducted by the consultant and which parts could potentiallybe left to the end user, the forest owner.;.-3'
!"#$%&'N)';%&4&32-2",3',6'5-2-'6,%'2+&'&D-.$-2",3',6'E.-34O'$EE&%'2-J.&'/,7E-%&4'E.-3'
ership and long management experience. <strong>The</strong> study incorporated severalphases, including place inspections, positioning of special objects on maps andrepeated communications, by mail, on goals and constraints. Using the finalcriteria structure and identified constraints, the forest stands were specifiedinto domains and respective control categories to prepare for the simulationsin PlanWise. <strong>The</strong> estimated development of the forest estate was simulatedwith PlanWise, and three different development scenarios were optimizedunder slightly different criteria using an AIMMS model (Fig. 27).In a second meeting a user test was conducted with the owner and forestofficer together with two of the project staff, Hankala and Eriksson. Threeplans were analyzed during the test. A goal hierarchy was developed based ona preliminary structure presented by the authors (Fig. 28), the hierarchy wasweighted, and the plans were evaluated against each of the objectives of thehierarchy (Fig. 29 shows examples of screen shots of data presented duringthe evaluation of the plans). <strong>The</strong> AHP method was used for both weightinggoals and evaluating the plans.User value<strong>The</strong>re are some generally available MCDA software packages, such as HiView,V.I.S.A., Expert Choice, and Web-HIPRE; see French & Xu (2005) foracomparison of different methods. It is, of course, possible to analyze forestplanning problems with these general MCDA tools. However, the user mustthen prepare the data needed for the analysis separately, which takes time andlimits flexibility. <strong>The</strong> MCDA application developed here overcomes this difficulty;all data are available and the information that is presented, and how itis presented, can be adjusted during the process.<strong>The</strong> MCDA application provides the user with a well-established multiplecriteria method, offering a systematic way of analyzing a range of plans. Asthe user can simultaneously access the results database of the forest simulationsand optimizations it enables fluent changes from one view to another,for example from a map presentation to a diagram, from one preferred variableto another and scope for chronological assessments through the possibilityof changing the evaluation period.Scientific results<strong>The</strong> test of the application gave important insights into its strengths andweaknesses, which are still under evaluation. It can be noted that the users inthis case were able to state which plan was the most preferred and what theywanted as supplementary information concerning that plan.Shortcomings were also identified. <strong>The</strong> decision analysis methodology isby itself not self-evident. This also applies to AHP as an MCDA technique.This could make the process difficult to follow in the intended way withoutspending time to introduce the concepts and train the users (cf. Mendoza& Martins 2006, Kangas et. al. 2001, Wolfslehner et. al. 2005). Differentvariables can be shown differently – this requires adaptation and quick learningfrom the user. Thus, the flexibility of the program as such could pose92
problems. Spatial problems pose particular problems. One concerns theimportance of scale; some features may be difficult to detect or discriminatebetween plans due to the scale and the user may need help through additionalmetrics to focus on critical issues (Jankowski et al. 2001). Visualizationscould be useful (Sheppard & Meitner 2005). For a user who has a welldefinedobjective from the outset, trade-off analysis of particular issues in oneplan may be more relevant than the comparison of entire plans, i.e. the applicationdoes not provide an optimal match for all situations.Fulfillment of objectivesFurther research is needed to delimit the planning situations for which theMCDA application is particularly suitable. It is also necessary to examine theterminology and work flow, in detail, to ensure that the user can appreciatethe methodology.More technical improvements could also promote appropriate use of theapplication, including the addition of capabilities for a group decision supportsystem, GDSS, and to support participatory processes (the system is to somedegree prepared for use by several participants). <strong>The</strong> possibility to evaluateplans by value functions could reduce the burden on the user to make comparisons.It may also circumvent some of the conceptual problems in the useof the MCDA techniques by separating plans from criteria values.With continued field tests under diverse conditions and followingimprovements the MCDA application should become an integrated instrumentin the <strong>Heureka</strong> decision support tool kit.93
ReferencesScientific artiklesHankala, A., Wikström, P., and Eriksson, L.O. 2009. Using Software to support forestrydecision making with multiple goals: a case study with the MCDA application of the<strong>Heureka</strong> planning system. (in Prep).External referencesBelton, Valerie & Stewart, <strong>The</strong>odor J. (2001). Multiple Criteria Decision Analysis: Anintegrated approach. Kluwer Academic Publishers, Dortdrecht, <strong>The</strong> NetherlandsFrench, Simon & Xu, Dong-Ling (2005). Comparison study of multi-attribute decisionanalytic software. J. Multi-Crit. Decis. Anal. 13: 65-80Hörnsten, Lisa (2000). Outdoor Recreation in Swedish Forests – Implications for Societyand Forestry. Doctoral thesis. Swedish University of Agricultural Sciences. UppsalaJankowski, Piotr, Andrienko, Natalia and Andrienko, Gennady (2001). Map-centredexploratory approach to multiple criteria spatial decision making. Int. J. GeographicalInformation Science 15 (2): 101-127Kangas, Annika, Kangas, Jyrki & Kurttila, Mikko (2008). Decision support for forestmanagement. [Dordrecht]: SpringerKangas, Jyrki & Kangas, Annika (2005). Multiple criteria secision support in forest management– the approach, methods applied, and experiences gained. Forest Ecology andManagement 207: 133-143Kangas, Jyrki, Kangas, Annika, Leskinen, Pekka and Pykäläinen, Jouni (2001). MCDMMethods in strategic planning of forestry on state-owned lands in Finland: Applicationsand experiences. J. Multi-Crit. Decis. Anal. 10: 257-271Mendoza, G. A. and Martins, H. (2006). Multi-criteria decision analysis in naturalresource management: A critical review of methods and new modeling paradigms. ForestEcology and Management 230: 1-22Sheppard, Stephen R.J. and Meitner, Michael (2005).Using multi-criteria analysis andvisualisation for sustainable forest management planning with stakeholder groups. ForestEcology and Management 207: 171–187Wolfslehner, Bernhard, Vacik, Harald and Lexer, Manfred J. (2005) Application of theanalytic network process in multi-criteria analysis of sustainable forest management. ForestEcology and Management 207: 157–17094
Forest owner behaviour and dynamicsProject leader: Lennart Eriksson, Dept. of Forest Products, SLU, Uppsala.Participants: Fredrik Ingemarson, Dept. of Forest Products, SLU, Uppsala.Project aim<strong>The</strong> aim of this project was to construct models for predicting private forestowners’ behaviour, in terms of plantation, pre-commercial and commercialthinning and final cuts. <strong>The</strong> ambition is to use these models for prognoses offorest activities among private forest owners in the <strong>Heureka</strong>system.<strong>The</strong> conveyance of real estate, and the importance of changes in decisionbehaviour, appeared to be difficult to describe, since transactions with legalratification (investigated in this study) do not include all transactions involvingreal estate.Methods used in the projectTobit-analyses (Amemiya 1984) were performed on the results of a survey offorest owners (1200 replies), in order to estimate prognostic models of forestowner behaviour. Data on 5590 transactions of estates with legal ratificationfrom 1990 to 2007, and two censuses of forest owners, were also subjected tostatistical analyses. <strong>The</strong> ambition was to discover structural trends in the ownershipof forest estates in terms of forest area of the estates, the owners’ livelihoodin relation to the estate, gender, age, etc. Interviews were performedwith estate agents as well as with owners involved in the conveyance of realestates during the last three years.User valuePrognoses of forest owner forestry behaviour are possible, given scenario valuesof the structure development of the forest owners.Scientific resultsModels for prognosis of forest activity decisions<strong>The</strong> owners of large forest estates are generally more active per hectare forestarea than the owners of small ones. At the same time the activity on forestestates in southern Sweden is greater than on those in the north, althoughthe northern forest estates are larger on average than those in the south.<strong>The</strong> state of the forest (estimated by kNN’s satellite-based data) expressed asstanding volume per hectare forest area and the area-weighted proportion offorest older than 20 years is positively correlated to the extent of both thinningsand final cuts. Young forest owners are generally more active in allforest operations than older forest owners. One variable, duration of possession,shows a varying relation to activity, since owners who have possessedtheir estates for 0-10 years are more active than others, but activity increaseswith time amongst owners who have had their estates for a very long time.Men are more active in all operations than women, but a nuanced interpretationof the data is that the latter group prefers commercial thinning and95
the former final cuts. Owners who live outside the county in which theirestate is situated are less active in operations such as pre-commercial thinnings,commercial thinnings and (sometimes) final cuts than owners who livein the same county. Thinning is much less frequently practiced in the northof Sweden. <strong>The</strong> patterns for planting operations are similar to those for finalcuts. For the frequencies of plantation (sometimes) and pre-commercial thinninganother significant variable, which is not relevant for other operations,is the form of conveyance (inheritance or purchase): buyers of forest estatesperform these silvicultural operations more diligently than other classes ofowners.<strong>The</strong> study of conveyances of forest estatesIt was found that the database of transactions (conveyances) with legal ratificationcovers only a proportion of all transaction events in Sweden. Consequentlyit is not possible to formulate realistic models for changes of forestowner structure over time. <strong>The</strong> conveyance of a forest estate follows oldtraditions but with modifications, which will gradually but markedly changethe structure of forest owners. <strong>The</strong> following findings were obtained fromthe material in the study, but it does not give the complete picture. Menoverall acquire estates from women, but this strong effect is probably neutralizedby trends in transactions without legal ratifications and consequently notincluded in the material considered in this study. Men dominate in purchasesof estates from persons outside the family, while women often acquire estatesin the form of inheritances or bequests. When a forest estate is disposed of,the former owner is on average 63 years old with a tendency to increase overtime, while the age of the new owner has remained on average 45 years.Men predominate as chosen representatives in cases where there are pairs ofnew owners (who are usually a husband and wife, but may be two brothers,two sisters, or some other pair). When an estate with two or more owners(usually two siblings) is disposed of the distribution of owner representationof men and women is equal. Far more women dispose of estates than theyacquire estates according to this database, which presumably must be counteractedby transactions without legal ratifications, and consequently are notincluded in the examined register, e.g. when the ownership of an estate shiftsafter a partner dies.<strong>The</strong> number of people who acquire a forest estate is smaller, on average,than the number who dispose of one, but estates are acquired by a single personless frequently than they are disposed of by a single person. <strong>The</strong> proportionof owners living outside the municipality in which the estate is situatedis increasing for estates that are transferred to another owner. <strong>The</strong> proportionof inheritances/bequests out of the legally ratified transactions is 0.40 to 0.46.Some increase in this proportion has been connected to the repeal of taxes oninheritances/bequests.Studies of census data indicate that the total forest area in estates withless than 100 hectares of forest is decreasing, while the corresponding areain estates with more than 100 hectares is increasing. <strong>The</strong> flow of forest96
area between these size groups has amounted, over two decades, to somehundreds of thousands of hectares. A successively higher proportion of theforest area is managed by more large-scaled companies, but the arithmeticmean of the forest area of the average forest company (estate) has remainedunchanged, since areas are transferred between companies, but the companiesstill exist.<strong>The</strong> survey study covering an area-weighted selection of forest estatesincluding questions giving a time-perspective of the ownership, are howeverdifficult to interpret. With increasing time of possession, the ownership bymen rises. This may be because women are increasingly regarded as responsibleowners in modern acquisitions. Another possible explanation is thatwomen tend to own their estates for a shorter time than men. Non-familypurchases (most often by men) seem to have increased with time. Increases inpossession time are associated with increases in the likelihood that the ownerslive within the community of the estate, this correlation is interpreted asan indication that the frequency of acquisitions by persons living outside theestate community is increasing.Interviews with estate agents and estate valuers as well as with persons,actively involved in the transfer of estates over the last three years, confirmmost of the above conclusions. Moreover, they show that great considerationis taken of possibilities for education, external and social conditions at thetime of a decision to dispose of or acquire a forest estate. <strong>The</strong>se functions willmove away from the forest regions where the forest estates are often situated,due to urbanisation processes, whilst the proportion of owners livingoutside the community of the estate increases. <strong>The</strong> interviews indicate anincreased transfer of estates back to people living near the estates. A frequentand maybe increasing group of people are part-owners of estates. <strong>The</strong> earliernormal ambition, to buy out siblings, is no longer evident, because all ownershave other sources of income and occupations. An often mentioned class offorest owner with money to spend, has an external occupation and lives notfar from the estate. In this group there is a potential for size rationalizationof forestry. Requirements for the traditional forest owner group (owners livingon or near their estates) to dominate among owner categories is access tosocial service, and external occupation and social relations.Fulfillment of objectivesSignificant models of prognosis for private forest owner’s behaviour were successfullyestimated. However, the conveyance of real estates (which influencestheir behaviour in a long-time perspective), and the importance of changesin decision behaviour, appeared to be difficult to describe, since transactionswith legal ratifications (investigated in the study) do not include all real estatetransactions. New attempts should be made to improve knowledge in thisarea.97
ReferencesScientific articlesIngemarson I., Lindhagen A. & Eriksson L. A typology of small-scale private forest ownersin Sweden. Scand. J. For. Res. 2006; 21:249-259.Eriksson, L. & Olsson, U. 2008. A model predicting silviculture and cut for Swedish privateforest owners. Article in preparation.Working papersEriksson L. 2008.Treatment decisions in privately owned forestry. Report 11/2008.Dept. of Forest Products. Swedish University of Agricultural Sciences. ISSN:1654-1383.In Swedish with English summary.External referencesAmemiya, T. 1984. Tobit models: a survey. Journal of Econometrics, 24, 3-61.98
<strong>Programme</strong> managementWhen the second phase of the research programme began it was turned intoa ‘thematic research programme’ based at the SLU Faculty of Forest Science.At the same time the organization and leadership were changed. A steeringcommittee with representatives from users and financers was formed anda program leader was appointed. <strong>The</strong> projects were organized in five subprogrammes,see Fig. 2 in the <strong>Research</strong> programme chapter. A programmemanagement group was formed by the sub-programme leaders and to providesupport there were an assisting programme leader, an administrator, anda communicator. Experiences of the management of the research programmein its second phase are presented in an administrative report.Steering committee meetingstypically included seminarsand excursions on topical issues.Here Magnus Larsson,SCA Forest and chairmanof the steering committeein the second phase ofthe <strong>Heureka</strong> research programme,studies fast growingpoplar on the Björnstorpestate in the southernmostpart of Sweden.Photo Tomas Lämås.99
Steering committeeMagnus Larsson, SCA Skog AB (Chairman)Patrik Alströmer, Östads StiftelseGert Andersson, SkogforskMagnus Fridh, the Swedish Forest AgencyErik Karltun, SLU (2008-2009)Maj-Britt Johansson, SLU (2005-2008)Ola Sallnäs, SLUSune Sohlberg, the Swedish Environmental AgencyUrban Nilsson, SLU (2008-2009)Göran Ståhl, SLU (2005-2008)<strong>Programme</strong> directorTomas Lämås, Dept. of Forest Resource Management, SLU, UmeåSupport functionsAssistant programme directorDr Johan Sonesson, Skogforsk, UppsalaAdministratorYlva Jonsson, Dept. of Forest Resource Management, SLU, UmeåCommunicatorSusanne Sjöberg, Dept. of Forest Resource Management, SLU, UmeåSub-programme (SP) leadersSP1 Forest ecosystem development:Prof. Björn Elfving, Dept. of Forest Ecology and Management, SLU, UmeåSP2 Forest goods and services:Associate Prof. Lars Edenius, Dept. of Wildlife Fish, and Environmental Studies, SLU,UmeåSP3 Data acquisition:Dr Jörgen Wallerman, Dept. of Forest Resource Management, SLU, UmeåSP4 Decision support methodologies:Prof. Ljusk Ola Eriksson, Dept of Forest Resource Management, SLU, Umeå (2009).Dr Karin Öhman, Dept. of Forest Resource Management, SLU, Umeå(on parental leave 2009)SP5 Applications and System Design:Dr Peder Wikström, Dept. of Forest Resource Management, SLU, Umeå.100
Funding and expenditureFunding<strong>The</strong> second phase of the <strong>Heureka</strong> research programme ran in the form of athematic research programme based at the Faculty of Forest Science, SLU,October 2005 – September 2009. <strong>The</strong> account was, however, closed inDecember 2009. During this period <strong>Heureka</strong> had a total budget of42 000 kSEK.<strong>The</strong> four contributors to the <strong>Heureka</strong> funding were:MISTRA12 000 kSEKSkogsindustrierna 10 000 kSEKKEMPE Foundations 10 000 kSEKSLU10 000 kSEKTotal42 000 kSEKSkogforsk has also contributed funding for certain projects in which Skogforskhas special competence and interests. <strong>The</strong>se projects have been fundedby Skogforsk totally or partly, and this part of the funding is not included inthe <strong>Heureka</strong> programme budget.Expenses<strong>The</strong> expenses for the research programme can mainly be divided into threeparts: expenses for synthesis, thematic research projects, and programmemanagement. <strong>The</strong> largest part (42 %) was allocated to synthesis, which coincideswith sub-programme 5, Application and system design. This includeddesign of the applications (software) of the <strong>Heureka</strong> system, system designand programming, and education and training. System design and programminghave been performed by SLU employees and external consultants. <strong>The</strong>costs of external consultants comprise a substantial part, but have still beenfound to be cost efficient. <strong>The</strong> second largest part (39 %) funded the morethan 15 thematic research projects in sub-programmes 1 – 4. <strong>The</strong> last part (19%) concerns programme management, i.e., costs for the steering committee,programme leader, and support staff, i.e. assistant programme leader, administrator,and communicator (including funds for communication). This partalso included costs of external services related to programme management,common activities, and travel related to programme management, includingcommunication.101
+!!:6; %& ?'@ 3=@ %'@9+5+8)9)5/
Publications in phase I and phase IIof the research programme<strong>The</strong> list below covers all publications produced within the <strong>Heureka</strong> researchprogramme.<strong>The</strong> publications are divided in:• Scientific articles• Doctoral theses• Master theses• Reports• Working papers• Papers in conference proceedings• Popular scientific publications• Other publications (e.g. programme plans)<strong>The</strong> scientific articles in bold are published in a supplement to ScandinavianJournal of Forest <strong>Research</strong>, containing selected results from the first phase ofthe <strong>Heureka</strong> research <strong>Programme</strong> (Scandinavian Journal of Forest <strong>Research</strong>,Vol. 21, February 2006, Supplement No. 7.Scientific articlesAndersson M., Dahlin B., Erikers K. & Sallnäs O. 2005. Multi-objective forest landscapeprojection modelling – problems and prospects. Journal of Sustainable Forestry 21:2/3175-197.Andersson M., Dahlin B. & Mossberg M. 2005. <strong>The</strong> forest time machine – a multi-purposeforestry decision support system. Computers and Electronics in Agriculture 49:114-128.Backéus, S ., Wikström, P., and. Lämås, T. 2005. A model for regional analyses of carbonsequestration and timber production. Forest Ecology and Management 216: 28-40Backéus, S ., Wikström, P., and. Lämås, T. Carbon sequestration in Swedish forest standsunder various management regimes. (manuscript) In Backéus S , 2009. Forest ManagementStrategies for CO2 mitigation. Acta Universitatis Agriculturae Sueciae 2009:89(Doctoral <strong>The</strong>sis). 47s, ISBN : 978-91-576-7436-4Barth, A., Lind, T., Pettersson, H. & Ståhl, G. 2006. A framework for evaluating dataacquisition strategies for analyses of sustainable forestry at national level. ScandinavianJournal of Forest <strong>Research</strong> 21, Supplement 7:94-105Bergh, J., Freeman, M. & Räisänen, J. Modelling regional effects of global change on netprimary production in Scandinavia. Manuscript in prep. Global Change Biology.Boman, M. 2005. To pay or not to pay? - A ratio scale interpretation of polychotomousquestions with uncertain response options. Manuscript.Boman, M. & Mattsson, L. 2005. Trade-offs in forest utilization from a sustainability perspective.Accepted for publication in Journal of Sustainable Forestry.Boman, M., Berg, C., Ahlroth, S., Bostedt, G., Mattsson, L. & Gong, P. 2005a. Environmentalaccounting through adaptation of contingent valuation methodology: A proposal.Submitted.103
Boman, M., Norman, J., Kindstrand, C. & Mattsson, L. 2005b. On the budget fornational environmental objectives and willingness to pay for protection of forestland.Submitted.Bostedt, G. & Mattsson, L., 2005. On the benefits and costs of adjusting forestry to meetrecreational demands. Submitted.Bostedt, G., Parks, P.J. & Boman, M. 2003. Integrated natural resource management innorthern Sweden: An application to forestry and reindeer husbandry. Land Economics79(2), pp. 149-159.Edenius, L. & Mikusiński, G. 2006. Utility of habitat suitability models as biodiversityassessment tools in forest management. Scandinavian Journal of Forest <strong>Research</strong> 21,Supplement 7:62-72.Edenius, L. & Mikusiński, G., et al. Matching national bird breeding surveys with foresthabitat data: influence of spatial and structural components of the data. Submitted toecography.Edman, T., Angelstam, P., Mikusiński, G., Roberge, J.-M., Gromadzki, M. & Carlson, A.Assessment of forest landscapes´ conservation value using umbrella species requirements:spatial evaluation of a meta-population model in Poland. Manuscript.Elfving, B. & Jakobson, R. 2006. Effects of retained trees on tree growth and field vegetationin Pinus sylvestris stands in Sweden. Scandinavian Journal of Forest <strong>Research</strong> 21,Supplement 7:29-36.Elfving, B., Freeman, M. & Mörling, T. 200X. Correlation between weather conditionsand tree growth for Scots pine and Norway spruce in northern Sweden 1980 – 2001.Manuscript in prep.Elfving, B. 2009. Natural mortality in thinning and fertilization experiments with pineand spruce in Sweden. (submitted)Elfving, B. 2009. Top height development in thinning and fertilization experiments withpine and spruce in Sweden. (submitted)Eriksson, E. Gillespie, A.R. Gustafsson, L. Langvall, O. Olsson, M. Sathre, R. Stendahl, J.2007. Integrated carbon analysis of forest management practises & wood substitution.Canadian Journal of Forest <strong>Research</strong> 37 (3), 671-681.Eriksson L. A model predicting silviculture and cut for Swedish private forest owners.Manuscript.Erikson, M. & Olofsson, K., (2005). Comparison of three individual tree crown detectionmethods. Machine Vision and Applications. 14(4), 258-265Eriksson, L.O. 2006. Planning under uncertainty at the forest level – A system approach.Scandinavian Journal of Forest <strong>Research</strong> 21, Supplement 7:111-117.Fahlvik, N. & Nyström, K. 2006. Models for predicting individual tree height incrementand tree diameter in young stands in southern Sweden. Scandinavian Journal of Forest<strong>Research</strong> 21, Supplement 7:16-28.Fahlvik, N., Agestam, E., Nilsson, U. & Nyström, K. 2005. Simulating the influence ofinitial stand structure on the development of young mixtures of Norway spruce andbirch. For. Ecol. Manage. 213: 297-311.Forsberg M., Frisk M. & Rönnqvist, M. 2005. FlowOpt – a decision support tool forstrategic and tactical transportation planning in forestry. International Journal of ForestEngineering, vol 6. No2 pp. 101-114 July 2005Fraver S., Ringvall A. & Jonsson B-G. 2007. Refining volume estimates of down woodydebris. Canadian Journal of Forest <strong>Research</strong>, 37: 627-633104
Freeman, M., Severinsson, T., Morén, A.-S. & Linder, S. 200X. Coarse root biomass ofNorway spruce (Picea abies [L.] Karst.): results from excavation of whole root systems inunfertilised and fertilised stands in Northern and Southern Sweden. Manuscript in prep.Freeman, M. & Sahlée, E. 2009. Effects of climate change on net primary production ofSwedish forests. Manuscript in prep.Freeman, M. Wikström, P., Elfving, B. 2009. Adjustment of an empirical growth and yieldmodel to account for effects of climate change on forest production. Manuscript in prep.Gilichinsky, M., Heiskanen, J., Wallerman, J., Egberth, M., and Nilsson, M. 2009. Histogrammatching for post-processing of stem volume estimates imputed from forest inventoryand satellite data. Submitted to Remote Sensing of Environment.Gong, P., Boman, M. & Mattsson, L. 2005. Nontimber benefits, price uncertainty andoptimal harvest of an even-aged stand. Forest Policy and Economics 7:283-29.Hankala, A., Wikström, P., and Eriksson, L.O. 2009. Using Software to support forestrydecision making with multiple goals: a case study with the MCDA application of the<strong>Heureka</strong> planning system. (in Prep).Hannrup, B. et al. (manuscript). Models for predicting MOE and MOR on centerboardsfrom logs of Norway spruce.Hugosson, M. & Ingemarson, F. 2004. Objectives and Motivations of Small-scale Forestowners; <strong>The</strong>oretical Modelling and Qualitative Assessment. Silva Fennica 38 (2), 217-231.Huhtala, A., Toppinen, A. & Boman, M. 2003. When the theory is not enough – valuationof forest resources with “efficiency” prices in practice. Journal of Forest Economics9, 205-222.Ingemarson F., Hedman L. & Dahlin B. 2004. Nature conservation in forest managementplans for small-scale forestry in Sweden. Small-scale Forest Economics, Management andPolicy, 3(1):17-34, 2004Ingemarson, F., Lindhagen A. & Eriksson L. 2005. Small-scale forestry in Sweden – owners’objectives, silvicultural practices and management plans. Accepted for Scand. J. For.Sc.Ikonen, V-P. Peltola, H. Wilhelmsson, L. Kilpelaäinen, A. Väisänen, H. Nuutinen, T. Kellomäki,S. 2008. Modelling the distribution of wood properties along the stems of Scotspine (Pinus sylvestris L.) and Norway spruce (Picea abies (L.) Karst.) as affected by silviculturalmanagement. Forest Ecology and Management 256. pp 1356–1371.Jakobsson, R. and Elfving, B. 2004. Development of an 80-year old mixed stand withretained Pinus sylvestris in northern Sweden. For. Ecol. Manage. 194: 249-258.Jakobsson, R. & Elfving, B. 2005. Retained pines growth pattern and growth variation asmeasured on increment cores from standing trees. Manuscript under revision.Karlsson, J., Rönnqvist, M. & Frisk, M. 2006. RoadOpt - A decision support system forroad upgrading in forestry. Scandinavian Journal of Forest <strong>Research</strong> 21, Supplement 7:5-15.Karlsson P. E., Pleijel H., Belhaj M., Danielsson H., Dahlin B., Andersson M., HanssonM., Munthe J. & Grennfelt P. 2004. An economic assessment of the negative impacts ofozone on the crop yield and forest production at the Östad Estate in south-west Sweden.AMBIO 34(1):32-40.Lindhagen, A. 2005a. Predicting recreation value of Swedish forest stands. Manuscript.Lohmander, P. & Olsson, L. 200X, Adaptive optimisation in the roundwood supply chain.Submitted to <strong>The</strong> International Journal of Systems Sciences105
Lu, F. & Lohmander, P. 200X, Optimal mixed stand management under risk. Submittedto <strong>The</strong> International Journal of Systems Sciences.Lyon, S.W. Sörensen, R. Stendahl, & J. Seibert, J. 200X. Using landscape characteristics todefine an adjusted distance metric for improving kriging interpolations. (submitted).Lämås, T., Dahlin, B., Olsson, H. Sallnäs, O. & Stenlid, J. 2006. Selected Results from thefirst phase of the <strong>Heureka</strong> <strong>Research</strong> Programem. Preface. Scandinavian Journal of Forest<strong>Research</strong> 21, Supplement 7:3-4.Lämås, T. and Eriksson, L.O. 2003. Analysis and planning systems for multi-resource, sustainableforestry - <strong>The</strong> <strong>Heureka</strong> research programme at SLU. Can. J. For. Res. 33(3):500-508Magnusson, M., and Fransson, J.E.S. 2005. Estimation of forest stem volume using multispectraloptical satellite and tree height data in combination, Scandinavian Journal ofForest <strong>Research</strong>, vol. 20, no. 5, pp. 431-440.Manton, M. G., Angelstam, P. and Mikusiñski, G. 2005. Modelling habitat suitability fordeciduous forest focal species - a sensitivity analysis using different satellite land coverdata. Landscape Ecology 20: 827-839.Mattsson, L., Boman, M., Ericsson, Paulrud, A., Laitila, T., Kriström, B. & Brännlund,R. 2005. Welfare foundations for efficient management of wildlife and fish resources inSweden. In “Consumptive Wildlife Tourism – Hunting, Shooting and Sportfishing” (EditorB. Lovelock). Routledge. Submitted.Mikusiński, G., Pressey, R. L., Edenius, L., Kujala, H., Moilanen, A., Niemelä, J., &Ranius, T. 2007. Conservation planning in forest landscapes of Fennoscandia and anapproach to the challenge of countdown 2010. Conservation Biology 21: 1445-1454.Mikusiński, G. & Edenius, L. 2006. Assessment of spatial functionality of old forest inSweden as habitat for virtual species. Scandinavian Journal of Forest <strong>Research</strong> 21, Supplement7: 73-83.Moberg, L. 2006. Predicting knot properties of Picea abies and Pinus sylvestris fromgeneric tree descriptors. Scandinavian Journal of Forest <strong>Research</strong> 21, Supplement 7:48-61.Moberg, L. & Nordmark, U. 2005. Predicting lumber volume and grade recovery forScots pine stems using tree models and sawmill conversion simulation. Forest ProductsJournal. In press.Nilsson, M., Holm, S., Wallerman, J., Reese, H. and Olsson, H. 2009. Estimating annualcuttings using multi-temporal satellite data and field data from the Swedish NFI. InternationalJournal of Remote Sensing, 30: 5109–5116.Nuutinen, T. Kilpeläinen, A. Hirvelä,H. Härkönen, K. Ikonen, V-P. Lempinen, R. Peltola,H. Wilhelmsson, L. Kellomäki, S. 2009. Future wood and fibre sources – case North Kareliain eastern Finland. Silva Fennica 43(3). pp 489-505.Nyström, K. & Söderberg, U. 2002. System of single-tree growth models as a basis forecological applications in multipurpose forestry. SLU, Dept. of Forest Resource Managementand Geomatics. Manuscript.Olofsson, K., Wallerman, J., Holmgren. J. & Olsson, H. 2006. Tree species discriminationusing Z/I DMC imagery and template matching of single trees. Scandinavian Journal ofForest <strong>Research</strong> 21, Supplement 7:106-110.Olsson.L., Lohmander.P. 2005. Optimal forest transportation with respect to road investments,Forest Policy and Economics 7(3): 369-379.106
Pettersson, H. & Ståhl, G. 2006. Functions for Below-Ground Biomass of Pinus sylvestris,Picea abies, Betula pendula and B. pubescens in Sweden. Scandinavian Journal of Forest<strong>Research</strong> 21, Supplement 7:84-93.Pukkala, T., Möykkynen, T., Thor, M., Rönnberg, J. and Stenlid, J. 2005. Modelling infectionand spread of Heterobasidion annosum in even-aged Fennoscandian conifer stands.Canadian Journal of Forest <strong>Research</strong> 35: 74-84Reese, H., Nilsson, M., and Olsson, H. 2009. Comparison of Resourcesat-1 AWiFS andSPOT-5 data over managed boreal forests. International Journal of Remote Sensing, 30:4957–4978.Ringvall, A. 2010. Comparison of estimates of stand variables based on plot inventorieswith simple random sampling, stratification and calibration estimation. Manuscript inprepRoberge, J. M., Mikusiński, G. & Svensson, S. <strong>The</strong> white-backed woodpecker: umbrellaspecies for forest conservation planning? Biodiversity & Conservation. 17 (10), pp. 2479-2494Sandström, F., Petersson, H., Kruys, N., Ståhl, G. 200X. Biomass conversion factors bydecay classes for dead wood in boreal forests of Sweden. Manuscript.Sandström, U. G., Angelstam, P. and. Mikusiński, G. 2006. Ecological diversity of birds inrelation to the structure of urban green space. Landscape and Urban Planning.77: 39-53.Seibert, J. Stendahl, J. Sörensen R. 2007. Topographical influence on soil properties inboreal forest soils. Geoderma 141, 139–148.Stendahl, J.,Johansson, M-B., Eriksson, E. & Langvall, O. 2009. Soil organic carbon inSwedish spruce and pine forests- differences in stock levels and Regional patterns. Manuscriptin prep.Thor, M., Arlinger, J. & Stenlid, J. 2005. Heterobasidion root rot in Picea abies – modellingeconomic outcomes of stump treatment in Scandinavian coniferous forests. Submittedto Scandinavian Journal of Forest <strong>Research</strong>.Thor, M., Ståhl, G. & Stenlid, J. 2005. Modelling root rot incidence in Sweden using tree,site and stand variables. Scandinavian Journal of Forest <strong>Research</strong> 20(2), 165-176.Tomppo, E., Olsson, H., Ståhl, G., Nilsson, M., and Katila, M. 2007. Creation of forestdata bases by combining National Forest Inventory Field Plots and Remote SensingData. Remote Sens. of Environ. 112:1982-1999.Wallerman, J. & Holmgren, J. 2005. Data capture for forest management planning usingsample plot imputation based on spatial statistics, laser scanner and satellite image data.Manuscript submitted to Remote Sensing of the Environment.Wallerman, J., & Holmgren, J. 2007. Estimating field-plot data of forest stands using airbornelaser scanning and SPOT HRG data. Remote Sensing of Environment 110 (4):501-508.Wikberg, P-E. & Elfving, B. 2005. Modelling ingrowth of saplings into the tree layer inSwedish forests. Manuscript under revision.Wikberg, P-E., Elfving, B. and Kempe, G. Modelling advance growth density and distributionin Swedish forests. Silva Fennica. Under revision.Wikström, P. & Öhman, K. A mixed-integer programming model for optimal clusteringof harvest activities. Manuscript submitted to Forest Science.Wikström, P. & Öhman, K. 2009. Adaptation of MIP harvest scheduling models withopening size constraints to handle treatment programs, annual allowable cuts and roadaccess. Manuscript in prep.107
Wilhelmsson, L. 2006. Two models for predicting the number of annual rings in crosssectionsof tree stems. Scandinavian Journal of Forest <strong>Research</strong> 21, Supplement 7:37-47.Wilhelmsson et al. (manuscript) Models for predicting Green density of logs from Norwayspruce and Scots pine.Öhman, K. & Wikström, P. Incorporating aspects of habitat fragmentation into longtermforest planning using mixed integer programming. Forest Ecology and Management,255(3-4):440-446.Öhman, K., Seibert, J., & Laudon, H. Optimal timber harvest scheduling with considerationto dissolved organic carbon in streams. Manuscript.Öhman, K., Edenius, L., & Mikusinski, G. Optimizing spatial habitat suitability andtimber revenue in long-term forest planning: a case study of the habitat demands ofHazel Grouse. Submitted to Canadian Journal of Forest <strong>Research</strong>.Öhman, K & Eriksson, L.O. 2009. Aggregating harvest activities in long term forestplanning by minimizing harvest area perimeters. Accepted for publication in Silva FennicaDoctoral <strong>The</strong>sesA minor informal “research school” was running in the first phase of the <strong>Heureka</strong>research programme.Backéus S. 2009. Forest management strategies for CO2 mitigation Acta UniversitatisAgriculturae Sueciae, Doctoral thesis No. 2009:89Barth A. 2007. Spatially comprehensive data for forestry scenario analysis : consequencesof errors and methods to enhance usability Acta Universitatis Agriculturae Sueciae, Doctoralthesis No. 2007:101Ingemarson, F. 2004. Small-scale forestry in Sweden – owners’ objectives, silviculturalpractices and management plans. Acta Universitatis Agriculturae Suecica, Silvestria 318.Jakobsson, R. 2005. Growth of retained Scots pines and their influence on the new stand.Acta Universitatis Agriculturae Sueciae, Doctoral <strong>The</strong>sis No. 2005:34.Lu, F. 2004. Optimization of forest management decision making under conditions ofrisk. Acta Universitatis Agriculturae Suecica, Silvestria 333.Magnusson, M. 2006. Evaluation of remote sensing techniques for estimation of forestvariables at stand level. Swedish University of Agricultural Sciences, Acta UniversitatisAgriculturae Sueciae, Doctoral thesis No. 2006:85.Thor. M. Heterobasidion root rot in Norway spruce. Modelling incidence, control efficacyand economic consequences in Swedish forestry. Acta Universitatis AgriculturaeSuecica. Doctoral thesis No. 2005:5.Wikberg, P-E. 2004. Occurrence, morphology and growth of understory saplings inSwedish forests. Acta Universitatis Agriculturae Suecica, Silvestria 322.Master <strong>The</strong>sesBergsten, M. 2005. Skogsmarksgödsling – en ekonomisk analys av gödslingsstrategier förett skogsinnehav i norra Sverige [Forest fertilization – an economic analysis of differentfertilization strategies for a forest holding in northern Sweden]. Arbetsrapport 148(Master thesis), Dept of Forest Resource Management and Geomatics, SLU, Umeå (InSwedish).Chaminade, G. 2005. Topography, vegetation and soil carbon-nitrogen ratio in boreal108
forests at the landscape level. MSc thesis at the Dep. of Forest Soils, SLU, 12.Hedwall, P-O. 2004. Attitudes towards protection of biodiversity in forests – A case studyof forest owners in Skåne, Sweden . MSc thesis nr 59, Southern Swedish forest researchcentre, SLU, Alnarp. Supervisors: Leif Mattsson and Ola Sallnäs.Larsson, H. 2009. Flygburen laserskanning kopplat till skördarmätning för datainsamlingtill operativ planering. SLU, Institutionen för skoglig resurshushållning, Working ReportVol. 260. (In Swedish with English summary).Nilsson, M. 2005. Tillväxt i kantzoner i tallskog i Västerbotten. / Growth in edgezonesin Scots pine forests in Västerbotten. SLU, Dept. of Silviculture. (Graduate thesis),2005-5. (In Swedish.)Ågren, D. 2005. Growth response of retained trees in Hagner’s “Liberich” experiments.SLU, Dept. of Silviculture. Examensarbete (Gradual thesis) 2005-5.ReportsDahlin, B., Ekö, P.-M., Holmgren, P., Lämås, T. & Thuresson, T. 1997. <strong>Heureka</strong> - enmodell för skogshushållning. Ett strategi dokument utarbetat vid Skogsvetenskapligafakulteten, SLU. SLU, Skogsvetenskapliga fakulteten. Rapport 17. 115 pp. (In Swedishwith English summary).Ekenstedt, F. Grahn, T., Hedenberg, Ö. Lundqvist, S.-O., Arlinger, J. & Wilhelmsson, L.2003. Variations in fiber dimensions of Norway spruce and Scots pine. Swedish Pulp andPaper <strong>Research</strong> Institute, Stockholm, Sweden STFI Report PUB 13, 36 pp.Ekstrand, M. and Skutin, S-G. 2004. Brister i informationshanteringen försvårar transportledningen.Skogforsk, Resultat No. 18, 2004 (in Swedish with English summary).Freeman, M. & Elfving, B. 200X. Empiriska produktionsmodeller och klimatförändringar– tillämpning av processbaserad modellering (Empirical growth models and climatechange – applying process based modelling). Report in prep.Frisk, M. 2005. FlowOpt – en väg till effektivare virkesflöden. Skogforsk, Resultat No. 8,2005 (in Swedish with English summary).Frisk, M. 2005. Analys av virkesflöden med FlowOpt – tre fallstudier. Skogforsk, ResultatNo. 15, 2005 (in Swedish with English summary).Forsberg, M. 2003. Samordning kan ge billigare virkestransporter. Skogforsk, Results No.12, 2003 (in Swedish with English summary).Ingemarson, F. (Ed.) 2005. Har skogen mer att ge? Analysverktyg för framtidens, miljö,produktion och sociala värden. (Can the forest deliver more? Tools for analyses of futureenvironment, production and social values.) Faculty of forestry, SLU. Report 20. Umeå.(In Swedish with English summary).Mattsson, L., Boman, M. & Kindstrand, C. 2004a. Privatägd skog: Värden, visioner ochforskningsbehov. Rapport SUFOR/Brattåsstiftelsen. ISBN 91-576-6622-9. (In Swedish).Moberg, L. & Wilhelmsson, L. 2003a. Nya beräkningsmodeller för vedegenskaper - ettverktyg för bättre utnyttjande av massaveden. <strong>The</strong> Forestry <strong>Research</strong> Institute of Sweden,Uppsala, Resultat No. 3 2003, 4 pp. (In Swedish).Moberg, L. & Wilhelmsson, L. 2003b. New tools for predicting wood properties improveutilization of pulpwood. <strong>The</strong> Forestry <strong>Research</strong> Institute of Sweden, Uppsala, Sweden,Results No. 2/2003, 4 pp.Skutin, S.G. 2005. Virkesstyrningssystem – problem idag och möjligheter i morgon. En109
intervjuundersökning inom <strong>Heureka</strong> fas 1. Skogforsk, working report (manuscript).Thor, M., Arlinger, J. & Stenlid, J. 2005. Stubbehandling mot rotröta lönsam – också islutavverkning. Skogforsk Resultat nr 9. (In Swedish.)Thor, M., Arlinger, J. & Stenlid, J. 2005. Stump treatment profitable in final felling too.Skogforsk Results No. 3.Wikström, P. 2005b. Rapport från test 1 av applikationen för strategisk/taktisk planeringpå Sveaskog. Stencil 2005-09-05.Working papersAndersson; M., Kindstrand, C., Boman, M., Mattsson, L. & Gong, P. 2005. Coping withnon-timber benefits in forest management: An economic perspective. SLU, Dept ofForest Economics, Working report 353.Barth, A., Hannrup, B., Möller, J. & Wilhelmsson, L. 2008. Validering av FORAN Single-Tree® Method. Skogforsk, Working Report No. 666. (In Swedish).Bohlin, J. 2005. Visualisering av skog och skogslandskap - erfarenheter från användningav Visual Nature Studio 2 och OnyxTree. Department of Forest Resource Managementand Geomatics, SLU, Working report no 136.Boman, M., Huhtala, A., Nilsson, S., Ahlroth, S., Bostedt, G. Mattsson, L. & Gong, P. 2003.Applying the Contingent Valuation Method in Resource Accounting: A bold proposal.Working Report No. 85, National Institute of Economic <strong>Research</strong>, Stockholm.Ekstrand, M. and Skutin, S-G. 2005. Virkesstyrningssystem, slutrapport för applikationenoperativ planering inom forskningsprogrammet <strong>Heureka</strong>, fas 1. Skogforsk, workingreport (manuscript).Elfving, B. 2003a. Top height development in spruce plantations. SLU, Dept. of Silviculture.Working Papers 185. (In Swedish).Elfving, B. 2003b. Assigning age to individual trees in growth predictions. SLU, Dept. ofSilviculture. Working Papers 182. (In Swedish).Elfving, B. 2009. Growth modeling in the <strong>Heureka</strong> System. (in prep).Eriksson L. 2008. Treatment decisions in privately owned forestry. Report 11/2008.Dept. of Forest Products. Swedish University of Agricultural Sciences. ISSN:1654-1383.In Swedish with English summary.Freeman, M. & Elfving, B. 2005. Empiriska produktionsmodeller och klimatförändringar-tillämpning av process baserad modellering. (Empirical growth models and climatechange- applying process based modeling).Forsberg, M. 2003. Transportsamordning Nord – analys av returtransporter. Skogforsk,Working report No. 529, 2003 (in Swedish).Granqvist Pahlén, T., Nilsson M., Egberth, M. & Hagner, O. 2005. “kNN-Sverige 2000– Rikstäckande uppskattningar av skogliga variabler med satellitdata från Landsat ochprovytedata från riksskogstaxeringen.” Department of Forest Resource Management andGeomatics, SLU, Working report no 136.Hannrup, B. et al. (manuscript). Model description MOE and MOR on centerboardsfrom logs. <strong>Heureka</strong> . 4ppHannrup, B. 2004. Funktioner för skattning av barkens tjocklek vid avverkning medskördare. <strong>The</strong> Forestry <strong>Research</strong> Institute of Sweden, Uppsala, Work report No 575, 35pp. (In Swedish).Hansson, P.2008. Förstudie av mjukvara för skoglig inventering. Stencil. 41 p110
Lanvin, J-D. Bajric, F. Wilhelmsson, L. Moberg, L. Arlinger, J. Möller, J. Bramming, J.Nordmark, U. 2007. D3.2 Existing models and model gap analyses for wood properties.Results from the EU-Integrated Project, Sixth Framework <strong>Programme</strong>, Priority 2, InformationSociety Technologies, n° 34732: INDISPUTABLE KEY. European Commission.51 pp.Moberg, L. 2005a. Models of stem taper and eccentricity for Norway spruce and Scotspine. <strong>The</strong> Forestry <strong>Research</strong> Institute of Sweden, Uppsala, Work report No. 591.Olofsson, K. 2003. TreeD version 0.8, An Image Processing Application for Single TreeDetection. SLU, Inst för skoglig resurshushållning och geomatik. Arbetsrapport 106.Tomé, M. & Fais, S. (eds), 2007. Report describing version 1 of the regional simulators.EFORWOOD Tools for Sustainability *Impact Assessment. Deliverable PD 2.5.6.Wallerman, J. 2009. Krycklan. Working report (in progress).Wilhelmsson, L. 2005a. Characterisation of stem, wood and fiber properties - industrialrelevance. <strong>The</strong> Forestry <strong>Research</strong> Institute of Sweden, Uppsala, Work report No 590. 25pp.Wilhelmsson, L. 2007. Model for calculation of fibre collaps resistance. <strong>Heureka</strong> 4 pp.Öhman, K. 2007. Rumslig hänsyn i skoglig planering. Arbetsrapport 195, SLU.Papers in Conference proceedingsAndersson, G. 2004. Logistikvision 2004. Proceedings of the <strong>Research</strong> & DevelopmentConference 2004. Skogforsk, Redogörelse No. 1, 91-92, 2004 (In Swedish)Arlinger, J., Moberg, L., Möller, J.J. & Wilhelmsson, L. Automatic timber quality determinationusing wood property models and harvester measurements. 2009. In Dykstra, D.& Monserud, R. (Eds.): Proceedings from the conference ”Forest Growth and TimberQuality: Crown Models and Simulation Methods for Sustainable Forest Management”.Portland, Oregon, USA, August 7-10, 2007.Backéus, S., Lämås, T. and Wikström, P. 2003. Regional analyses of carbon sequestrationand timber production potentials - A case study in northern Sweden. In: Vacik, H. et al[eds.]: Decision support for multiple purpose forestry. A transdisciplinary conference onthe development and application of decision support tools for forest management, April23-25, 2003, University of Natural Resources and Applied Life Sciences, Vienna, Austria,CD-Rom Proceedings.Bohlin, J., Olsson, H., Olofsson, K. & Wallerman, J. 2006. Tree species discriminationby aid of template matching applied to digital air photos. In: Proceedings, InternationalWorkshop, 3D Remote sensing in forestry. Vienna. 14th-15th Feb. 2006. pp 199-203.Boman, M. 2003. Vilt och välfärdsekonomi. Kungl. Skogs- och LantbruksakademiensTidskrift Årg 142, Nr 2, pp. 35-39. (In Swedish)Domeij, E. & Elfving, B. 2001. A method to estimate leaf area and biomass of old Scotspine trees with image analysis. Abstract in: LeMay, V. and Marshall, P. 2001. (Eds.) Forestmodelling for ecosystem management, forest certification and sustainable management.Proceedings, UBC, Canada, p. 469.Elfving, B. 2002. Growth and yield models for uneven-aged stands. Extended abstract inproceedings from the SNS Meeting 2001: Nordic Trends in Forest Inventory, ManagementPlanning and Modelling. METLA <strong>Research</strong> Report 860, p. 133-139.Elfving, B, Freeman, M., and Mörling, T. 2005. Correlation between weather conditionsand tree growth for Scots pine and Norway spruce in northern Sweden. In: (Innes, J.L.,111
Edwards, I.K., and Wilford, D.J. eds.) Forest in the balance: Linking tradition and technology,XXII IUFRO World Congress, 8-13 August, Brisbane, Australia. Abstracts. InternationalForestry Review, Vol 7(5), No 28, August 2005.Eriksson L. & Lindhagen A. 2001. A model indicating effects of multipurpose use of forestryon stand level. EFI Proceedings no. 37.Eriksson, L.O. and Lämås, T. 2001. Analysis and planning systems for multi-resource, sustainableforestry - <strong>The</strong> <strong>Heureka</strong> research programme at SLU. In: Proceedings from theIUFRO conference “Forest Modelling for Ecosystem Management, Forest Certification,and Sustainable Management Conference”, Vancouver, BC, Canada, Aug. 12-17, 2001. pp81-89.Eriksson, L.O., Lämås, T, Sallnäs, O. 2000. Swedish efforts for a sustainable, multi-resourceforestry. <strong>The</strong> role of research in management planning. In: Forests and Society: <strong>The</strong> Roleof <strong>Research</strong>. Vol. 2, Abstracts of group discussions, p. 129. Proceedings from the XXIIUFRO World Congress 2000, 7-12 Aug. 2000, Kuala Lumpur, Malaysia.Eriksson, L.O., Lämås, T. 2002. Analysis and Planning Systems for Multi-Resource, SustainableForestry – the <strong>Heureka</strong> <strong>Research</strong> <strong>Programme</strong>. In: Heikkinen, J., Korhonen, K.T., Siitonen, M., Strandström, M and Tomppo, E. (eds). Nordic trends in forest inventory,management planning and modelling. Proceedings of SNS Meeting in Solvalla, Finland.April 17-19, 2001. Finnish Forest <strong>Research</strong> Institute, <strong>Research</strong> Papers 860, pp 139-147.Forsberg, M. and Rönnqvist, M. 2003. Integrated logistics management in the forest supplychain. Proceedings of the 2nd Forest Engineering Conference, Växjö, May 12-15,Sweden, 2003. Decision support system/tools: Integrated logistics management in theforest supply chain, 64-73, 2003.Forsberg, M. 2004. Planeringsverktyg för effektivare logistik. Proceedings of the<strong>Research</strong> & Development Conference 2004. Skogforsk, Redogörelse No. 1, 93-95, 2004(in Swedish with English summary).Forsberg, M., Frisk, M. and Rönnqvist, M. 2004. FlowOpt - Strategic planning of transportsintegrating truck and train. Proceedings of the Forest IT 2004 Congress, Jyväskylä,Finland 1 September 2004. CD with pdf-files.Fransson, J.E.S., Magnusson, M., and Holmgren, J. 2004. Estimation of forest stem volumeusing optical SPOT-5 satellite and laser data in combination. In Proceedings ofIGARSS 2004 Symposium, Science for Society, Anchorage, Alaska, 20-24 September,2004, 5 pages (DVD).Freeman, M., Wikström, P. & Elfving, B .2008. Adjustment of an empirical growth andyield model to account for effects of climate change on forest production. In Adaptationof Forests and Forest management to Changing Climate with Emphasis on ForestHealth. A review of Science, Policies and Practices, Book of abstracts, international Conference,Umeå, Sweden 25-28 Aug 2008.Frisk, M. and Ekstrand, M. 2004. Development of logistic tools for Swedish forestry. Proceedingsof the NSR Conference of Forest Operations 2004, Hyytiälä Forest Field Station,Finland 30-31 August 2004, Silva Carelica 45, 181-186, 2004.Frisk, M. 2004. VägRust underlättar planeringen. Proceedings of the <strong>Research</strong> & DevelopmentConference 2004. Skogforsk, Redogörelse No. 1, 96-97, 2004 (in Swedish withEnglish summary).Hagner, O. and Olsson, H. 2004. Normalisation of Within-Scene Optical Depth Levelsin Multispectral Satellite Imagery Using National Forest Inventory Plot Data. In: Pro-112
ceedings from the 24th EARSeL Symposium, Workshop on “Remote sensing of landuse and land cover”, Dubrovnik, Croatia, May 28-29, 2004.Holmgren, J., and Wallerman, J. 2005. Estimation of tree size distributions by combiningvertical and horizontal distribution of laser measurements with extraction of individualtrees. Abstract accepted for oral presentation at the 3D Remote Sensing in Forestry,EARSeL, ISPRS Workshop, Vienna, February 2006. (Representing work done in <strong>Heureka</strong>project 9, autumn 2005).Lidén, B. 2004. Effektivare informationsflöden – hur löser vi problemen i vardagen? Proceedingsof the <strong>Research</strong> & Development Conference 2004. Skogforsk, Redogörelse No.1, 110-113, 2004 (in Swedish with English summary).Lind, T. 2002. A blueprint of the Hugin II system . In: Heikkinen, J., Korhonen, K. T.,Siitonen, M., Strandström, M and Tomppo, E. (eds). Nordic trends in forest inventory,management planning and modelling. Proceedings of SNS Meeting in Solvalla, Finland.April 17-19, 2001. Finnish Forest <strong>Research</strong> Institute, <strong>Research</strong> Papers 860, pp 149-152.Lohmander, P., 2002. On risk and uncertainty in forest management planning systems, in:Heikkinen, J., Korhonen, K. T., Siitonen, M., Strandström, M and Tomppo, E. (eds). 2002.Nordic trends in forest inventory, management planning and modelling. Proceedings ofSNS Meeting in Solvalla, Finland, April 17-19, 2001. Finnish Forest <strong>Research</strong> Institute,<strong>Research</strong> Papers 860, p 155-162, ISBN 951-40-1840-0, ISSN 0385-4283Lämås, T. & Dahlin, B. 2001. Swedish efforts for sustainable, multi-resource forestry: thedevelopment of analyses and planning systems within the <strong>Heureka</strong> research programme.In: Proceedings from the conference “New technologies and sustainable forest managementin northern Europe”. <strong>The</strong> Engeneering Faculty, Petrozavodsk State University,Petrozavodsk, Russia, Oct 1-4, 2001. pp. 11-12 (extended abstract).Lämås, T. 2003. <strong>Heureka</strong> – planering och planeringsverktyg för skogsbruket. I: Idéer förframtidens skogslandskap, KSLA och SLU, 2002-02-14, Umeå. Kungl. Skogs- LantbruksakademiensTidskrift 142(1):95-101.Mikusiński, G., Edenius, L. & Ståhl, G. 2005. Linking species requirements with landscapeinformation in forest biodiversity management – some examples of Europeanexperiences in habitat suitability modelling. Abstract for IUFRO World Congress, 8-13August 2005, Brisbane, Australia.Moberg, L., Wallerman, J., Holmgren, J., & Barth, A. 2008. High-precision inventorymethods to predict wood properties for operational, pre-harvest planning. IUFROWorking Party 5.01.04 Wood Quality Modeling. Koli, FinlandMoberg, L. & Nordmark, U. 2004. Planering för kundorienterat sågtimmer - prognostiseringav stockens egenskaper i skogen. In: Timmer för en lönsammare träkedja. Proceedingsfrom ”Virkesdagarna 2004” held in Uppsala, Sweden on 8-9 Nov. 2004, <strong>The</strong>Forestry <strong>Research</strong> Institute of Sweden, Uppsala, Sweden. (In Swedish).Nilsson, M. 2002. Deriving nationwide estimates of forest variables for Sweden usingLandsat ETM+ and field data. In: Proceedings of the ForestSAT 2002 conference onOperational Tools in Forestry using Remote Sensing Techniques, August 5th-9th, Edinburgh,Scotland.Nilsson, M., Holm, S., Reese, H., Wallerman, J. & Engberg, J. 2005. Improved forest statisticsfrom the Swedish national Forest Inventory by combining field data and opticalsatellite data using post-stratification. In: Proceedings of ForestSAT 2005 in Borås. May31-June 3. Report 8a. pp. 22-26.Nilsson, M., Holm, S., Wallerman, J., Reese, H. & Olsson, H. 2007. Estimating annualcuttings using multi-temporal satellite data and field data from thhe Swedish NFI. In:113
ForestSAT 2007 Conference, Montpellier, France, November 5-7.Olofsson, K. 2001. Fjärranalys av enskilda träd. Sammanfattning av föredrag,. Proceedingsfrån Skogskonferensen - Effektiv drift i skogen, Uppsala, 4-5 december, 2001. ISBN:91-576-6128-6, sida 16-17. (In Swedish).Olofsson, K. 2002. Detection of single trees in aerial images using template matching.ForestSat 2002, Operational Tools in Forestry using Remote Sensing Techniques. ProceedingsCD-ROM, talk FI6.3, session Forest Inventory 6, Monitoring Forest Establishmentand Development. Published by Forest <strong>Research</strong>, Forestry Commission.Olofsson, K., Bohlin, J., Lämås, T. & Olsson, H. 2003. Estimation of forest parametersusing remote sensing single tree detection and field plots with tree positions. Proceedingfrom the Symposium for Systems Analysis in Forest Resources. Oct. 7-9, 2003, Stevenson,WA, USA. PNW-GTR-656, 2005, http://www.fs.fed.us/pnw/publications/gtr656/(Peer reviewed conference contribution)Olsson, H., Sallnäs, O., Nilsson, M., Egberth, M., Sandström, P. and Bohlin, J. 2008. Satellitedata time series for forecasting, habitat modeling and visualization of the managedboreal forest landscape. In: proceedings from the XXI ISPRS Congress, Bejing, July 3-11,2008, International Archives of Photogrammetry, Remote Sensing and Spatial InformationSciences vol XXXVII Part b8, pp.1007-1012. (www.isprs.org).Persson, Å., Holmgren, J., Söderman, U., and Olsson, H. 2004. Tree species classificationof individual trees in Sweden by combining high resolution laser data with high resolutionnear-infrared digital images. International Society of Photogrammetry and RemoteSensing, Proceedings of the ISPRS working group VIII/2, Laser-Scanners for Forest andLandscape Assessments, Freiburg, Germany, 2004-10-03 to 2004-10-06.Reese, H., Granqvist-Pahlén, T., Egberth, M., Nilsson, M. & Olsson, H. 2005. Automatedestimation of forest parameters for Sweden using Landsat data and the kNN algorithm.In: Proceedings for the 31:st International Symposium on Remote Sensing of the Environment.June 20-24, 2005. St. Petersburg, Russia.Stendahl, J. Seibert, & J. Sörensen, R. 2005. Spatial variability in soil carbon stocks andrelations to topography at the landscape level. Poster: Focus on Soils symposium, Uppsala14-16 September, 2005Thor M, Möykkynen T, Pratt JE, Pukkala T, Rönnberg J, Shaw CG III, Stenlid J, StåhlG& Woodward S. 2004. Modeling infection and spread of Heterobasidion annosum inconiferous forests in Europe. In: Bevers M, Barrett TM, (eds.) Systems Analysis in ForestResources: Proceedings of the 2003 Symposium; October 7-9, Stevenson, WA. ProceedingsRMRS-P-000. Ogden, UT. U.S. Department of Agriculture, Forest Service, RockyMountain <strong>Research</strong> Station. pp 105-111.Wallerman, J. & Holmgren, J. 2005. Data Capture for Forest Management PlanningUsing Sample Plot Imputation Based on Laser Scanner and Satellite Image Data. Forest-Sat 2005: Operational tools in forestry using remote sensing techniques, May 31 - June3, Borås, Sweden.Wallerman, J., Holmgren, J., & Moberg, L. 2007. Data acquisition for harvest schedulingusing single-tree detection in LIDAR data. ForestSAT 2007. Montpellier, France.Wilhelmsson, L. 2008. Är de nya kubikmetrarna lika värdefulla som de gamla? Dokumentation.Sammanfattningar och Powerpoint-presentationer. Utvecklingskonferens 08,Skogforsk (presenterat i Sundsvall, Växjö, Västerås)Wilhelmsson, L. Arlinger, J D. Moberg, L. Möller, J J. 2007. Intelligent CTL harvestingbased on cost-benefit analyses for value chain optimization. In: Gingras, J F. (ed.). Pro-114
ceedings 3rd Forest Engineering Conference Mont-Tremblant , Quebec, Canada October1-4. 18 p.Wilhelmsson, L. Arlinger, J. Nordström, M. and Westlund, K. 2009. Economic and environmentalimprovements to wood supply in the context of whole forest-wood chainsby means of operative predictions of costs and benefits in monetary, environmental andworking-hour units – a connection between Eforwood and Indisputable Key. Posterpresentation at Eforwood Final Conference, Uppsala 23-24 Sept.Wikberg, P-E. & Elfving, B. 2001. Recruitment of trees – modelling establishment andingrowth of Norway spruce in older forests. Abstract in: LeMay, V. and Marshall, P. 2001.(Eds.) Forest modelling for ecosystem management, forest certification and sustainablemanagement. Proceedings, UBC, Canada.Öhman, K. & Wikström, P. 2005. Optimization of landscape structure in long-term forestplanning. In: Proceedings from the conference “Bridging the gap - Policies and scienceas tools in implementing Sustainable Forest Management”.October 17-19/21, 2005,Alnarp, South Sweden.Popular scientific publicationsAnon., 2003. Att planera för skogen som framtida resurs. Miljötrender Nr 1, 2003. pp6-7.Anon., 2003. Prognosmodeller för skogen. Miljötrender nr 1, 2003.Anon., 2003. Trädens och skogens livscykel. Miljötrender Nr 1, 2003. pp 8-9.Anon., 2003. Modell visar hur döda träd förmultnar. Miljötrender Nr 1, 2003. pp 10-11.Anon., 2003. <strong>Heureka</strong> ger stöd för hållbart skogsbruk. Miljöaktuellt 3/2003, p 10.Anon., 2004. Planeringsverktyg för biologisk mångfald. Miljötrender 3-4 2004, pp 14-15.Barth, A. 2008. Flygburen laser gav bättre data om träden. Skogforsk, Result No. 15. (InSwedish with English summary).Bergh, J., Flemberg, S., Kindberg, J., Linder, S., Räisinen, J., Strömgren, M. & Wallin, G.2000. Framtida klimatförändringar – tänkbara effekter på den svenska skogen . SLU.Fakta Skog nr 13.Bohlin, J. 2005. Dator-visualisering av skog. In: Ingemarson, F. (Ed.) 2005. Har skogenmer att ge? <strong>Heureka</strong> årsrapport 2004. Fakulteten för skogsvetenskap, SLU. Rapport nr20. Umeå. 147-151 (In Swedish with English summary).Bohlin, J. & Olsson H. 2005. Datorvisualisering av skogslandskap. Fakta Skog, Nr 04.Bohlin, J. & Olsson H. 2005. Datorvisualisering av framtidens skogslandskap. Kart ochBildteknik Nr 3.Boman, M., Mattsson, L. & Gong, P. 2003. Om betydelsen av osäkerhet och skogensmånga värden. SUFORs Årsskrift 2002, pp. 15-18. (In Swedish)Boman, M., Mattsson, L., Norman, J. & Kindstrand, C. 2005c. Icke marknadsprissattanyttigheter (Non-market priced utilities) In: Ingemarson, F. (Ed.) 2005. Har skogen meratt ge? <strong>Heureka</strong> årsrapport 2004. Fakulteten för skogsvetenskap, SLU. Rapport nr 20.Umeå. 100-108 (In Swedish.)Edenius, L. & Mikusiński, G. 2004. Landskapet ur arters perspektiv. Miljöaktuellt, SLUUppsala.Edenius, L. & Mikusiński, G. 2004. Planeringsverktyg för biologisk mångfald. Miljötrender3-4:14-15.115
Edenius, L. & Mikusiński, G. 2005. Planeringsverktyg för biologisk mångfald i morgondagensskogar. FaktaSkog 2:2005 (In Swedish).Edenius, L. & Mikusiński, G. 2004. Sammanfattning från <strong>Heureka</strong>s vårexkursion, Remningstorp13 maj 2004.Edenius, L. & Mikusiński, G. 2005. Planeringsverktyg för biologisk mångfald (Planningtools for biological diversity) In: Ingemarson, F. (Ed.) 2005. Har skogen mer att ge?<strong>Heureka</strong> årsrapport 2004. Fakulteten för skogsvetenskap, SLU. Rapport nr 20. Umeå.83-89 (In Swedish)Edenius, L. & Mikusiński, G. 2008. Habitat förutsäger biologisk mångfald i skogslandskapet!Årsrapport, <strong>Heureka</strong> 2007, p. 13-14,Edenius, L., Mikusiński, G., Green, M., Lindström, Å. & Ottvall, R. Coarse habitat classificationschemes as predictors of forest bird occurrence on stand and landscape scale:implications for conservation planning. Manuscript in progress.Elfving, B. 2005b. Trädens tillväxt (Tree growth) In: Ingemarson, F. (Ed.) 2005. Har skogenmer att ge? <strong>Heureka</strong> årsrapport 2004. Fakulteten för skogsvetenskap, SLU. Rapportnr 20. Umeå. 75-82 (In Swedish)Eriksson, L., Ingemarson, F. & Lindhagen, A. 2005. Skogsägarens mål och åtgärder iskogsbruket. (Goals and activities of the small-scale forest owner) In: Ingemarson, F. (Ed.)2005. Har skogen mer att ge? <strong>Heureka</strong> årsrapport 2004. Fakulteten för skogsvetenskap,SLU. Rapport nr 20. Umeå. 114-122 (In Swedish)Freeman, M. 2005. Skogens produktion ökar när klimatet blir varmare (<strong>The</strong> forest productionincreases when climate turns warmer) In: Ingemarson, F. (Ed.) 2005. Har skogenmer att ge? <strong>Heureka</strong> årsrapport 2004. Fakulteten för skogsvetenskap, SLU. Rapport nr20. Umeå. 75-82 (In Swedish).Granqvist Pahlén, T, Nilsson, M., Egberth, M., Hagner, O. & Olsson, H. 2004. kNN-Sverige: Aktuella kartdata över skogsmarken. Fakta Skog, Nr 12.Hagner, O. & Joyce, S. 2005. Obemannade flygplan. In: Ingemarson, F. (Ed.) 2005. Harskogen mer att ge? <strong>Heureka</strong> årsrapport 2004. Fakulteten för skogsvetenskap, SLU. Rapportnr 20. Umeå. 143-147 (In Swedish)Holmgren, J. 2005. Mätning av enskilda träd. In: Ingemarson, F. (Ed.) 2005. Har skogenmer att ge? <strong>Heureka</strong> årsrapport 2004. Fakulteten för skogsvetenskap, SLU. Rapport nr20. Umeå. 138-143 (In Swedish).Jakobsson, R. 2005. Inverkan av evighetsträd och beståndskanter på virkesproduktionen.SLU, Fakta Skog, nr 5 2005.Joyce, S., Hagner, O., och Olsson, H. 2005. Ny teknik – gör civil låghöjdsfotograferingmed små obemannade flygplan allt mer realistiskt. Kart och Bildteknik 2005:2, pp. 8-11.Lind, T. 2005. Applikationen för regional analys. I: Ingemarsson, F (editor). Har skogenmer att ge? <strong>Heureka</strong> årsrapport 2004. Fakulteten för skogsvetenskap, SLU, Rapport nr20: 33-36 (In Swedish).Lindhagen, A. 2005. Modellering av rekreationsvärde (Modelling the recreational value).In: Ingemarson, F. (Ed.) 2005. Har skogen mer att ge? <strong>Heureka</strong> årsrapport 2004. Fakultetenför skogsvetenskap, SLU. Rapport nr 20. Umeå. 108-114 (In Swedish)Lohmander, P., 2001. Optimala beslut inför osäker framtid, Fakta Skog, SLU, Nr 10, 2001Lohmander, P., 2002a. Kan skogen vara otillräcklig? Västerbottenskuriren Debatt, 2003-10-06.Lohmander, P., 2002b. Rationella överväganden och kalkyler behövs i skogsnäringenprecis som på andra håll i samhället, Västerbottens-Kuriren Debatt, 2002-06-21.116
Lämås, T., Ståhl, G. och Dahlin, B. 2003. <strong>Heureka</strong> – better decisions in forestry! Stencil. 4ppLämås, T., Ståhl, G. och Dahlin, B. 2003. <strong>Heureka</strong> – för bättre beslut i skogen! SLU, FaktaSkog 8/2003. 4 pp (In Swedish)Lämås, T., Dahlin, B. 2006. <strong>Heureka</strong> – analys och planeringssystem för mångbruk ochmiljö. Metsätieteen aikakauskirja 1/2006: 66 - 71.Magnusson, M. & Fransson, J. 2005. Beståndsvis skattning av virkesförråd med olikafjärranalystekniker In: Ingemarson, F. (Ed.) 2005. Har skogen mer att ge? <strong>Heureka</strong> årsrapport2004. Fakulteten för skogsvetenskap, SLU. Rapport nr 20. Umeå. 129-138 (InSwedish)Mattsson, L., Boman, M. & Kindstrand, C. 2004. Värderingar och visioner bland privatskogsägarnaoch “deras” skogstjänstemän. I: Björk, L. & Sallnäs, O. (red.): SUFOR Årsskrift2003, Tema: Uthålligt skogsbruk ur privatskogsägares perspektiv. Alnarp: SUFOR,s. 5-9. (In Swedish)Mattsson, L, Lindhagen, A. & Boman, M. 2004c. Miljövärden. In: Analyssystem förett uthålligt och mångbruksinriktat skogsbruk. Forskningsprogram <strong>Heureka</strong>. Årsrapport(Annual report) 2003, pp. 18-21. (In Swedish)Mattsson, L., Norman, J. & Boman, M. 2004. Skogen och välfärden: Osäkerhet medmånga dimensioner. I: Blennow, K. (red.): Osäkerhet och aktiv riskhantering - Aspekterpå osäkerhet och risk i sydsvenskt skogsbruk. Alnarp: SUFOR, s. 82-95. (In Swedish)Mikusiński, G. & Edenius, L. 2007. Zonation testas I Örebro län. Forskningsprogram<strong>Heureka</strong>. Årsrapport (Annual report) 2006. pp 10-11. (In Swedish)Moberg, L. 2005c. Projekt virkesegenskaper (Project wood properties). In: Ingemarson,F. (Ed.) 2005. Har skogen mer att ge? <strong>Heureka</strong> årsrapport 2004. Fakulteten för skogsvetenskap,SLU. Rapport nr 20. Umeå. 151-156 (In Swedish)Nilsson, M. 2005. kNN-Sverige – en heltäckande database med skogliga variabler. In:Ingemarson, F. (Ed.) 2005. Har skogen mer att ge? <strong>Heureka</strong> årsrapport 2004. Fakultetenför skogsvetenskap, SLU. Rapport nr 20. Umeå. 128-133 (In Swedish)Nyström, K. 2005. Tillkomst av nya träd – beståndsetablering och inväxning (Establishmentof new trees – regeneration and in-growth). In: Ingemarson, F. (Ed.) 2005. Harskogen mer att ge? <strong>Heureka</strong> årsrapport 2004. Fakulteten för skogsvetenskap, SLU. Rapportnr 20. Umeå. 59-64 (In Swedish)Olsson, H. 2005. Nya metoder för datainsamling. Under publication in Kungliga Skogsoch Lantbruksakademiens Tidskrift. No 7, pp 10-15.Petersson, H. & Sandström F. 2005. Död ved, biomassa & kol (Dead wood, biomass andcarbon) In: Ingemarson, F. (Ed.) 2005. Har skogen mer att ge? <strong>Heureka</strong> årsrapport 2004.Fakulteten för skogsvetenskap, SLU. Rapport nr 20. Umeå. 95-97 (In Swedish)Rönnqvist, M. & Frisk, M. 2005. FlowOpt – ett flexibelt planeringsverktyg för skogliglogistik (FlowOpt – a flexible planning tool for foreestry logistics) In: Ingemarson, F.(Ed.) 2005. Har skogen mer att ge? <strong>Heureka</strong> årsrapport 2004. Fakulteten för skogsvetenskap,SLU. Rapport nr 20. Umeå. 75-82 (In Swedish)Skutin, S.G., Andersson, G., Frisk, M., Lidén, B. & Rönnqvist, M. 2005. ApplikationenOperativ planering – pleneringsverktyg för effektiv logistik (<strong>The</strong> application operatioanlplanning – planningtools for effient logistics) In: Ingemarson, F. (Ed.) 2005. Har skogenmer att ge? <strong>Heureka</strong> årsrapport 2004. Fakulteten för skogsvetenskap, SLU. Rapport nr20. Umeå. 50-58 (In Swedish)117
Stendahl, J. 2005. Mark (Soils) In: Ingemarson, F. (Ed.) 2005. Har skogen mer att ge?<strong>Heureka</strong> årsrapport 2004. Fakulteten för skogsvetenskap, SLU. Rapport nr 20. Umeå.75-82 (In Swedish).Ståhl, G. 2003. Hjälp att förutse miljöåtgärder. Miljötrender Nr 1, 2003. p 2. (In Swedish)Sundblad, L-G, Thor, M. Wilhelmsson, L. Linander, F. Hannerz, M. 2008. Hjälpmedel förinventering av rotröta i stående skog. Resultat 18. Skogforsk (Uppsala). 4 pp.Söderberg, U. 2005. Naturlig avgång (Mortality) In: Ingemarson, F. (Ed.) 2005. Har skogenmer att ge? <strong>Heureka</strong> årsrapport 2004. Fakulteten för skogsvetenskap, SLU. Rapportnr 20. Umeå. 72-74 (In Swedish)Thor, M., Ståhl, G. & Stenlid, J. 2004. Räkna med rotröta – nytt hjälpmedel för skogligplanering. Skogforsk Resultat nr 13. (In Swedish.)Thor, M. and Stenlid, J. 2004. Root rot. A growing problem. In: <strong>Research</strong> & DevelopmentConference 2004. Skogforsk, Redogörelse nr 1, 2004. (In Swedish with a summaryin English).Thor, M., Ståhl, G., Stenlid, J. 2004. Model for predicting root rot. A new tool for forestryplanning. Skogforsk, Results no 5, 2004Thor, M. & Stenlid, J. 2005. Rotröta (Root rot). In: Ingemarson, F. (Ed.) 2005. Har skogenmer att ge? <strong>Heureka</strong> årsrapport 2004. Fakulteten för skogsvetenskap, SLU. Rapportnr 20. Umeå. 157-162 (In Swedish)Wikström, P. 2005a. Applikationen för långsiktig planering. In: Ingemarson, F. (Ed.) 2005.Har skogen mer att ge? <strong>Heureka</strong> årsrapport 2004. Fakulteten för skogsvetenskap, SLU.Rapport nr 20. Umeå. 44-50 (In Swedish with English summary)Wikström, P., Klintebäck, F., Westling, J. BeståndVis- en simulator för analys av skogsskötsel.Fakta Skog No. 4 2008Öhman, K., Edenius, L., Eriksson, L-O,. Mikusinski, G. Habitatmodeller och flermålsanalys-en väg till effektivare planering av skogslandskapet. Fakta Skog No. 5 2008.Other publicationsAnon., 2002. Analysis systems for sustainable multi-purpose forestry. <strong>The</strong> <strong>Heureka</strong> <strong>Programme</strong>.<strong>Programme</strong> plan Oct. 2002 - Sept. 2005. Revised Dec. 17, 2002.Anon., 2003. Bättre beslut i skogen. Exkursionshandledning, Ultuna 8 maj 2003. (InSwedish)Anon., 2004. Analysis systems for sustainable multi-purpose forestry. <strong>The</strong> <strong>Heureka</strong> <strong>Programme</strong>.<strong>Programme</strong> plan 2004. Revised Jan. 19, 2004.Anon., 2004. Årsrapport 2003 Forskningsprogram <strong>Heureka</strong>. 30 pp. (In Swedish)Anon., 2007. Årsrapport 2006. Forskningsprogram <strong>Heureka</strong>. 28 pp.(In Swedish)Anon., 2008. Årsrapport 2007. Forskningsprogram <strong>Heureka</strong>. 26pp. (In Swedish)Anon., 2009. Årsrapport 2008. Forskningsprogram <strong>Heureka</strong>. 26pp. (In Swedish)Anon., 2004. Har skogen mer att ge? Analysverktyg för framtidens miljö, produktion ochsociala värden. Program för Skogskonferensen 2004, Ultuna 30/11-1/12 2004. (In Swedish)Anon., 2004. Skogen har mer att ge! Exkursionshandledning, Remningstorp 13 maj2004. (In Swedish)Anon., 2005. Analysis systems for sustainable multi-purpose forestry. <strong>The</strong> <strong>Heureka</strong> <strong>Programme</strong>.<strong>Programme</strong> plan Jan. - Sept. 2005.118
Anon., 2005. <strong>The</strong> <strong>Heureka</strong> <strong>Research</strong> <strong>Programme</strong>. Development and implementation ofdecision support tools for sustainable and mulit-purpose forestry. <strong>The</strong> second phase programmeplan Oct. 2005- Dec. 2009. (November 30, 2005.)Anon., 2005. <strong>The</strong> <strong>Heureka</strong> <strong>Research</strong> <strong>Programme</strong>. Final report for phase 1, Ocotber 2002– September 2005.Anon. 2006. Analysis systems for sustainable multi-purpose forestry. <strong>The</strong> <strong>Heureka</strong> <strong>Programme</strong>.<strong>Programme</strong> plan 2006.Anon. 2007. Analysis systems for sustainable multi-purpose forestry. <strong>The</strong> <strong>Heureka</strong> <strong>Programme</strong>.<strong>Programme</strong> plan 2007.Anon. 2008. Analysis systems for sustainable multi-purpose forestry. <strong>The</strong> <strong>Heureka</strong> <strong>Programme</strong>.<strong>Programme</strong> plan 2008.Anon., 2007 Mini <strong>Heureka</strong>. Faktablad (in English)Anon., 2007 RegVis. FaktabladAnon., 2007 PlanVis FaktabladAnon., 2007 BeståndsVis. FaktabladAnon., 2008 Ivent. FaktabladAnon. ,2005. Effektivare mångbruk av skogen. <strong>Heureka</strong>s vårexkursion Sundsvall den24/5 2005. Exkursionshandledning.Edenius, L., Lind, T., Lämås, T., Mikusiński, G., Nyström, K., Wallerman, J. & Wikström,P., 2004. Reserapport – Arbetsmöte mellan forskningsprogrammen CLAMS och <strong>Heureka</strong>,2004-09-09 - 11 i Corvallis, Oregon. Stencil.Elfving, B. 2004. Grundytetillväxtfunktioner för enskilda träd, baserade på data från riksskogstaxeringenspermanenta provytor. SLU, Inst för skogsskötsel. Stencil 2004-01-26.(In Swedish)Elfving, B. 2005. En grundytetillväxtfunktion för alla trädslag i hela landet. SLU, Inst förskogsskötsel. Stencil.Ingemarson, F. (Ed.) 2005. Har skogen mer att ge? <strong>Heureka</strong> årsrapport 2004. (Can theforest deliver more? <strong>Heureka</strong> annual report 2004) Faculty of forest science, SLU. Reportno. 20. Umeå (In Swedish with English summary)Mattsson, L., Gong, P. & Boman, M. 2003. Miljöekonomisk skogsforskning. In: Lundgren,L.J. (Ed.): Vägar till kunskap - Några aspekter på humanvetenskaplig och annanmiljöforskning. Stockholm/Stehag: Brutus Östlings Bokförlag Symposion, pp. 149-165.(In Swedish)Ringvall, A. 2009. Nyutvecklade applikationer för avdelningsvis fältinventering. <strong>Heureka</strong>sårsrapport 2008.119
Print & Media, Umeå universitet 2007342. 2010Contact, <strong>The</strong> <strong>Heureka</strong> <strong>Research</strong> <strong>Programme</strong>:<strong>Programme</strong> director: Tomas LämåsDept of Forest Resource ManagementSLU, SE-901 83 Umeå, Sweden+46(0)90 - 786 84 05tomas.lamas@srh.slu.se<strong>Heureka</strong> home 122page: http://heureka.slu.se